In today’s digital-first world, system failures, cyber attacks, and operational disruptions can cost businesses thousands of dollars every hour. However, many organizations still struggle to track incidents, measure recovery time, and analyze downtime effectively.Incident Response and Downtime Analysis Dashboard in Google Sheets
So, how can you monitor incidents, reduce downtime, and improve response efficiency—all in one place?
Incident Response and Downtime Analysis Dashboard in Google Sheets
What is an Incident Response and Downtime Analysis Dashboard?
An Incident Response and Downtime Analysis Dashboard in Google Sheets is an interactive tool that helps organizations track, analyze, and improve incident management performance.Incident Response and Downtime Analysis Dashboard in Google Sheets
Instead of relying on manual reports, this dashboard allows you to:
- 🚨 Track total incidents
- ⏱️ Measure recovery time
- 💰 Calculate downtime costs
- 📊 Monitor RPO (Recovery Point Objective) performance
- 📈 Analyze trends and patterns
Why Do You Need This Dashboard?
Click to Buy Incident Response and Downtime Analysis Dashboard in Google Sheets
Many businesses face frequent downtime but lack proper visibility into its causes and impact.
However, with this dashboard:Incident Response and Downtime Analysis Dashboard in Google Sheets
- You identify root causes quickly
- You reduce system downtime
- You improve incident response time
- You minimize financial losses
Key Features of Incident Response Dashboard
This powerful dashboard includes multiple analytical views, making it a complete solution for incident management.
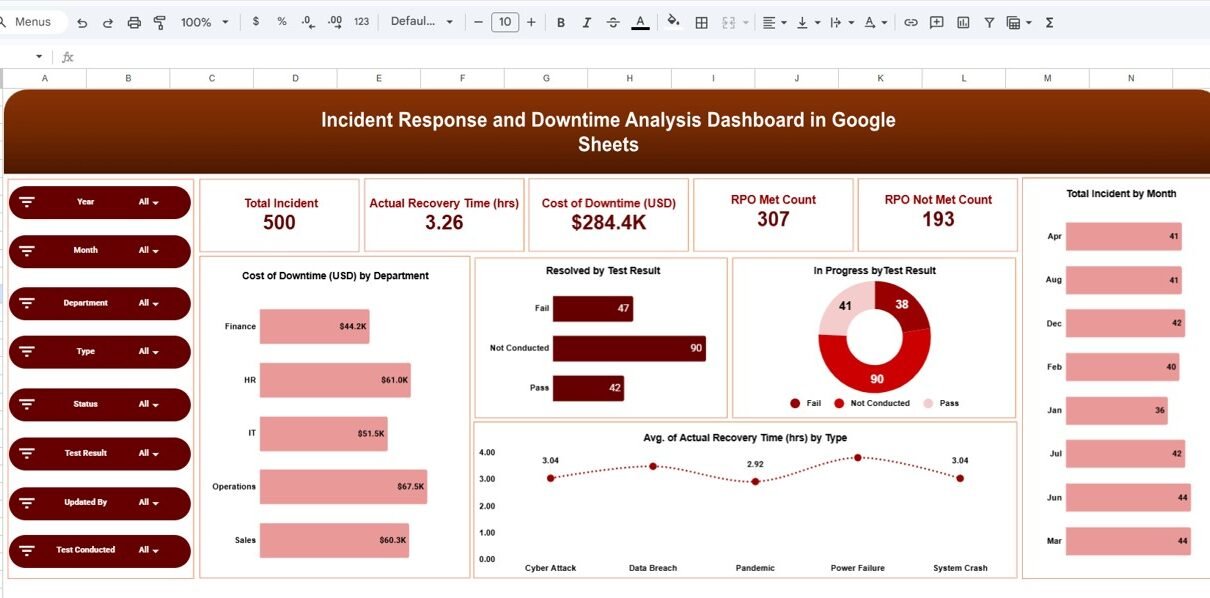
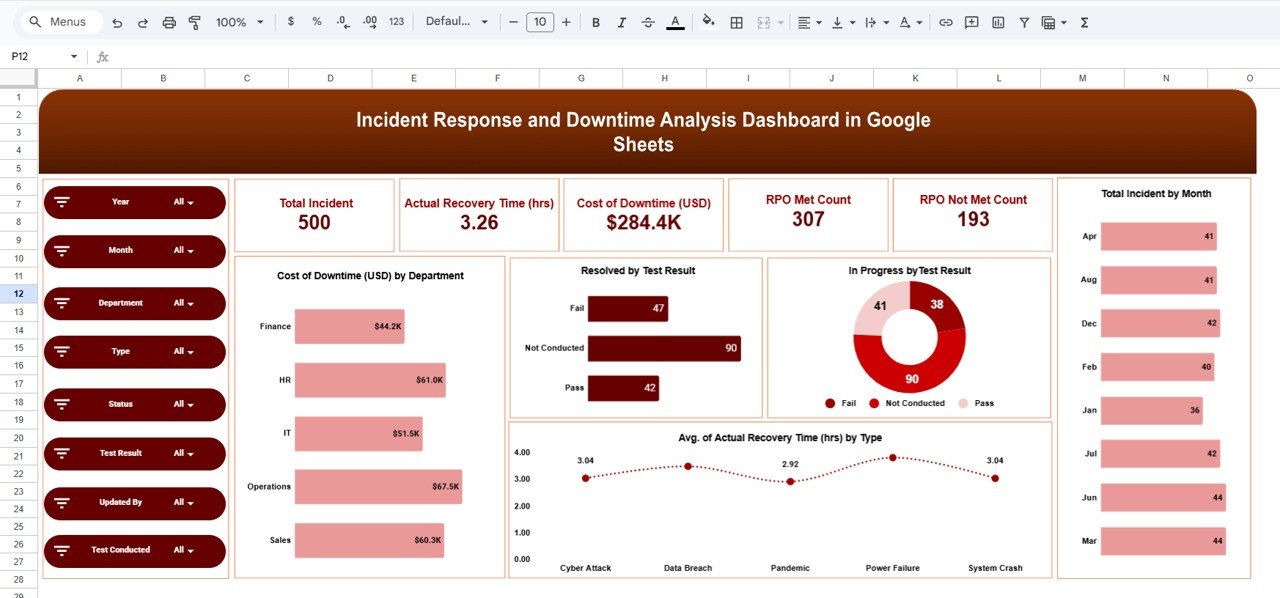
1. Overview Dashboard – Complete Incident Summary
The main dashboard provides a high-level view of all critical metrics.
KPI Cards:
- 🚨 Total Incidents: 500
- ⏱️ Avg Recovery Time: 3.26 hrs
- 💰 Cost of Downtime: $284.4K
- ✅ RPO Met Count: 307
- ❌ RPO Not Met Count: 193
Visual Insights:
- Cost of Downtime by Department
- Resolved by Test Result
- In Progress by Test Result
- Total Incidents by Month
- Avg Recovery Time by Incident Type
Click to Buy Incident Response and Downtime Analysis Dashboard in Google Sheets
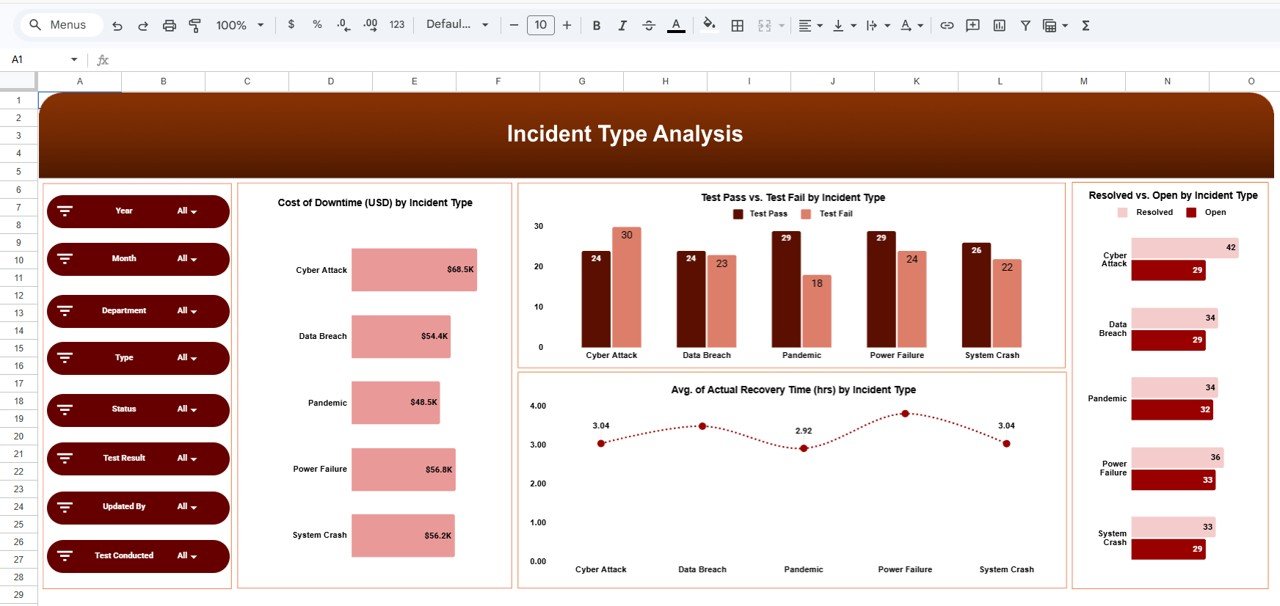
2. Incident Type Analysis – What Causes Downtime?
This page helps you analyze incidents based on type.
Charts:
- Cost of Downtime by Incident Type
- Test Pass vs Fail by Incident Type
- Resolved vs Open Incidents
- Avg Recovery Time by Incident Type
Click to Buy Incident Response and Downtime Analysis Dashboard in Google Sheets
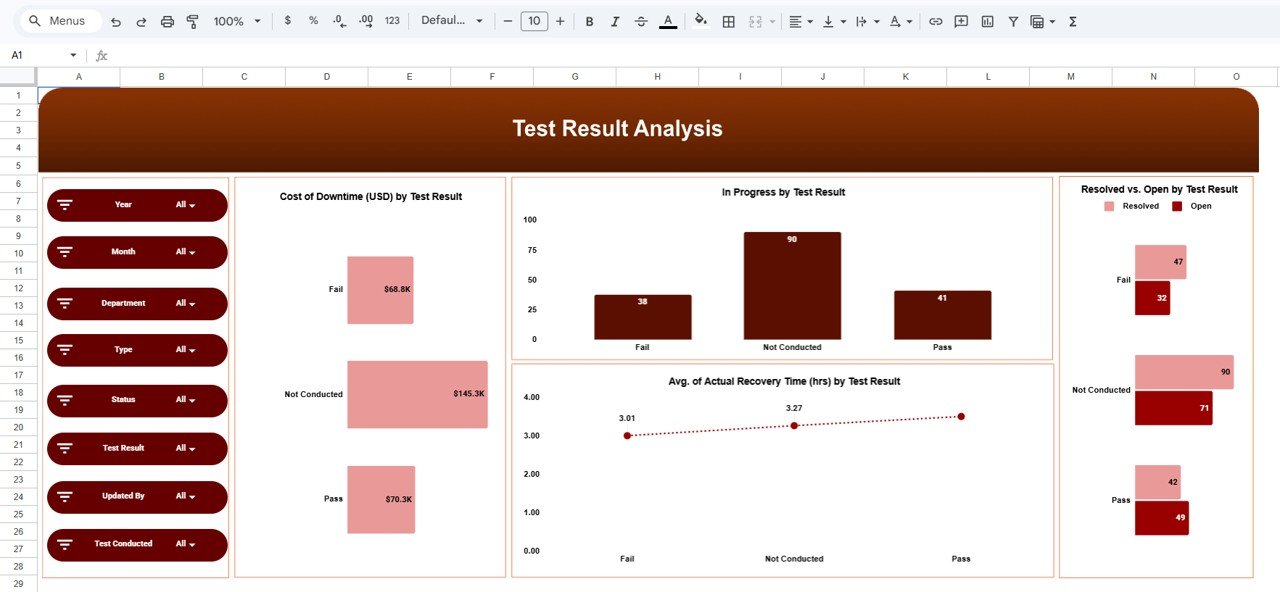
3. Test Result Analysis – Are Systems Reliable?
This page focuses on testing outcomes and system reliability.
Charts:
- Cost of Downtime by Test Result
- In Progress by Test Result
- Avg Recovery Time by Test Result
- Resolved vs Open by Test Result
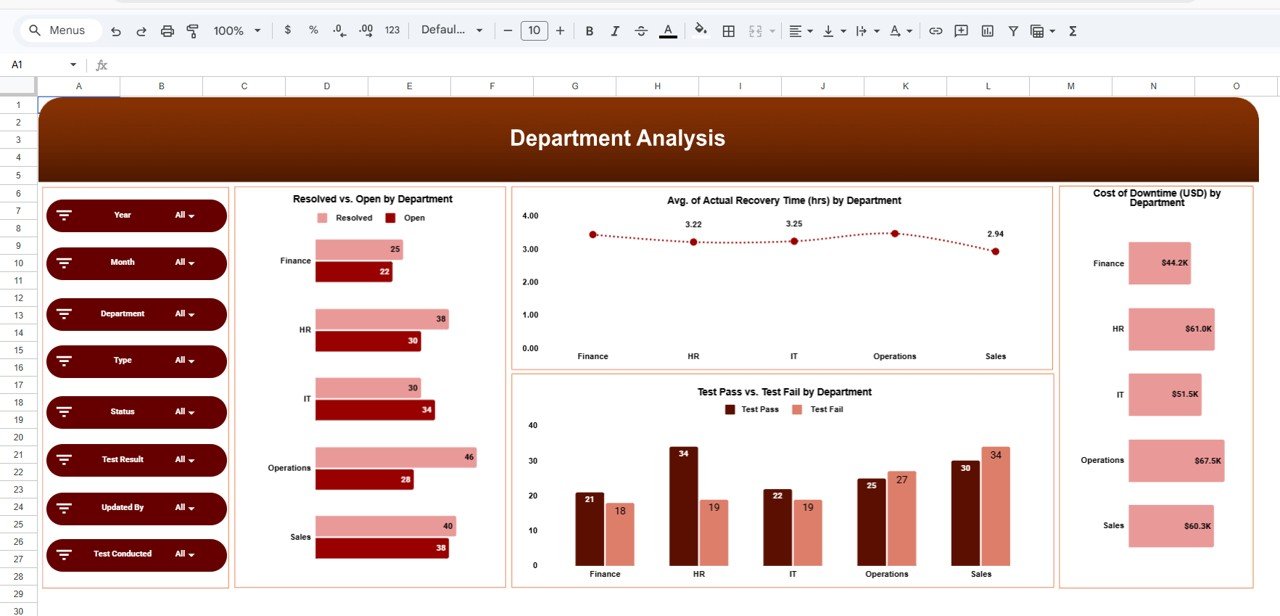
This page analyzes performance across departments.
Charts:
- Resolved vs Open Incidents by Department
- Avg Recovery Time by Department
- Test Pass vs Fail by Department
- Cost of Downtime by Department
Click to Buy Incident Response and Downtime Analysis Dashboard in Google Sheets
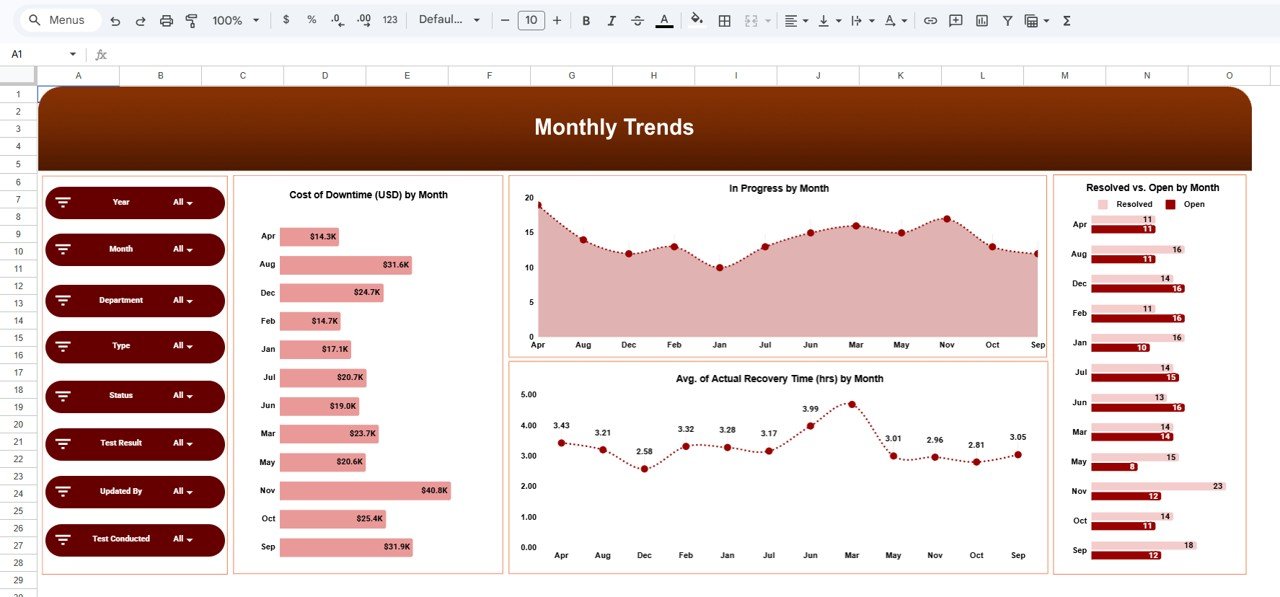
5. Monthly Trends – Track Performance Over Time
This page helps you monitor trends across months.
Charts:
- Cost of Downtime by Month
- Incidents in Progress by Month
- Avg Recovery Time by Month
- Resolved vs Open Incidents by Month
How Does This Dashboard Help Your Business?
This dashboard is not just about tracking data—it helps you take action.
Because:
- You identify problem areas quickly
- You improve response time
- You reduce downtime costs
- You enhance operational efficiency
As a result, your business becomes more resilient and reliable.
Advantages of Incident Response Dashboard
Click to Buy Incident Response and Downtime Analysis Dashboard in Google Sheets
Using this dashboard offers several benefits:
Improved Decision Making
- You get real-time insights
- You respond faster to incidents
Cost Reduction
- You minimize downtime losses
- You optimize resources
Better Visibility
- You track all incidents in one place
- You understand performance clearly
Faster Incident Resolution
- You identify bottlenecks
- You improve response workflows
Continuous Improvement
- You track trends
- You enhance processes
Best Practices for the Incident Response Dashboard
To maximize effectiveness, follow these best practices:
📌 Maintain Data Accuracy
- Enter correct incident details
- Avoid missing data
📊 Focus on Key Metrics
- Track recovery time and cost
- Monitor RPO performance
🔄 Update Regularly
- Keep data up to date
- Monitor real-time changes
🎯 Analyze Root Causes
- Identify recurring issues
- Implement preventive measures
📈 Monitor Trends
- Track monthly performance
- Identify patterns early
Who Can Benefit from This Dashboard?
Click to Buy Incident Response and Downtime Analysis Dashboard in Google Sheets
This dashboard is ideal for:
- IT Teams
- Cybersecurity Teams
- Operations Managers
- Data Analysts
- Business Owners
How Does It Improve Business Performance?
This dashboard directly improves performance.
Because:
- You reduce downtime
- You improve response time
- You optimize costs
- You enhance system reliability
Conclusion
Click to Buy Incident Response and Downtime Analysis Dashboard in Google Sheets
The Incident Response and Downtime Analysis Dashboard in Google Sheets is a powerful solution for managing incidents and reducing downtime.
Moreover, it transforms complex data into clear insights. As a result, you can improve response time, reduce costs, and enhance operational efficiency.
Visit our YouTube channel to learn step-by-step video tutorials
Youtube.com/@NeotechNavigators
Click to Buy Incident Response and Downtime Analysis Dashboard in Google Sheets