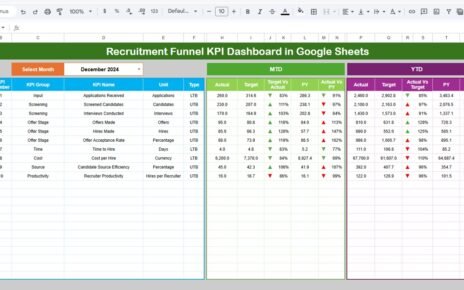
In today’s competitive printing and publishing industry, tracking performance is not optional—it is essential. Businesses must monitor production efficiency, costs, quality, and delivery timelines. However, when data stays scattered across multiple sheets, it becomes difficult to evaluate performance effectively.Printing & Publishing KPI Scorecard in Google Sheets
So, how can you track KPIs, monitor trends, and improve performance—all in one place?
Printing & Publishing KPI Scorecard in Google Sheets.
This ready-to-use and interactive scorecard helps you track key performance indicators (KPIs), analyze trends, and make data-driven decisions. Moreovr, it includes KPI definitions, formulas, and performance indicators like Lower the Better or Upper the Better, making it a complete solution.Printing & Publishing KPI Scorecard in Google Sheets
What is a Printing & Publishing KPI Scorecard?
A Printing & Publishing KPI Scorecard in Google Sheets is an interactive dashboard that helps businesses track and evaluate KPI performance for printing and publishing operations.
Instead of manual tracking, this scorecard allows you to:
- 📊 Monitor KPI performance monthly and yearly
- 🎯 Compare actual vs target values
- 📈 Track percentage changes
- 🚦 Use traffic light indicators (Red, Yellow, Green)
- 🔺 Visualize performance trends with arrows
Why Do You Need a KPI Scorecard?
Click to Buy Printing & Publishing KPI Scorecard in Google Sheets
Many printing and publishing businesses struggle to measure performance accurately.
However, with this KPI scorecard:
- You track performance in real time
- You identify weak areas quickly
- You improve operational efficiency
- You make data-driven decisions
Key Features of Printing & Publishing KPI Scorecard
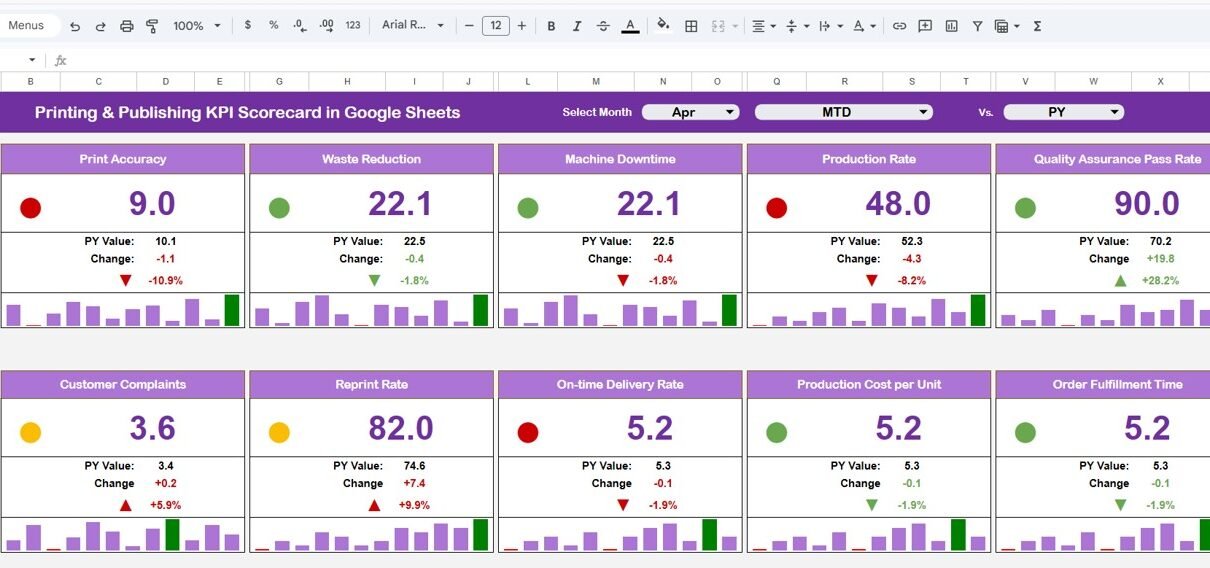
1. KPI Scorecard Dashboard – Central Performance View
This is the main dashboard sheet, where all KPIs are displayed.
Key Highlights:
- 📅 Month Selector (Dropdown at the top)
- 🔄 Dynamic updates based on selected month
- 📊 Displays 10 KPIs
- 🚦 Traffic light indicators (Green, Yellow, Red)
- 🔺 Up/Down arrows for percentage changes
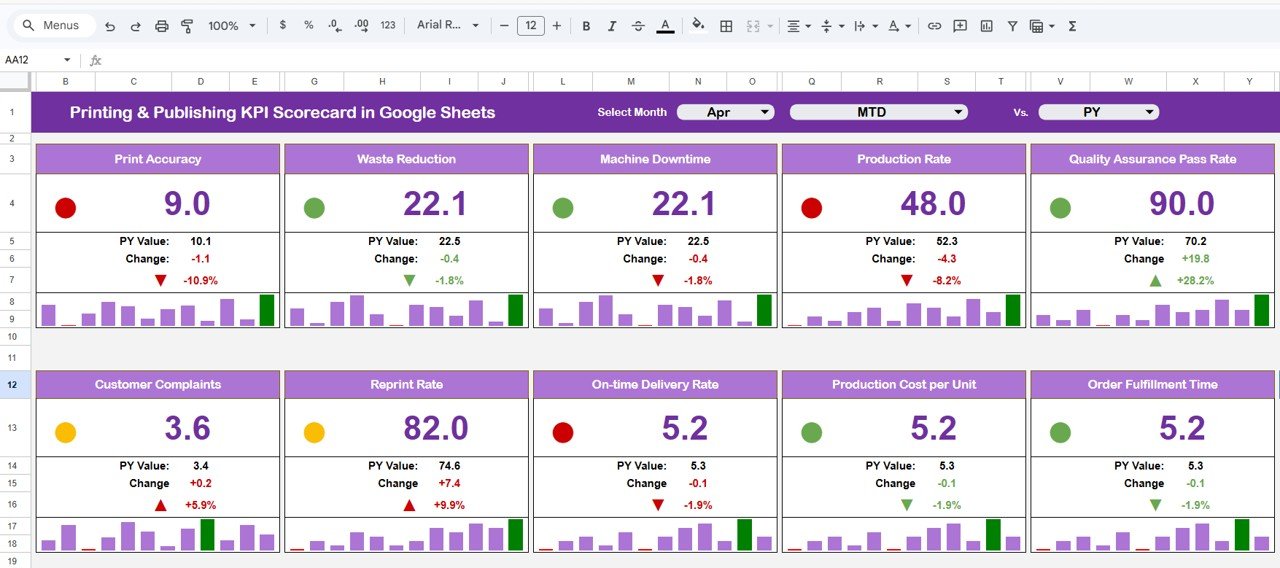
2. MTD & YTD Analysis – Monthly vs Yearly Insights
The dashboard allows you to switch between:
- 📅 MTD (Month-to-Date)
- 📈 YTD (Year-to-Date)
Click to Buy Printing & Publishing KPI Scorecard in Google Sheets
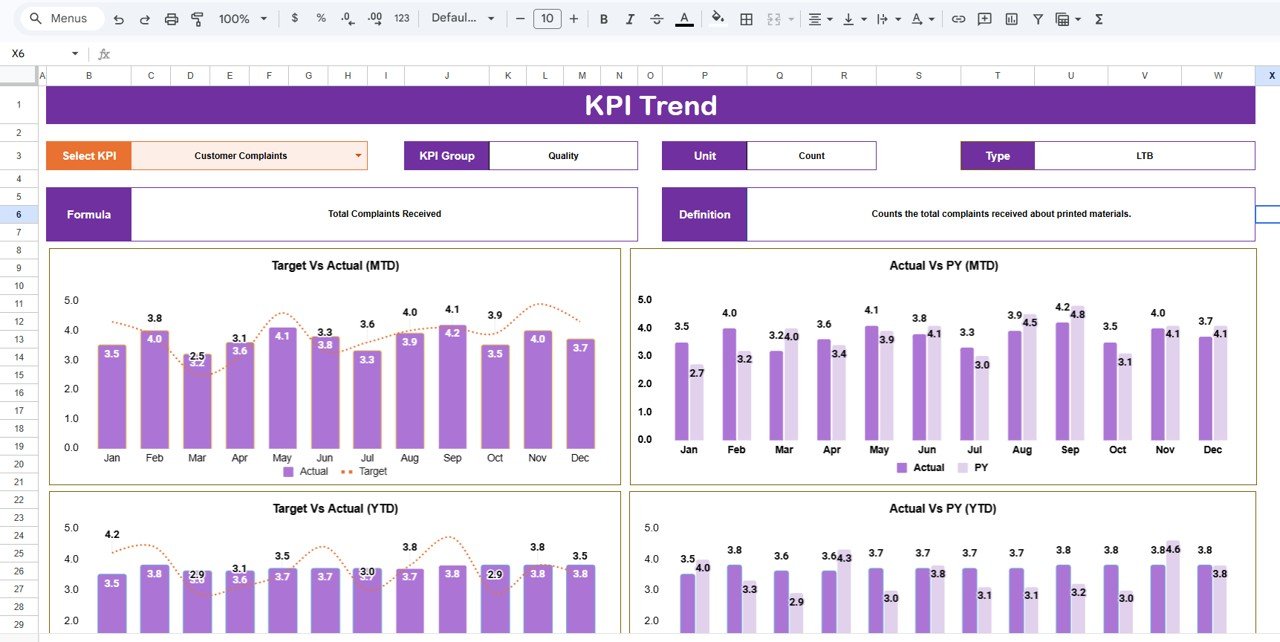
3. KPI Trend Sheet – Detailed KPI Analysis
This sheet provides in-depth insights for each KPI.
Features:
- Dropdown selection for KPI (Cell C3)
- Displays:
- KPI Group
- KPI Unit
- KPI Type (Lower/Upper the Better)
- KPI Formula
- KPI Definition
Click to Buy Printing & Publishing KPI Scorecard in Google Sheets
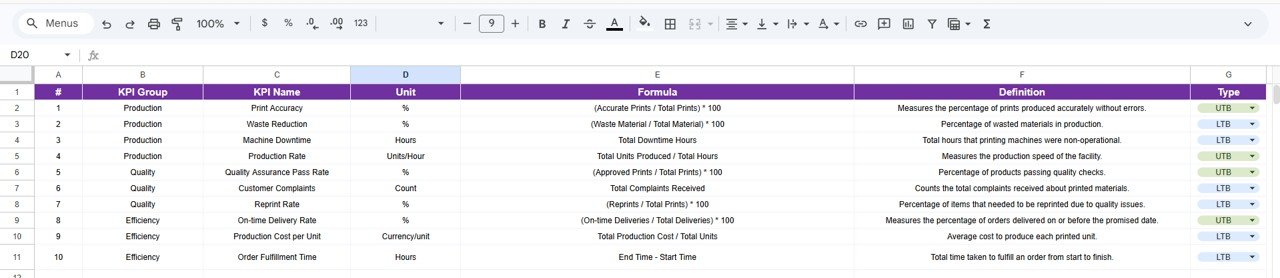
4. KPI Definition Sheet – Standardize KPIs
This sheet ensures consistency across your KPIs.
Includes:
- KPI Name
- KPI Group
- Unit of Measurement
- Formula
- KPI Definition
Click to Buy Printing & Publishing KPI Scorecard in Google Sheets
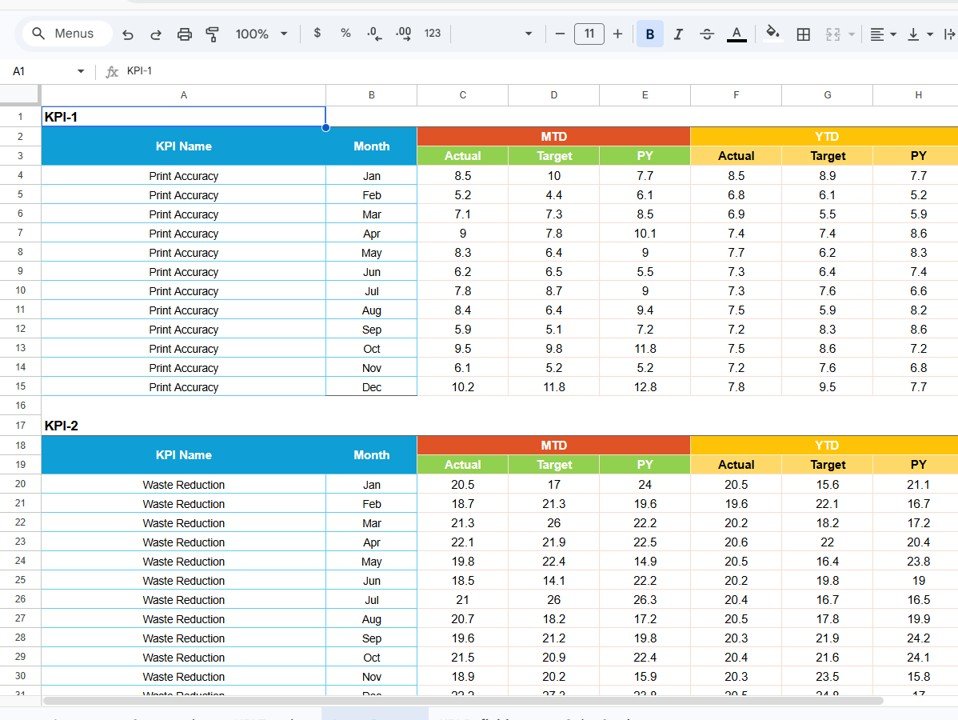
5. Data Input Sheet – Enter KPI Data
This sheet is used to input KPI values.
Key Points:
- Enter KPI data for each month
- Input both MTD and YTD values
- Data automatically reflects in the dashboard
Click to Buy Printing & Publishing KPI Scorecard in Google Sheets
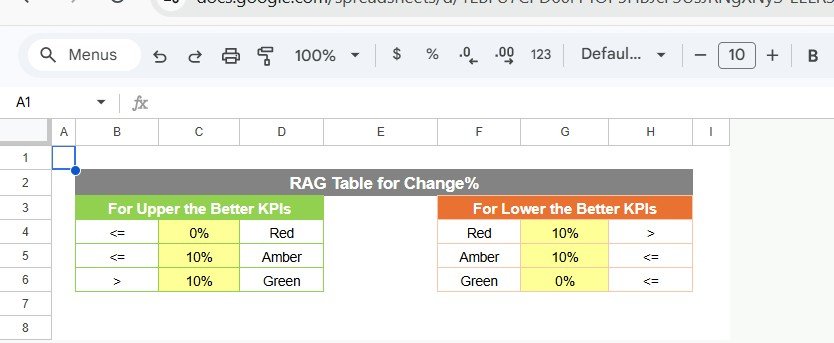
6. Color Settings – Visual Performance Indicators
This feature controls visual performance indicators.
Includes:
- Traffic light color logic
- KPI thresholds
- Conditional formatting rules
Click to Buy Printing & Publishing KPI Scorecard in Google Sheets
Advantages of Printing & Publishing KPI Scorecard
Using this scorecard offers several benefits:
🎯 Better Performance Tracking
- You monitor KPIs in one place
- You improve visibility
📊 Data-Driven Decisions
- You rely on accurate data
- You reduce guesswork
📈 Improved Efficiency
- You identify bottlenecks
- You optimize processes
🚦 Visual Insights
- Traffic lights simplify analysis
- You quickly spot issues
💼 Increased Productivity
- You save time
- You reduce manual work
Best Practices for the Printing & Publishing KPI Scorecard
Click to Buy Printing & Publishing KPI Scorecard in Google Sheets
To maximize results, follow these best practices:
📌 Maintain Data Accuracy
- Enter correct data
- Avoid missing values
📊 Focus on Key KPIs
- Track relevant KPIs only
- Avoid unnecessary metrics
🔄 Update Data Regularly
- Update monthly
- Monitor continuously
🎯 Use KPI Types Properly
- Understand Lower vs Upper the Better
- Evaluate performance correctly
📈 Analyze Trends
- Track monthly and yearly trends
- Identify patterns early
Who Can Benefit from This Scorecard?
This scorecard is ideal for:
- 🖨️ Printing Companies
- 📚 Publishing Houses
- 📊 Operations Managers
- 💼 Business Owners
- Analysts
Conclusion
Click to Buy Printing & Publishing KPI Scorecard in Google Sheets
The Printing & Publishing KPI Scorecard in Google Sheets is a powerful and easy-to-use tool for tracking business performance.
Moreover, it simplifies KPI monitoring into clear and actionable insights. As a result, you can improve efficiency, optimize operations, and make smarter decisions.
So, if you want to enhance your business performance, this KPI scorecard is a must-have solution.
Click to Buy Printing & Publishing KPI Scorecard in Google Sheets
Visit our YouTube channel to learn step-by-step video tutorials