Introduction
Creating an effective Upselling KPI Dashboard in Google Sheets is essential for tracking your upselling performance and optimizing sales strategies. This blog post walks you through a ready-to-use Google Sheets template designed specifically for monitoring vital upselling KPIs. Whether you’re a sales manager or a data analyst, this dashboard provides actionable insights to improve your upselling results effortlessly.
Key Features of Upselling KPI Dashboard in Google Sheets
- Six comprehensive worksheet tabs covering all aspects of upselling KPIs.
- Dynamic month selection for real-time data updates.
- Track Month-to-Date (MTD), Year-to-Date (YTD), and Previous Year KPIs side by side.
- Conditional formatting with up and down arrows to quickly visualize performance trends.
- Interactive trend charts for a clear view of KPI progress over time.
- Clear definitions and formulas for each KPI to ensure data clarity.
Dashboard Pages Explanation
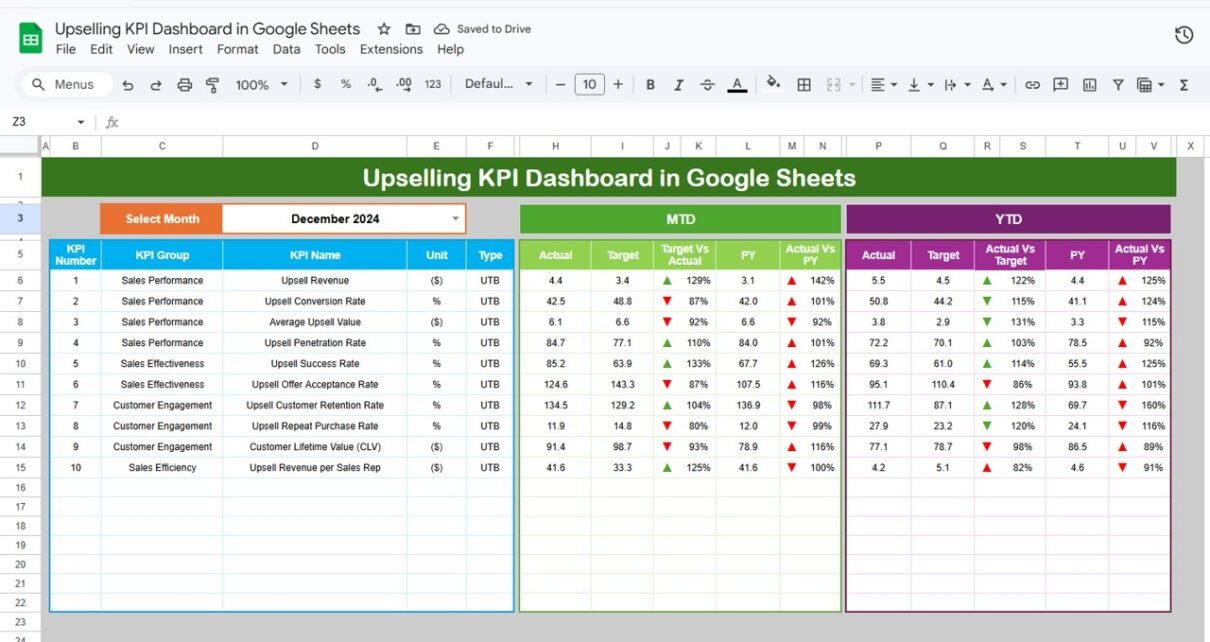
1. Dashboard Sheet Tab
This is the main control center where all KPIs come together for a holistic view.
- Selectable month using a drop-down at cell
D3updates the entire dashboard. - Displays MTD Actual, Target, Previous Year data with comparisons including Target vs Actual and PY vs Actual.
- YTD data is similarly presented for a cumulative yearly overview.
- Conditional formatting highlights performance using up/down arrows for easy visual interpretation.

Click to Buy Upselling KPI Dashboard in Google Sheets
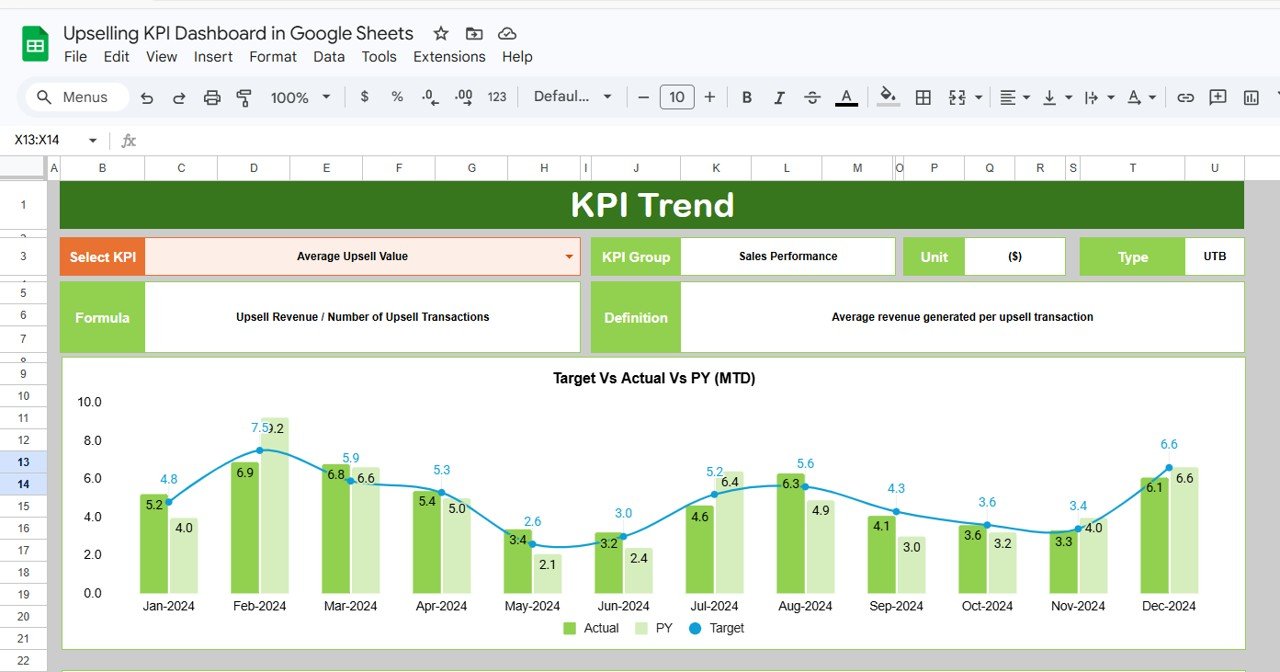
2. KPI Trend Sheet Tab
Designed for deep dives into specific KPIs.
- Select the KPI from a drop-down located at cell
C3. - View detailed KPI metadata including Group, Unit, Type (Lower the Better or Upper the Better), Formula, and Definition.
- Dynamic MTD and YTD trend charts visualize Actual, Target, and Previous Year results, aiding performance analysis.
Click to Buy Upselling KPI Dashboard in Google Sheets
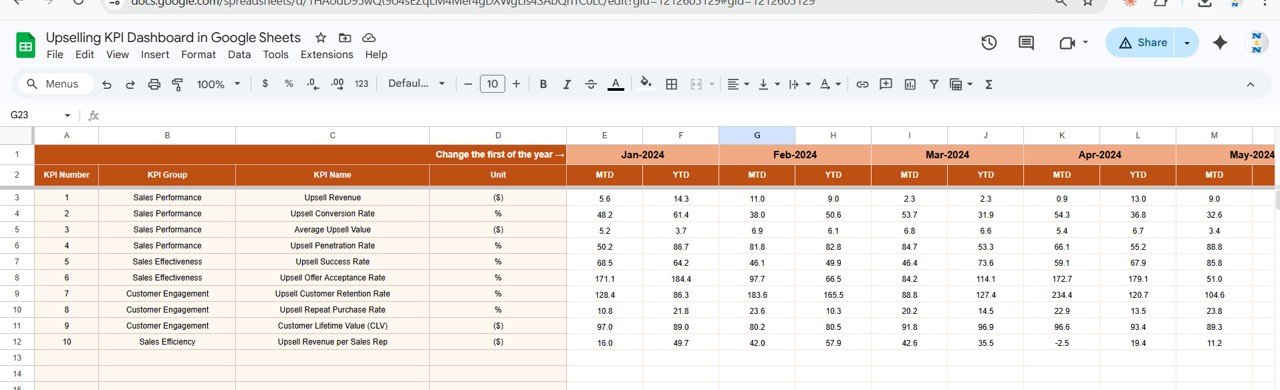
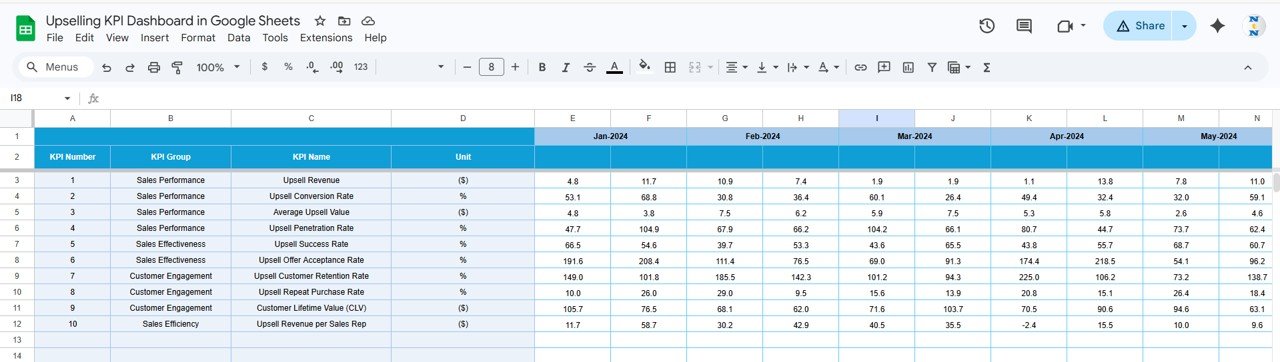
3. Actual Numbers Input Sheet
- Enter actual upselling numbers on a monthly basis.
- Change the analysis start month by updating the cell
E1.
4. Target Number Input Sheet
- Input target benchmarks for each KPI aligned by month.
- Includes fields for both MTD and YTD targets to match actual data input.
Click to Buy Upselling KPI Dashboard in Google Sheets
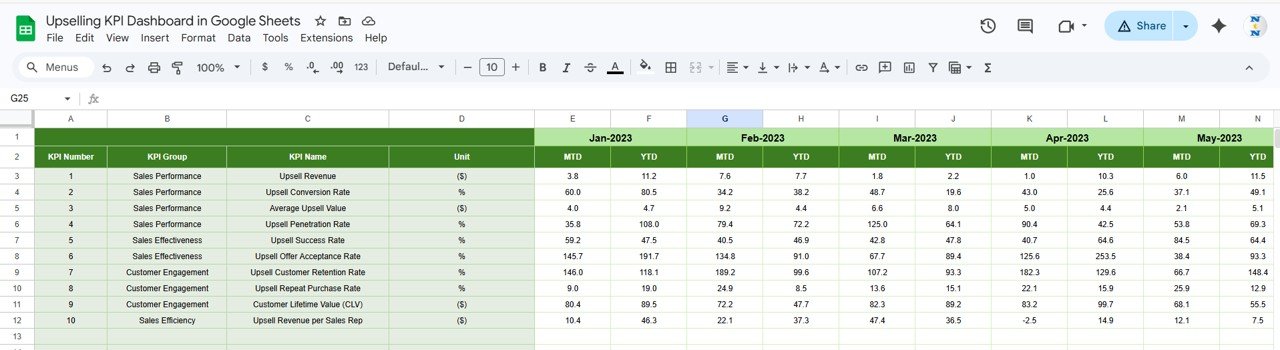
5. Previous Year Number Sheet Tab
- Enter last year’s upselling data structured similarly to the current year inputs.
- Facilitates performance comparison and trend spotting.
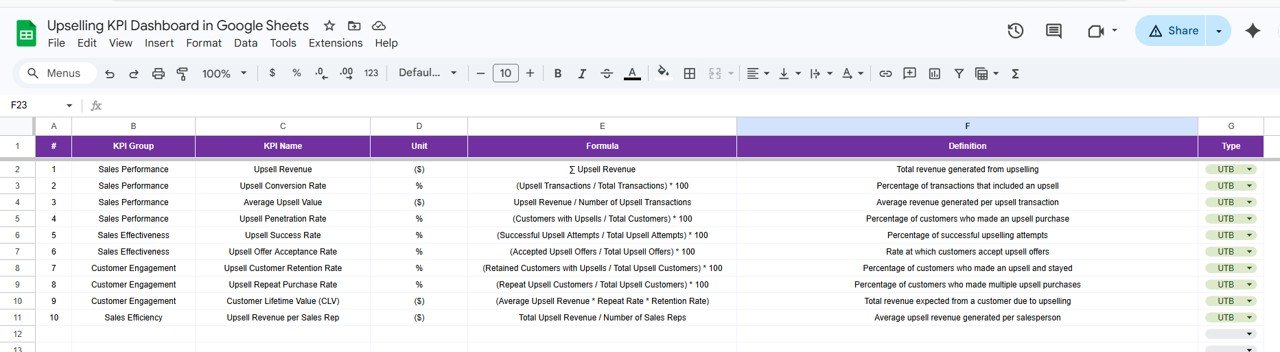
6. KPI Definition Sheet Tab
- Maintain clear records of each KPI’s Name, Group, Unit, Formula, and Definition.
- Specify KPI Type as either Lower The Better (LTB) or Upper The Better (UTB) to guide interpretation
Click to Buy Upselling KPI Dashboard in Google Sheets
Advantages of Upselling KPI Dashboard in Google Sheets
- User-Friendly Interface: Intuitive tabs and drop-downs simplify navigation and data entry.
- Customizable: Easily modify KPIs and timeframes without advanced technical knowledge.
- Real-Time Insights: Dynamic data refresh after selection helps in timely decision-making.
- Cost-Effective: Utilizes Google Sheets, a free cloud-based tool accessible anywhere.
- Collaborative: Share and collaborate with teams in real time, enhancing transparency.
Opportunities for Improvement
Click to Buy Upselling KPI Dashboard in Google Sheets
- Automated Data Integration: Linking with third-party CRM or sales tools to auto-update actuals could save manual entry time.
- Advanced Visualizations: Adding interactive dashboards with slicers or more chart options (e.g., heat maps) can improve data interpretation.
- Mobile Optimization: Enhancing mobile usability for managers on the go will increase accessibility.
- Alerts & Notifications: Trigger alerts when KPIs deviate significantly could improve responsiveness.
Best Practices
- Regularly update actual and target data to maintain accuracy.
- Train your team on interpreting KPI trends and conditional formatting cues.
- Review KPI definitions periodically to ensure alignment with business goals.
- Use the month selection feature consistently to conduct comparative monthly analysis.
- Backup your Google Sheets data to avoid accidental loss.
FAQs
Click to Buy Upselling KPI Dashboard in Google Sheets
Q1: Can I customize KPIs in this dashboard?
Yes, you can add or modify KPIs in the KPI Definition sheet to fit your business needs.
Q2: Is Google Sheets the best tool for upselling KPI tracking?
Google Sheets offers flexibility and accessibility for many businesses. However, for larger datasets, specialized BI tools might be more efficient.
Q3: How often should I update the actual numbers?
It’s best to update actual numbers monthly or as sales data becomes available to keep the dashboard relevant.
Q4: What does ‘Lower The Better’ and ‘Upper The Better’ mean in KPI types?
‘Lower The Better (LTB)’ indicates KPIs where a lower value signals better performance, e.g., churn rate. ‘Upper The Better (UTB)’ means higher values are preferable, like upselling revenue.
Conclusion
Click to Buy Upselling KPI Dashboard in Google Sheets
The Upselling KPI Dashboard in Google Sheets is a powerful and easy-to-use tool designed to provide clarity and actionable insights for sales teams. By leveraging this dashboard, businesses can effectively monitor performance, identify trends, and take strategic actions to boost upselling success. Start using this template today to transform your upselling data into meaningful business outcomes.
For additional resources and updates on similar templates, check out Google Docs Support and Microsoft Excel Official Site.
Click to Buy Upselling KPI Dashboard in Google Sheets
Visit our YouTube channel to watch the demo.