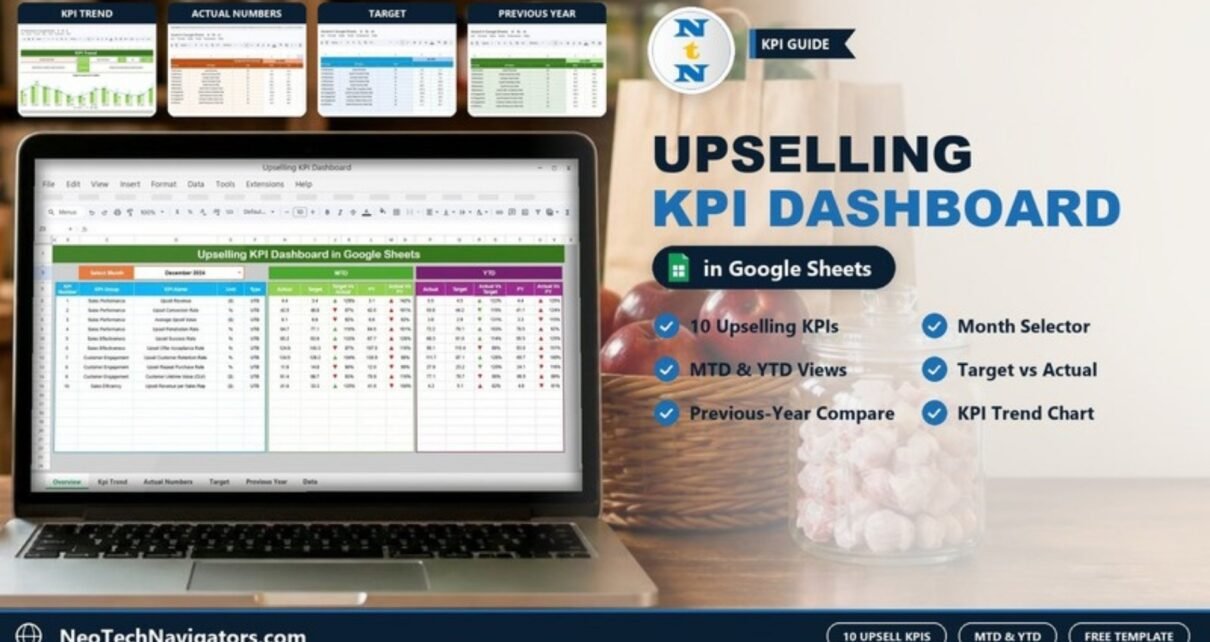
The Upselling KPI Dashboard in Google Sheets shows sales managers and revenue teams how well their upsell offers are working, month by month and year to date. It tracks ten upselling KPIs, from Upsell Revenue and Upsell Conversion Rate to Customer Lifetime Value (CLV) and Upsell Revenue per Sales Rep, and compares each one with its target and with the previous year.
The template has six tabs: Dashboard, KPI Trend, Actual Numbers, Target, Previous Year Numbers and KPI Definition. Pick a month in one drop-down, and the whole dashboard recalculates, with up/down arrows that show where performance moved.
This guide covers every sheet, lists all ten KPIs with the formulas defined in the template, works through a real row from the sample data and explains how to load your own sales figures.
Get the Upselling KPI Dashboard
Why Track Upselling KPIs?
Upselling, or moving an existing customer to a higher-value product, plan or add-on, is often the cheapest revenue a business can win. The customer already trusts you, so no acquisition cost is involved. But “we upsell a lot” is not a strategy. Teams need to know how often offers are made, how many are accepted, how much revenue they add and whether upsold customers stay.
This dashboard gives that view in a format any sales team can maintain. It suits:
- Sales managers and team leads who set monthly upsell targets
- SaaS and subscription businesses that grow revenue through plan upgrades
- E-commerce and retail teams that track add-on and premium-product sales
- Revenue operations analysts who prepare MTD and YTD sales reviews
The Ten Upselling KPIs in the Template
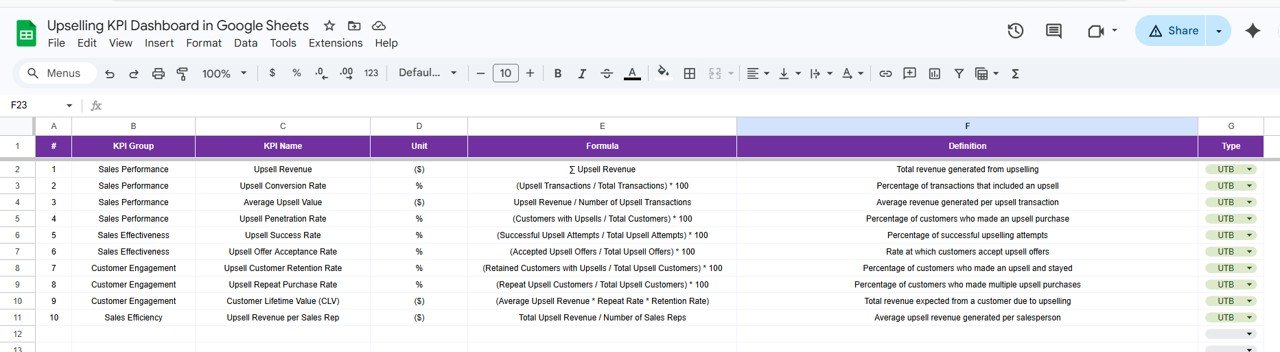
All ten KPIs, formulas and definitions below come from the template’s KPI Definition sheet. Every one is set as UTB (“Upper the Better”), so a higher value means better performance.
| KPI | Group | Unit | Formula | Better when |
|---|---|---|---|---|
| Upsell Revenue | Sales Performance | ($) | ∑ Upsell Revenue | Higher |
| Upsell Conversion Rate | Sales Performance | % | (Upsell Transactions / Total Transactions) * 100 | Higher |
| Average Upsell Value | Sales Performance | ($) | Upsell Revenue / Number of Upsell Transactions | Higher |
| Upsell Penetration Rate | Sales Performance | % | (Customers with Upsells / Total Customers) * 100 | Higher |
| Upsell Success Rate | Sales Effectiveness | % | (Successful Upsell Attempts / Total Upsell Attempts) * 100 | Higher |
| Upsell Offer Acceptance Rate | Sales Effectiveness | % | (Accepted Upsell Offers / Total Upsell Offers) * 100 | Higher |
| Upsell Customer Retention Rate | Customer Engagement | % | (Retained Customers with Upsells / Total Upsell Customers) * 100 | Higher |
| Upsell Repeat Purchase Rate | Customer Engagement | % | (Repeat Upsell Customers / Total Upsell Customers) * 100 | Higher |
| Customer Lifetime Value (CLV) | Customer Engagement | ($) | (Average Upsell Revenue * Repeat Rate * Retention Rate) | Higher |
| Upsell Revenue per Sales Rep | Sales Efficiency | ($) | Total Upsell Revenue / Number of Sales Reps | Higher |
Sheet-by-Sheet Walkthrough
1. Dashboard Sheet
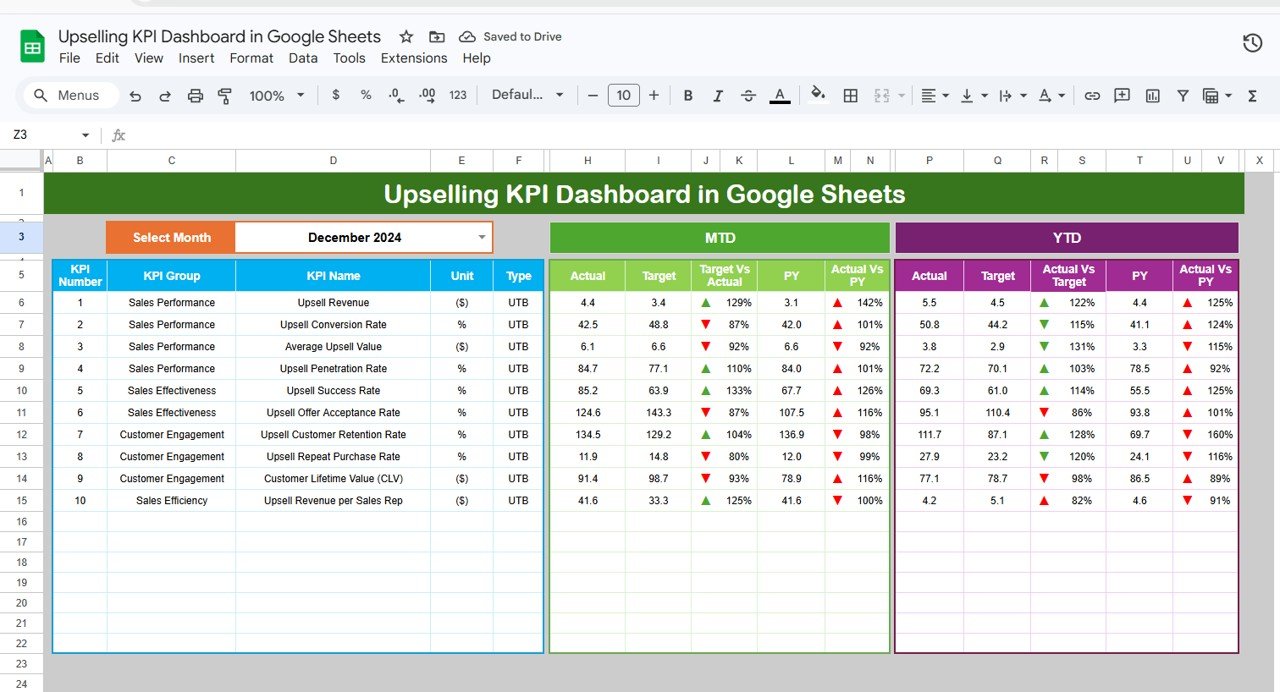
Choose a month in the Select Month drop-down in cell D3 (December 2024 in the screenshot). Each KPI row shows its number, group, name, unit and type, followed by two blocks:
- MTD: Actual, Target, Target Vs Actual, PY and Actual Vs PY
- YTD: Actual, Target, Actual Vs Target, PY and Actual Vs PY
Green and red arrows beside each percentage make it easy to scan for KPIs that are slipping.
2. KPI Trend Sheet
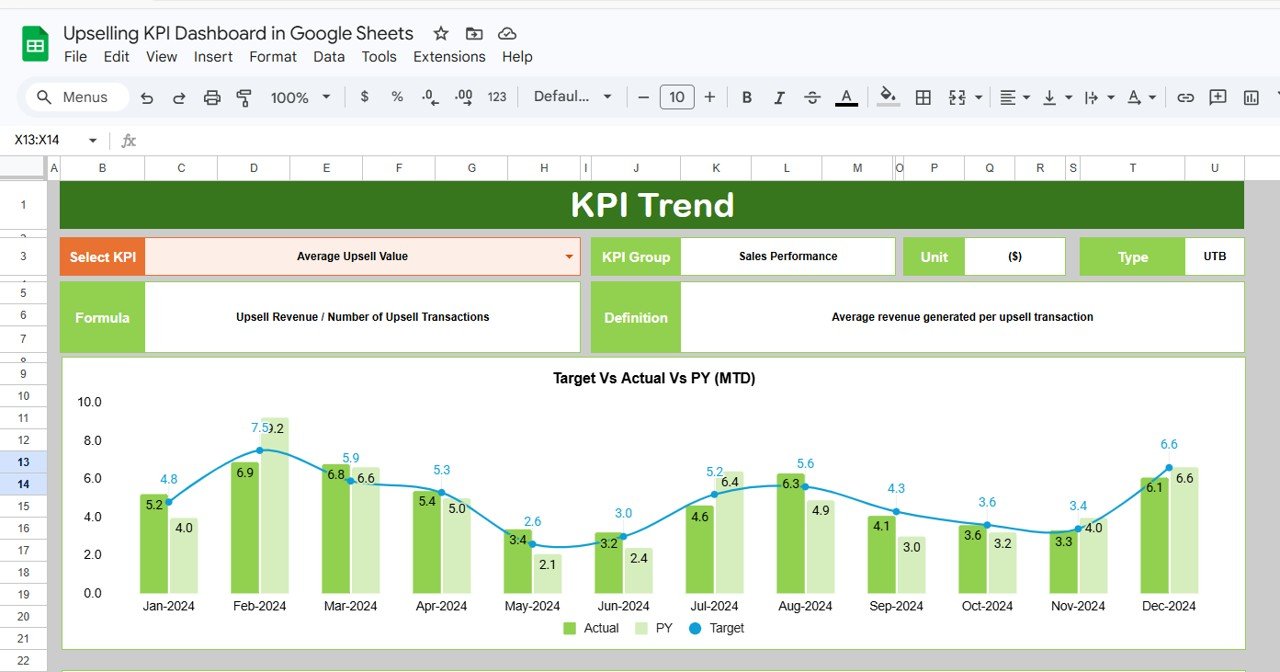
Select any KPI in cell C3. The sheet displays its KPI Group, Unit, Type, Formula and Definition, and plots a Target Vs Actual Vs PY (MTD) chart for each month of the year. The screenshot shows Average Upsell Value, defined as “average revenue generated per upsell transaction”.
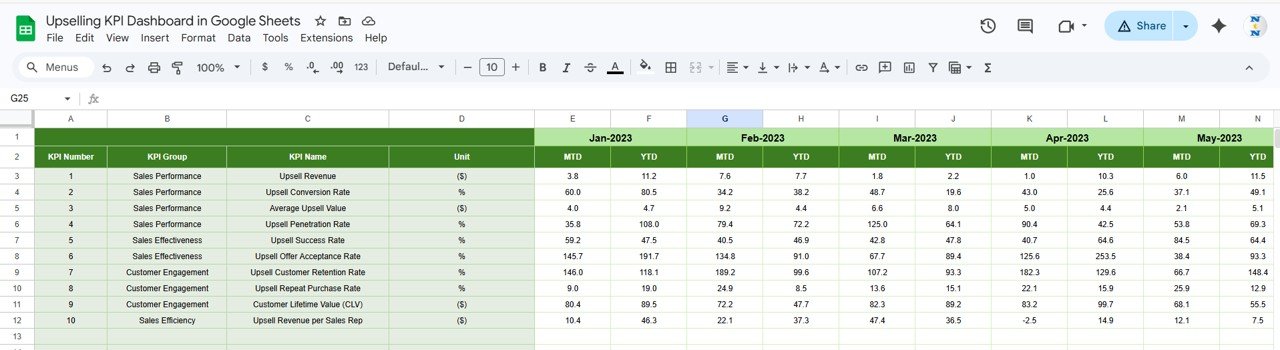
3. Actual Numbers Sheet
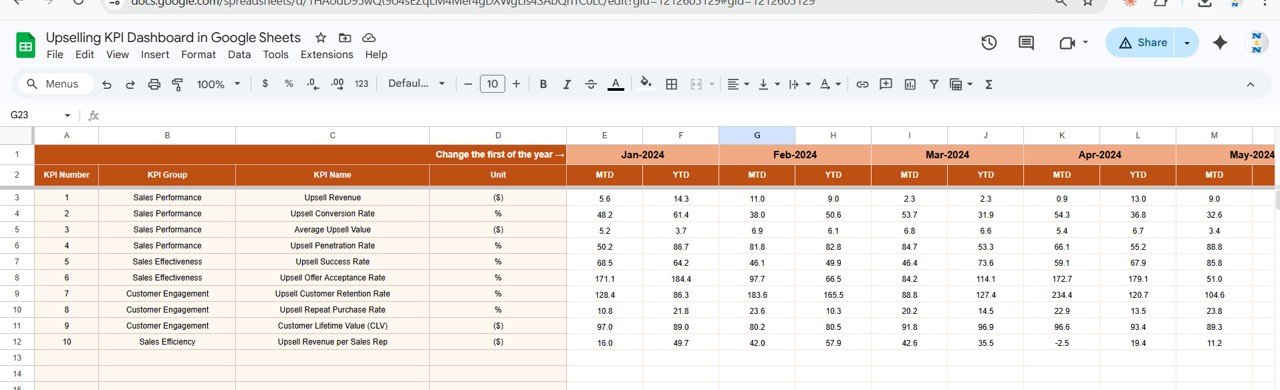
Enter your actual results for each KPI here, with MTD and YTD columns for every month. Cell E1 (“Change the first of the year”) sets the starting month, so financial years that begin mid-calendar are supported.
4. Target Sheet
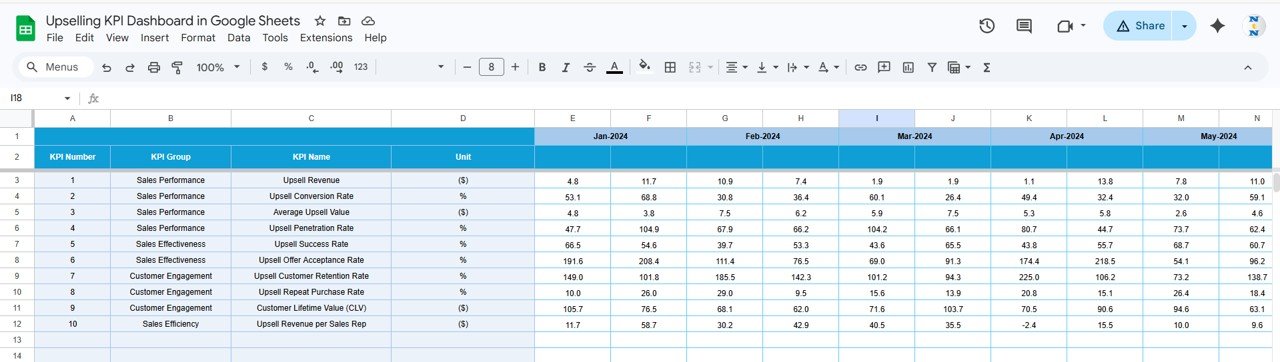
Type the MTD and YTD targets for each KPI and month in the same layout. The dashboard compares the actuals with these values.
5. Previous Year Numbers Sheet
Last year’s figures (Jan-2023 onwards in the sample) go here. They feed the PY and Actual Vs PY columns on the dashboard and the PY bars on the trend chart.
6. KPI Definition Sheet
The master list of KPIs: group, name, unit, formula, definition and type (UTB or LTB). Add, rename or remove KPIs here. If you add a “lower is better” metric, such as discount given per upsell, set its type to LTB.
Worked Example: Reading the December 2024 Row
With December 2024 selected, the sample data shows these MTD values:
- Upsell Revenue: Actual 4.4, Target 3.4, Target Vs Actual 129%, PY 3.1, Actual Vs PY 142%
- Upsell Conversion Rate: Actual 42.5%, Target 48.8%, Target Vs Actual 87%
- Average Upsell Value: Actual 6.1, Target 6.6, Target Vs Actual 92%
Each percentage is the actual divided by the comparison value:
Upsell Revenue vs target:   4.4 / 3.4   ≈ 129%
Upsell Revenue vs PY:       4.4 / 3.1   ≈ 142%
Conversion Rate vs target:  42.5 / 48.8 ≈ 87%
Read together, the rows tell a story. Revenue beat its target even though conversion rate and average upsell value both fell short. With real data, that pattern would suggest the extra revenue came from a higher volume of upsells rather than larger or better-converting ones, which is worth discussing with the team.
The numbers in the template are sample values. Replace them with your own data.
How to Use It With Your Own Data
- Review the ten KPIs on the KPI Definition sheet and keep the ones your team can actually measure.
- Confirm the data source for each one, such as your CRM, billing system or e-commerce platform.
- Set the first month of your year in cell E1 on the Actual Numbers sheet.
- Enter MTD and YTD actuals for each month.
- Add targets to the Target sheet and last year’s figures to the Previous Year Numbers sheet.
- Select the month in D3 on the Dashboard and review the arrows.
- Investigate any weak KPI on the KPI Trend sheet to see whether it is a one-month dip or a trend.
Three Real-World Use Cases
SaaS plan upgrades
A subscription software company tracks Upsell Penetration Rate and Upsell Customer Retention Rate to check that customers who upgrade also stay, not just that upgrades happen.
Retail add-on sales
A retailer monitors Average Upsell Value and Upsell Offer Acceptance Rate after training store staff to recommend warranties and accessories at checkout.
Sales team coaching
A sales manager uses Upsell Revenue per Sales Rep and Upsell Success Rate in monthly one-to-ones to set personal targets and share what works.
Best Practices
- Define “upsell” once. Agree whether a plan upgrade, an add-on and a cross-category purchase all count, and record the rule in the definition.
- Pair volume and quality KPIs. Look at Upsell Revenue alongside Average Upsell Value and Retention Rate.
- Use the same cut-off date each month so MTD figures are comparable.
- Revisit targets quarterly if your product mix or pricing changes.
- Lock the calculation sheets with Data > Protect sheets and ranges and give the team edit access to the input sheets only.
Limitations
- The figures are entered or pasted monthly. The dashboard does not connect to a CRM on its own.
- It reports team-level KPIs. Rep-by-rep or product-by-product breakdowns need extra sheets.
- Businesses with very high transaction volumes may prefer a BI tool for automated refreshes.
Related Templates and Further Reading
The same dashboard is available as an Upselling KPI Dashboard in Excel and in Power BI. For connected sales metrics, see the Cross-Selling KPI Dashboard, the Customer Lifetime Value KPI Dashboard, the Customer Churn KPI Dashboard and the Sales KPI Dashboard in Google Sheets.
To learn how to build comparison dashboards like this, the Pivot Tables & Dashboards course on NextGenTemplates Academy walks through it with structured lessons.
Frequently Asked Questions
Which KPIs does the Upselling KPI Dashboard track?
Ten: Upsell Revenue, Upsell Conversion Rate, Average Upsell Value, Upsell Penetration Rate, Upsell Success Rate, Upsell Offer Acceptance Rate, Upsell Customer Retention Rate, Upsell Repeat Purchase Rate, Customer Lifetime Value (CLV) and Upsell Revenue per Sales Rep.
What is the difference between upsell conversion rate and offer acceptance rate?
In this template, conversion rate is upsell transactions divided by all transactions. Offer acceptance rate is accepted upsell offers divided by total upsell offers made.
Can I add my own KPIs?
Yes. Add a row on the KPI Definition sheet, set its unit, formula, definition and type, then enter its values on the input sheets.
What do UTB and LTB mean?
UTB (Upper the Better) means higher values are good. LTB (Lower the Better) means lower values are good. All ten built-in upselling KPIs are UTB.
How often should I update the numbers?
Monthly, once the month’s sales are final. Some teams also enter a mid-month estimate and overwrite it at month end.
Does it work for a financial year that starts in April?
Yes. Set the first month in cell E1 of the Actual Numbers sheet.
Wrapping Up
The Upselling KPI Dashboard in Google Sheets gives sales teams a monthly scorecard for revenue, conversion, deal value and retention from upsells, all against target and last year. Trim the KPI list to what you can measure, load your targets and review the dashboard at the start of every month.
Get the Upselling KPI Dashboard
📅 Last updated: October 2026