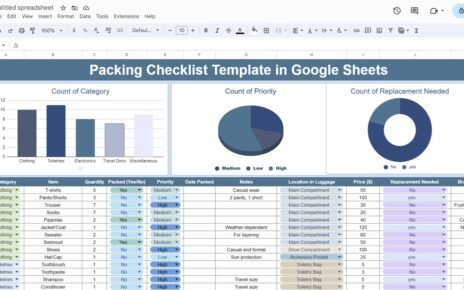
Policy Performance and Risk Analysis Dashboard in Google Sheets is a comprehensive, ready-to-use analytics template designed for insurance professionals, risk managers, and operations leaders who need complete visibility into how their policy portfolios are performing. In today’s competitive insurance landscape, organizations must continuously monitor policy metrics, assess risk exposure, evaluate claims patterns, and track premium revenue to remain profitable and compliant.Policy Performance and Risk Analysis Dashboard in Google Sheets
However, when insurance data is scattered across multiple spreadsheets, disconnected systems, or manual reports, leadership teams lose visibility and decision-making becomes reactive. That is exactly why this Policy Performance and Risk Analysis Dashboard in Google Sheets becomes an essential analytics solution for modern insurance businesses.Policy Performance and Risk Analysis Dashboard in Google Sheets
This professionally designed dashboard transforms raw insurance data into structured, visual, and actionable insights. With interactive charts, dynamic slicers, KPI cards, and a smart search feature, insurance teams can instantly understand policy performance, risk distribution, premium collection efficiency, and claims behavior across every dimension. Because it is built entirely in Google Sheets, the dashboard supports real-time collaboration, easy updates, and cloud-based access without requiring expensive BI software.Policy Performance and Risk Analysis Dashboard in Google Sheets
Key Features of Policy Performance and Risk Analysis Dashboard in Google Sheets
Click to Buy Policy Performance and Risk Analysis Dashboard in Google Sheets
The Policy Performance and Risk Analysis Dashboard in Google Sheets is packed with features that make insurance analytics simple, visual, and collaborative. Here are the key capabilities:
- Centralized Policy Monitoring – Track total policies, active policies, expired policies, premium collected, claims amount, risk scores, and loss ratios from a single overview page with dynamic KPI cards.
- Five-Page Analytical Structure – The dashboard includes an Overview page, Policy Type Analysis, Risk and Claims Analysis, Premium and Revenue Analysis, and Monthly Trends page for comprehensive coverage.
- Interactive Slicers – Filter the entire dashboard instantly by insurance type, policy status, risk category, region, or agent to drill down into specific segments.
- Risk Exposure Visualization – Visualize risk distribution across policy types, regions, and customer segments to identify high-risk areas requiring immediate attention.
- Premium vs Claims Comparison – Evaluate profitability by comparing premium collected against claims paid across insurance types, agents, and regions.
- Smart Search Feature – Use keyword-based search with field selection to find any policy record instantly, making audits and customer queries effortless.
- Auto-Updating Charts – All visuals refresh automatically when data changes, ensuring reports are always current.
- Cloud-Based Collaboration – Built in Google Sheets for real-time access and team collaboration without any software installation.Policy Performance and Risk Analysis Dashboard in Google Sheets
Dashboard Pages Explained
1. Overview Page – Policy Performance Snapshot
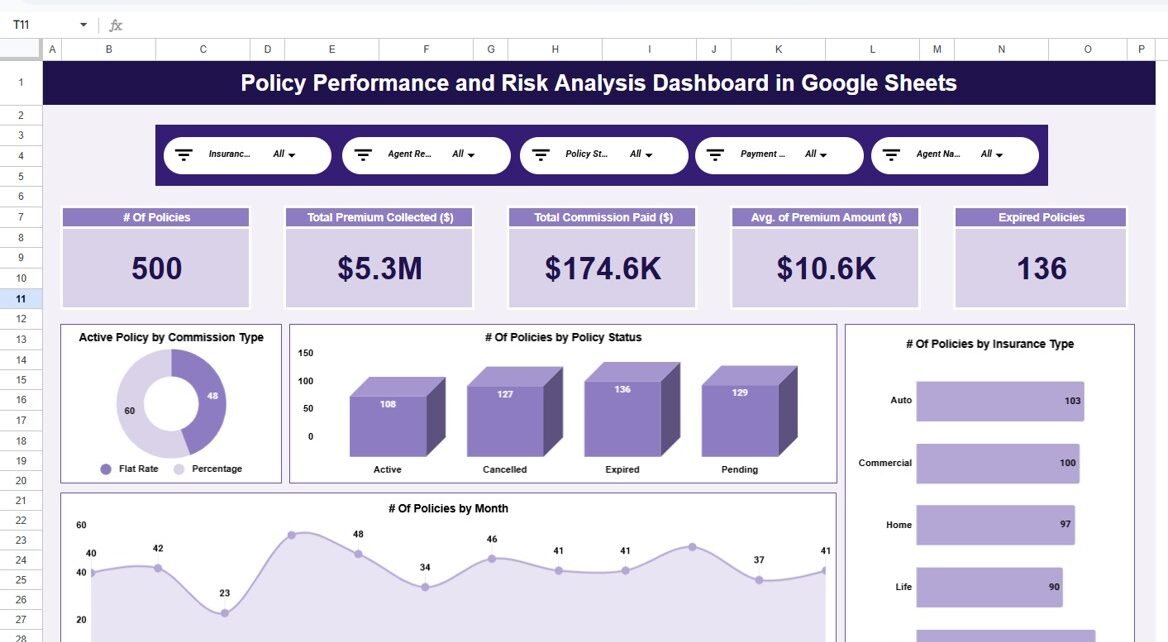
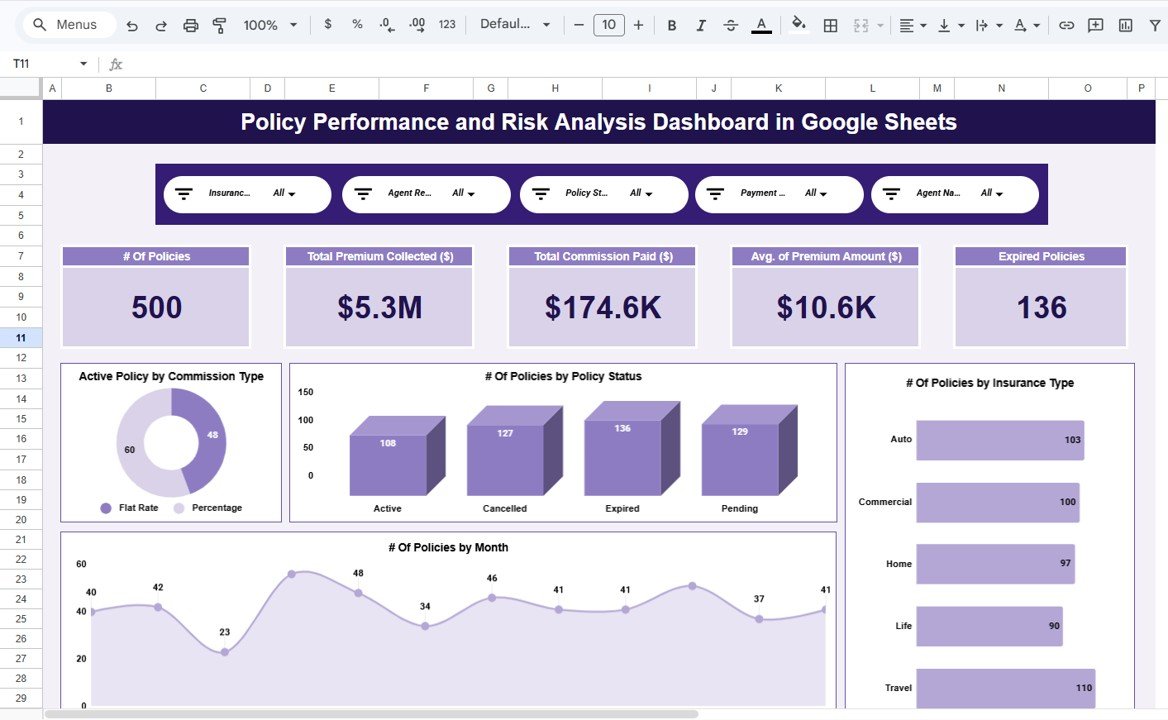
The Overview page is the central command center of the dashboard. At the top, you will find high-level KPI cards displaying Total Policies, Active Policies, Expired Policies, Total Premium Collected, Total Claims Amount, Average Risk Score, and Loss Ratio. These cards give leadership an instant understanding of portfolio health.
Below the cards, interactive charts provide visual insights into key dimensions. The charts on this page include Premium Collected by Insurance Type, Claims Amount by Region, Active Policies by Policy Status, and Risk Score by Insurance Type. Multiple slicers allow filtering by Insurance Type, Policy Status, Risk Category, Region, and Agent, making it easy to isolate specific segments for deeper analysis.
Overview Page2. Policy Type Analysis Page
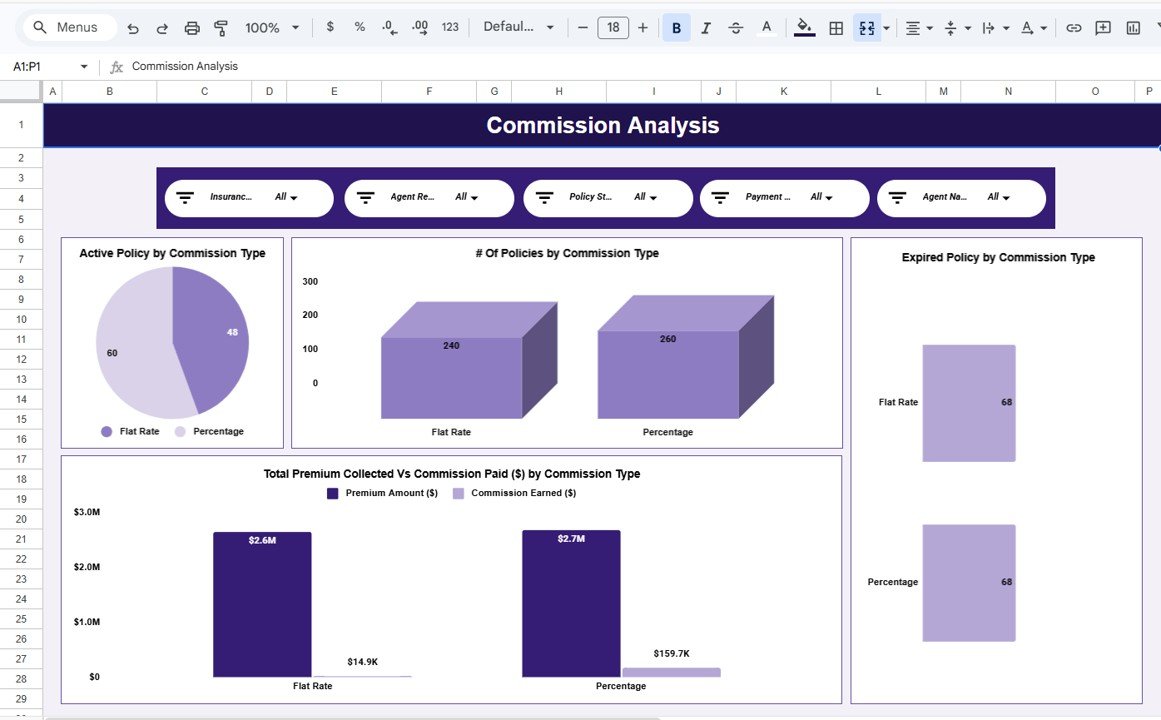
This page provides a detailed breakdown of policy performance by insurance type. Insurance organizations typically manage multiple product lines such as life insurance, health insurance, motor insurance, property insurance, and travel insurance. Understanding how each product line performs is essential for strategic decision-making.Policy Performance and Risk Analysis Dashboard in Google Sheets
The charts on this page display Total Policies by Insurance Type, Premium Collected by Insurance Type, Claims Amount by Insurance Type, and Average Risk Score by Insurance Type. This helps management identify which policy types are driving growth, which are generating losses, and where risk concentration is highest.Policy Performance and Risk Analysis Dashboard in Google Sheets
 Policy Type Analysis Page
3. Risk and Claims Analysis Page
Risk assessment and claims management are the backbone of insurance operations. This page provides deep analytical insights into how risk is distributed and how claims are impacting the portfolio.
The analysis covers Claims Amount by Risk Category, Risk Score by Region, Loss Ratio by Insurance Type, and Claims Frequency by Agent. By understanding which risk categories, regions, or agents are generating higher claims, organizations can take proactive measures such as adjusting premiums, tightening underwriting criteria, or implementing risk mitigation strategies.
 Risk and Claims Analysis Page
4. Premium and Revenue Analysis Page
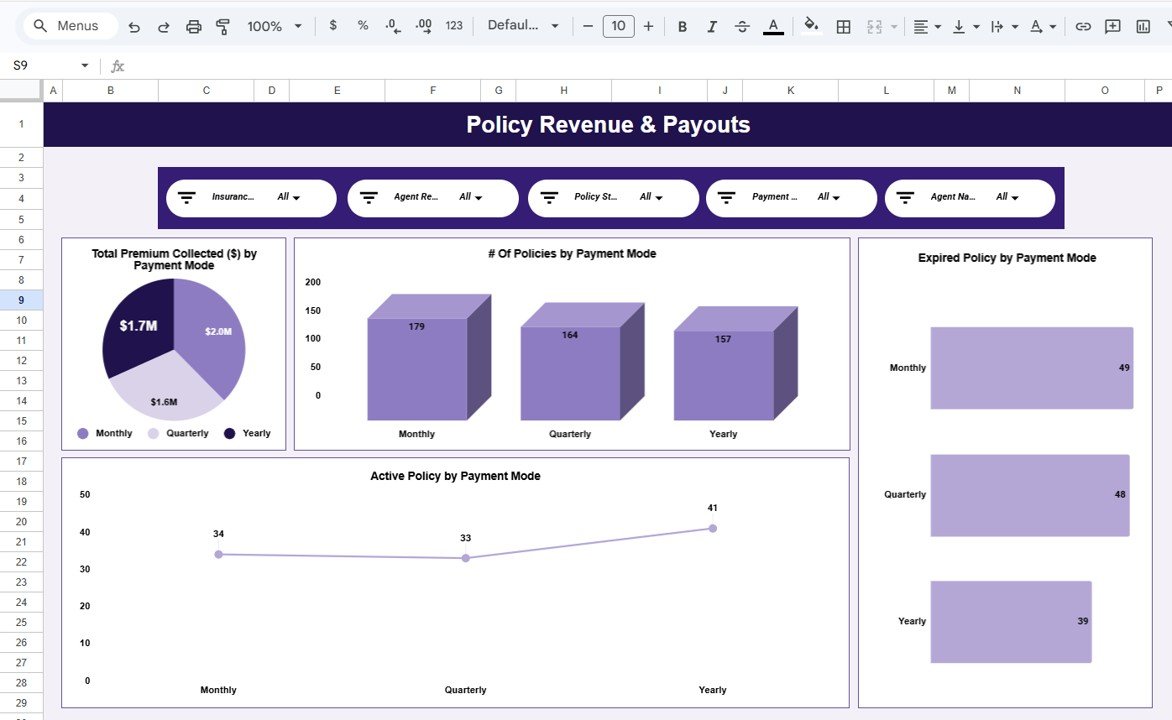
Financial performance tracking is critical for insurance profitability. This page focuses on premium collection efficiency and revenue insights across multiple dimensions.
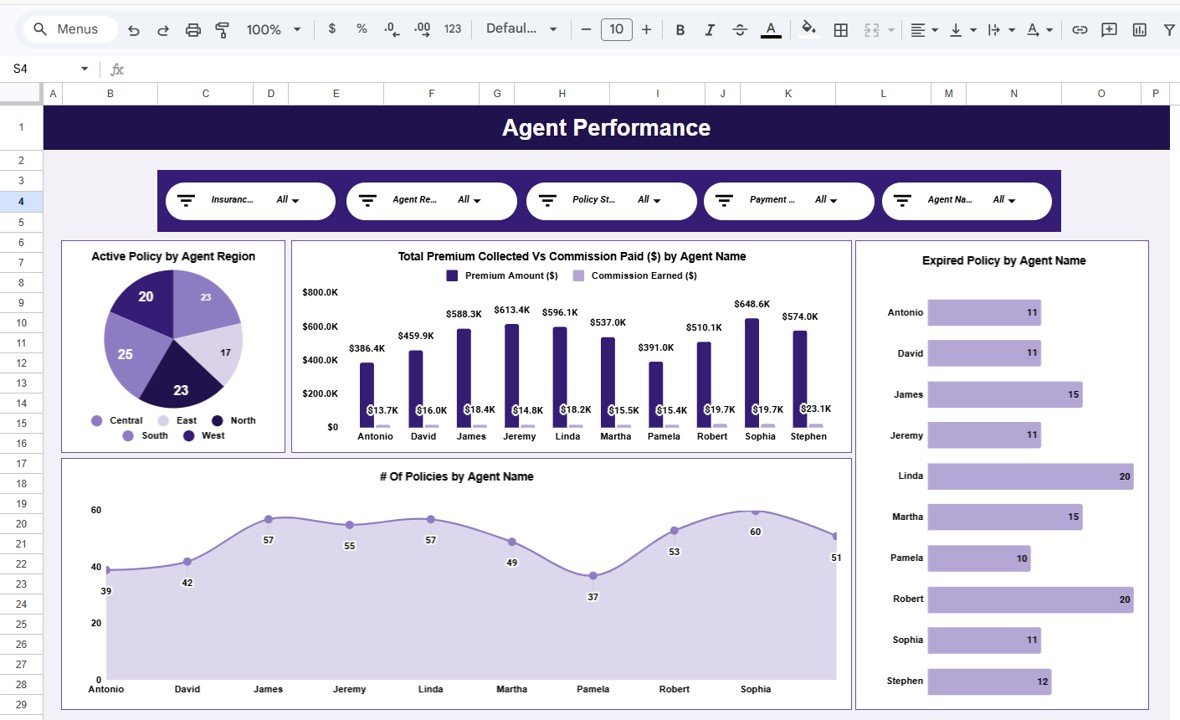
The charts include Premium Collected by Region, Premium Collected by Agent, Revenue vs Claims Comparison by Insurance Type, and Monthly Premium Collection Trends. This analysis helps finance teams understand collection patterns, evaluate agent productivity, and forecast future revenue streams based on historical trends.
 Premium and Revenue Analysis Page
5. Monthly Trends Page
Time-based analysis helps organizations spot seasonal patterns, growth trajectories, and anomalies in their insurance data. This page tracks key metrics across months to reveal trends that are invisible in static reports.
The charts display Total Policies by Month, Premium Collected by Month, Claims Amount by Month, and Average Risk Score by Month. By reviewing these trends regularly, management can anticipate peak periods, plan resources effectively, and take corrective action before issues escalate.
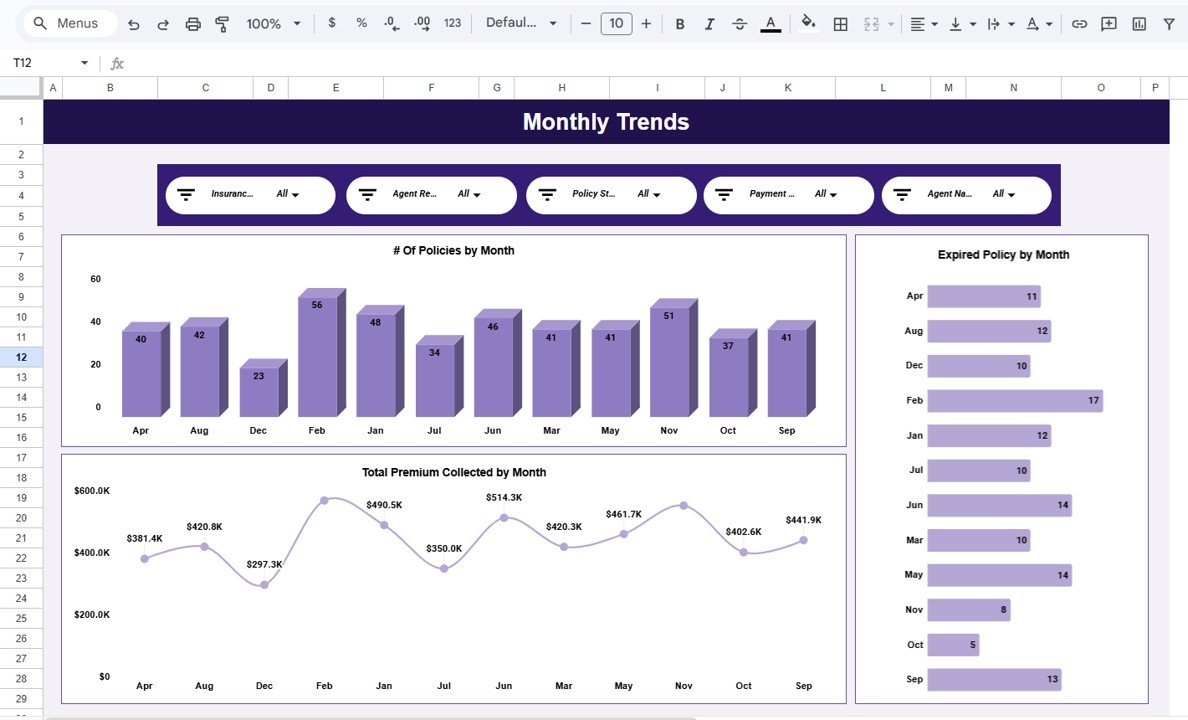 Monthly Trends Page
6. Data Sheet
The Data Sheet is the foundation of the entire dashboard. All policy records are entered here in a structured, tabular format. The dashboard reads data from this sheet and automatically populates all KPI cards, charts, and analysis pages. Users simply need to add new policy records or update existing ones, and the entire dashboard refreshes instantly.
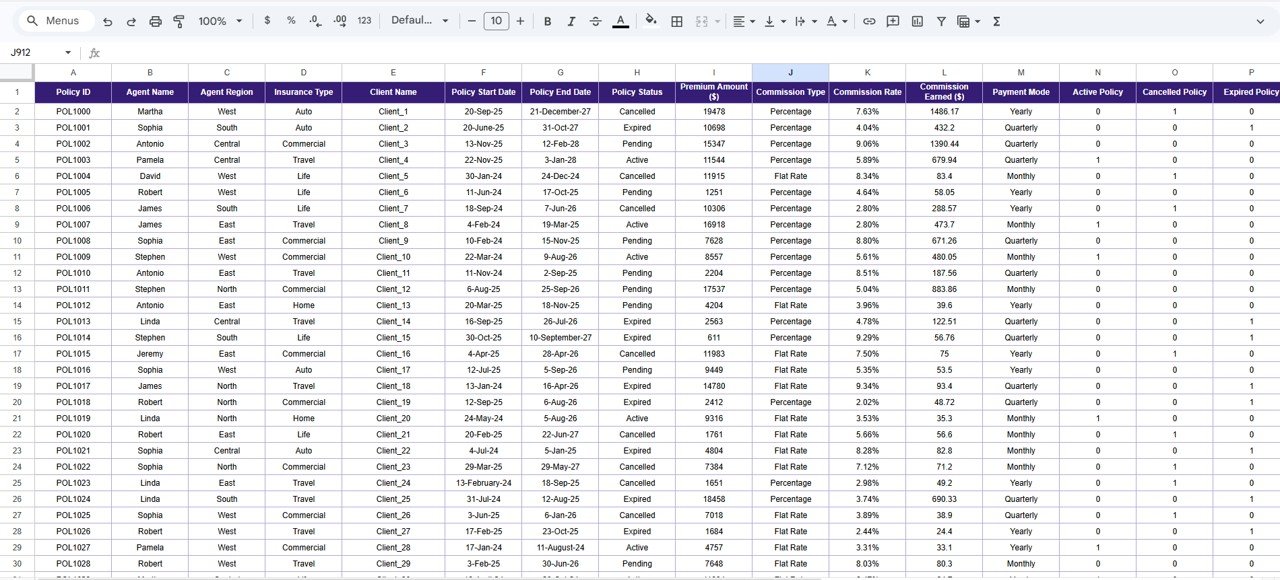 Data Sheet
7. Search Sheet
The Search Sheet provides a powerful search functionality that allows users to find specific policy records by entering a keyword and selecting a field name. Matching records appear instantly, along with the total count of matching results. This feature is extremely useful during audits, compliance reviews, customer queries, and management reporting.
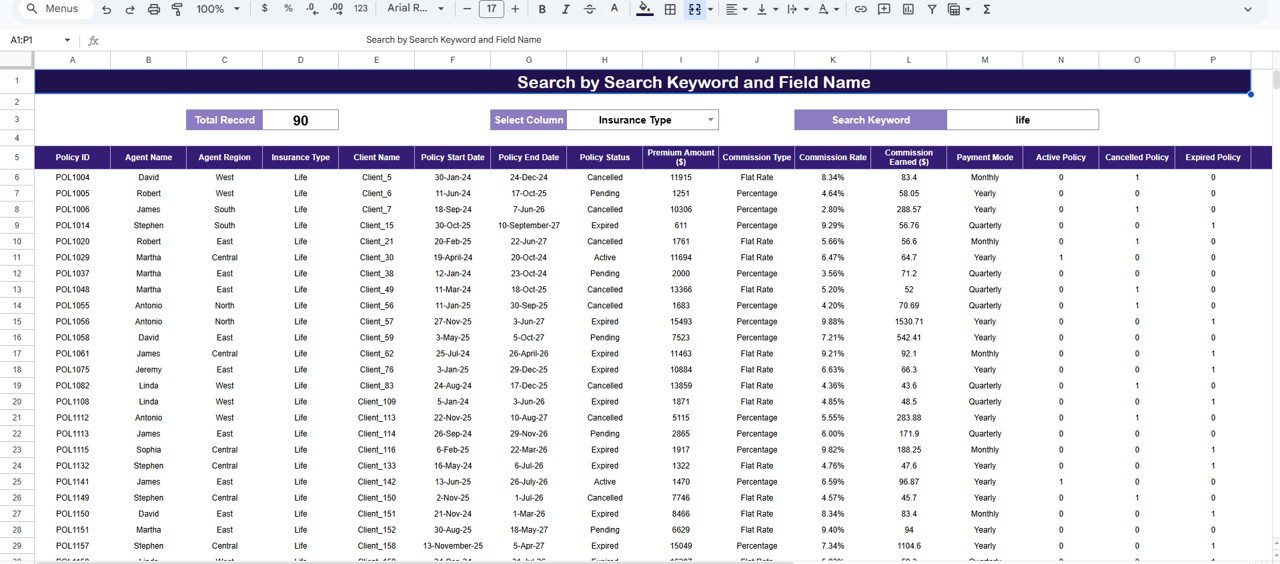 Search Sheet
Advantages of Policy Performance and Risk Analysis Dashboard in Google Sheets
- Centralizes all insurance policy data and analytics in one location
- Eliminates manual reporting and scattered spreadsheets
- Provides instant visibility into policy performance, risk, and profitability
- Supports data-driven underwriting and claims management decisions
- Reduces response time for audits, compliance checks, and customer queries
- Enables real-time collaboration across departments using Google Sheets
- Requires no expensive BI tools or complex technical setup
- Fully customizable to match your organization’s specific insurance products and structuresPolicy Performance and Risk Analysis Dashboard in Google Sheets
Opportunities for Improvement
- Integration with automated data feeds from insurance management systems
- Addition of predictive analytics for claims forecasting and risk scoring
- Inclusion of customer segmentation analysis for targeted marketing
- Email-based automated reporting using Google Apps Script
- Multi-currency support for international insurance operationsPolicy Performance and Risk Analysis Dashboard in Google Sheets
Best Practices for Using the Dashboard
Click to Buy Policy Performance and Risk Analysis Dashboard in Google Sheets
- Update policy data consistently to ensure accurate dashboard reporting
- Review the Overview page daily for quick portfolio health checks
- Analyze risk and claims trends weekly to identify emerging issues early
- Use slicers to isolate specific insurance types, regions, or agents for focused reviews
- Share the dashboard with underwriting, claims, finance, and management teams for collaborative decision-making
- Maintain standardized data entry formats to avoid calculation errors
- Back up the Google Sheets file regularly to prevent data loss
Explore Relevant Templates
- Insurance Brokers Dashboard in Google Sheets
- Insurance KPI Scorecard in Google Sheets
- HR Compliance KPI Dashboard in Google Sheets
- Public Sector KPI Scorecard in Google Sheets
Frequently Asked Questions (FAQs)
What is the Policy Performance and Risk Analysis Dashboard in Google Sheets?
It is a ready-to-use Google Sheets template that helps insurance professionals monitor policy performance, analyze risk exposure, track premium collection, and evaluate claims behavior through interactive charts, KPI cards, and a smart search feature.Policy Performance and Risk Analysis Dashboard in Google Sheets
Who can use this insurance dashboard template?
Insurance companies, brokers, underwriting teams, risk analysts, finance teams, compliance managers, operations leaders, consultants, and students can all benefit from this dashboard.Policy Performance and Risk Analysis Dashboard in Google Sheets
Do I need any special software to use this dashboard?
No. This dashboard runs entirely in Google Sheets. You only need a Google account to open, use, and share the template. No additional software installation or BI tools are required.Policy Performance and Risk Analysis Dashboard in Google Sheets
Can I customize the dashboard for my specific insurance products?
Yes. The dashboard is fully customizable. You can modify charts, add new KPIs, change insurance categories, and adapt the data structure to match your organization’s specific requirements.
How does the search feature work?
The Search Sheet allows you to enter a keyword and select a field name such as Policy Number, Insurance Type, Region, or Agent. The dashboard instantly filters and displays all matching records along with the total count.
Is the data updated automatically?
Yes. All charts, KPI cards, and analysis pages update automatically whenever you add or modify data in the Data Sheet. There is no need for manual refresh or recalculation.
Conclusion
Click to Buy Policy Performance and Risk Analysis Dashboard in Google Sheets
The Policy Performance and Risk Analysis Dashboard in Google Sheets is the ultimate analytics solution for insurance organizations that want to move from manual, reactive reporting to structured, proactive decision-making. With five dedicated analysis pages, interactive slicers, dynamic KPI cards, and a powerful search feature, this dashboard delivers complete visibility into policy performance, risk exposure, premium collection, and claims behavior.
Whether you manage a small brokerage or a large insurance enterprise, this template helps you centralize data, improve accountability, and drive profitability. Because it is built in Google Sheets, your entire team can collaborate in real time without expensive software or complex setup.
Visit our YouTube channel to learn step-by-step video tutorials
👉 Youtube.com/@NeoTechNavigators
Click to Buy Policy Performance and Risk Analysis Dashboard in Google Sheets