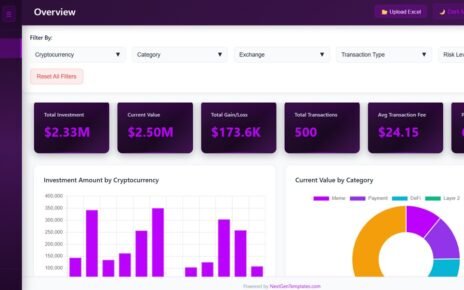
CRM Dashboard in HTML is a professionally designed, interactive, and browser-based analytics template that empowers sales managers, CRM administrators, account executives, and business leaders to monitor deal pipelines, track win rates, analyze account manager performance, and identify revenue opportunities from one centralized interface. Managing customer relationships effectively requires clear visibility into deal stages, conversion rates, and team productivity. This CRM Dashboard in HTML consolidates all your critical CRM data into a single dynamic reporting platform that works instantly in any modern web browser without installing additional software.
Click to Purchases Customer Relationship Management (CRM) Dashboard in HTML
Whether you are overseeing a sales team of five or fifty, tracking CRM performance is essential for identifying high-performing account managers, spotting pipeline bottlenecks, and uncovering revenue growth opportunities. Instead of juggling disconnected spreadsheets and static reports, this dashboard brings everything together with interactive charts, smart filters, and KPI cards that update dynamically as you explore your data.
Key Features of CRM Dashboard in HTML
The CRM Dashboard in HTML includes 5 interactive dashboard pages designed to give sales teams and CRM professionals complete visibility into deal performance, team productivity, industry analysis, lead source effectiveness, and raw data exploration. This template tracks 5 key performance indicators: Total Deals, Total Deal Value, Average Deal Value, Win Rate, and Average Response Time.
The dashboard features interactive charts and visualizations that allow users to analyze deal performance by industry, pipeline stage, monthly trends, lead source, and account manager. Smart slicers let you instantly filter data by industry, lead source, account manager, deal stage, and time period for targeted analysis. The entire dashboard runs in a web browser with a professional SaaS-style design, multi-tab navigation, responsive layout, and CSV data export functionality.
Dashboard Pages Explanation
1. Overview Page
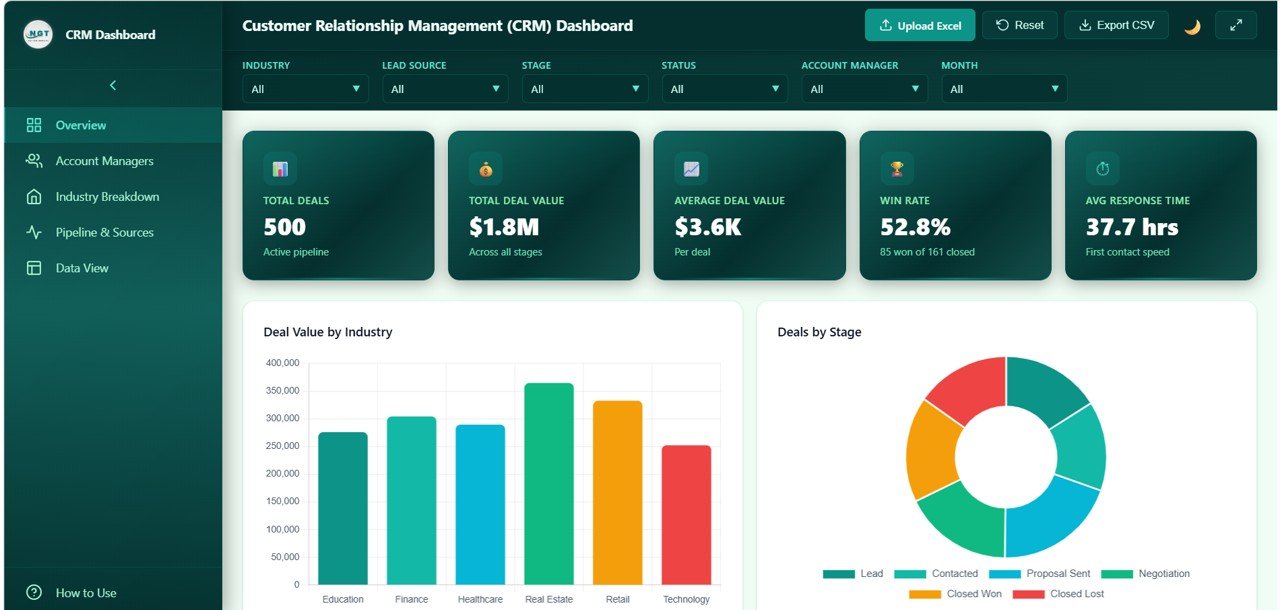
The Overview Page serves as the central command center for CRM performance monitoring. At the top, five KPI cards display the most important metrics at a glance: Total Deals showing the complete count of opportunities in the system, Total Deal Value representing the aggregate monetary value of all deals, Average Deal Value indicating the typical size of each opportunity, Win Rate measuring the percentage of deals successfully closed, and Avg Response Time tracking how quickly the team engages with prospects.
Below the KPI cards, multiple interactive charts provide deeper analytical insights. Deal Value by Industry displays how revenue is distributed across different business sectors, helping identify the most lucrative verticals. Deals by Stage breaks down the sales pipeline health showing how many opportunities exist at each funnel stage. Deal Value by Month tracks revenue trends over time revealing seasonal patterns and growth trajectory. Deals by Lead Source identifies which acquisition channels generate the most opportunities. Avg Win Probability by Industry measures conversion potential across different industry segments. Multiple slicers allow instant filtering for targeted analysis.
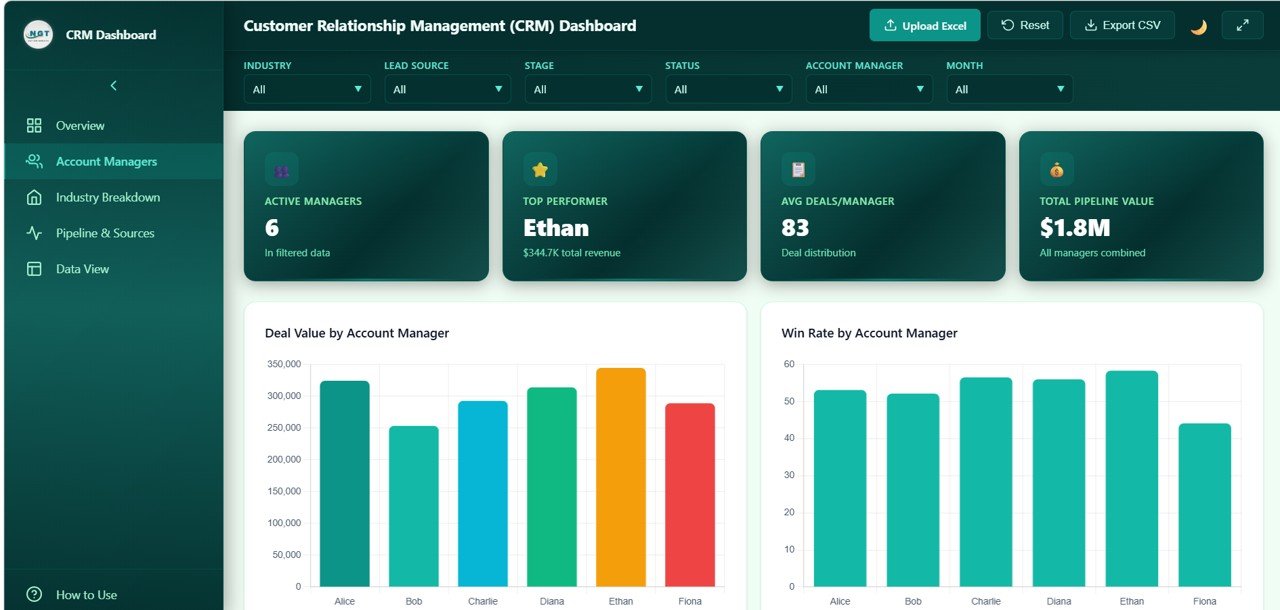
Customer Relationship Management (CRM) Dashboard2. Account Managers
The Account Managers page provides detailed performance analytics for each member of the sales team. Deal Value by Account Manager reveals which team members generate the most revenue, enabling managers to recognize top performers and allocate resources effectively. Win Rate by Account Manager compares closing effectiveness across the sales team, highlighting who converts the most opportunities into wins. Avg Response Time by Account Manager measures responsiveness and engagement speed, a critical factor in deal success. Stage Distribution by Account Manager shows pipeline allocation per team member revealing workload balance. Avg Deal Value by Account Manager identifies who handles the highest-value opportunities.
 Account Managers
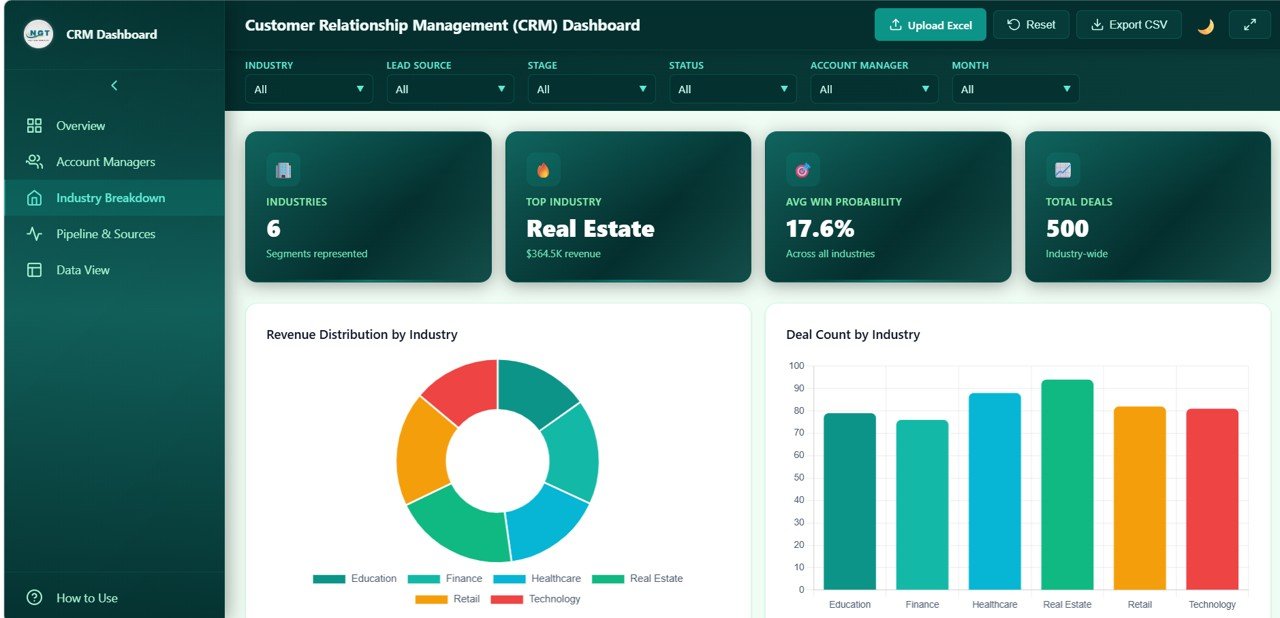
3. Industry Breakdown
The Industry Breakdown page offers sector-level analytics for strategic planning. Revenue Distribution by Industry reveals where the biggest deal values are concentrated across business verticals. Deal Count by Industry measures opportunity volume per sector showing which industries generate the most leads. Win Rate by Industry compares conversion success across verticals, identifying which sectors are easiest to close. Avg Response Time by Industry tracks engagement speed per sector. Avg Deal Value by Industry identifies the most lucrative business segments where sales efforts should be concentrated.
 Industry Breakdown
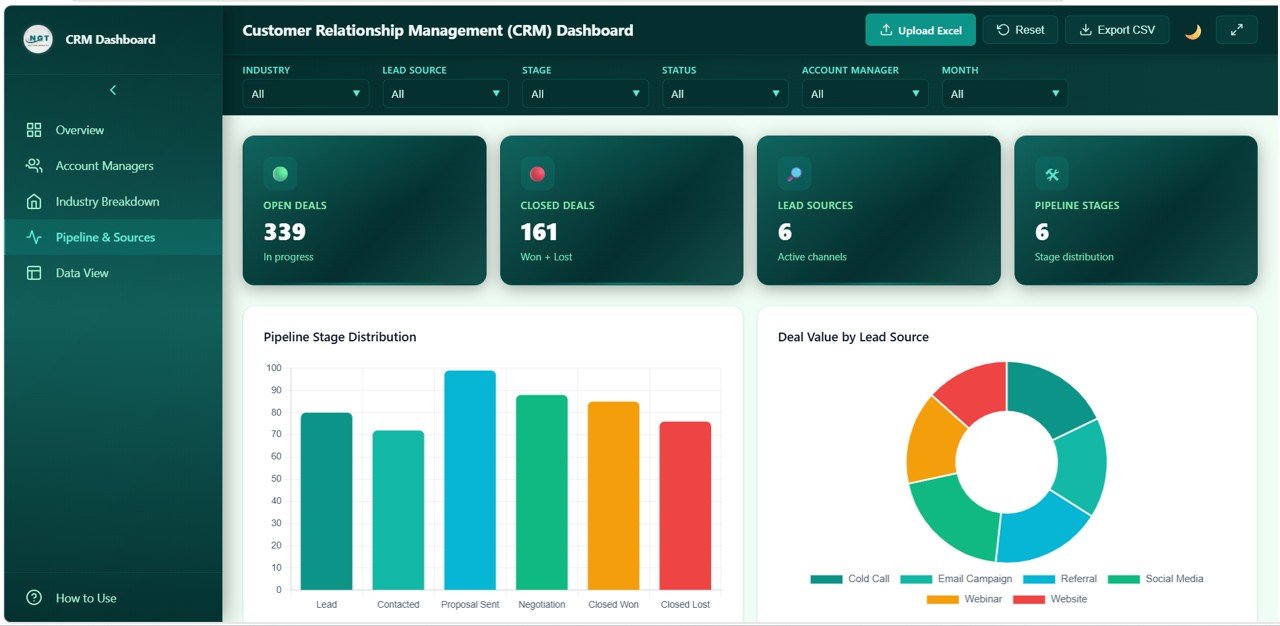
4. Pipeline and Sources
The Pipeline and Sources page analyzes pipeline health and lead source effectiveness. Pipeline Stage Distribution visualizes how deals flow through the sales funnel from initial contact to closure. Deal Value by Lead Source identifies which acquisition channels generate the highest-value deals. Win Rate by Lead Source measures which acquisition methods produce the best conversions. Monthly Deals by Status tracks how new, won, and lost deals change over time revealing pipeline momentum. Avg Response Time by Lead Source reveals which channels demand faster engagement to maximize conversion rates.
 Pipeline and Sources
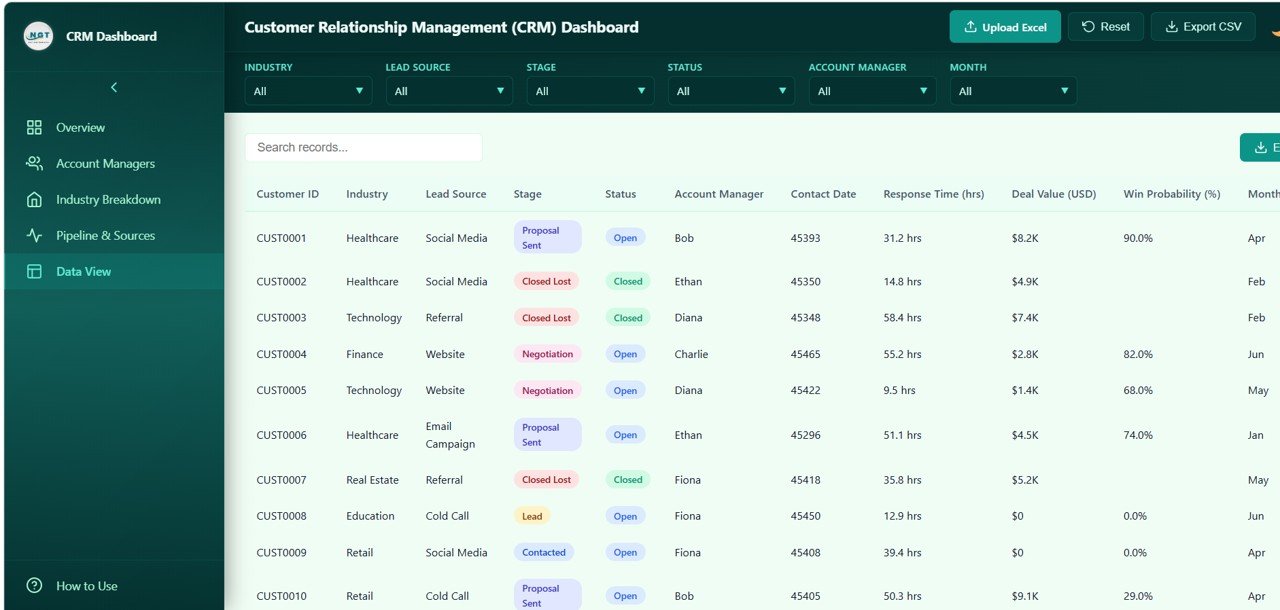
5. Data View
The Data View page is a detailed data table where users can view all CRM records with search, sort, and pagination features. This page supports deep-dive analysis by allowing users to search specific deals, sort by any column, navigate through pages of records, and export filtered data to CSV for further reporting and auditing.
 Data View
Advantages of CRM Dashboard in HTML
The CRM Dashboard in HTML offers several compelling advantages for sales teams and business leaders. First, it provides centralized CRM analytics by consolidating deal data, pipeline metrics, and team performance into one unified interface. Second, the browser-based design means no software installation is required, making it accessible on any device with a web browser. Third, the interactive filters and slicers enable instant data exploration without complex query building. Fourth, the responsive design works across desktops, tablets, and mobile devices for on-the-go access. Fifth, the CSV export functionality supports deeper analysis and reporting needs outside the dashboard.
Opportunities for Improvement
While this dashboard already delivers powerful CRM analytics, organizations can extend its value by integrating it with live CRM API connections for real-time data synchronization. Adding predictive analytics for deal scoring and revenue forecasting would enhance strategic planning capabilities. Incorporating email and communication tracking metrics would provide a more complete view of customer engagement. Custom alert thresholds for KPI deviations could enable proactive pipeline management rather than reactive analysis.
Best Practices
To maximize the value of this CRM Dashboard in HTML, organizations should update deal data regularly to ensure accurate pipeline visibility. Focus on tracking the metrics that directly impact revenue such as win rate, average deal value, and response time. Use the industry and lead source analysis to allocate marketing budgets to the highest-performing channels. Leverage the account manager analysis for performance reviews and coaching conversations. Export data regularly for historical trend analysis and executive reporting.
Explore Relevant Templates
Click to Purchases Customer Relationship Management (CRM) Dashboard in HTML
If you are looking for more analytics solutions, explore these related templates from NextGenTemplates:
- Customer Satisfaction Dashboard in HTML — Track CSAT, resolution time, SLA performance, and channel insights with interactive analytics.
- Customer Service Dashboard in HTML — Monitor support tickets, agent performance, resolution times, and satisfaction scores.
- Business Development Dashboard in Google Sheets — Track revenue, profit, marketing spend, and sales channel performance.
Frequently Asked Questions
What is the best CRM dashboard template for tracking sales pipelines?
The CRM Dashboard in HTML is an excellent template for tracking sales pipelines because it includes pipeline stage distribution, deal value by lead source, win rate analysis, monthly deal status tracking, and account manager performance analysis across 5 interactive pages.
How do I use the CRM Dashboard in HTML?
Simply download the ZIP file, extract it, and open the HTML file in any modern browser like Chrome, Firefox, or Edge. Replace the sample data with your actual CRM data and all charts and KPIs update automatically. No coding skills are required.
Can I track account manager performance with this dashboard?
Yes. The dedicated Account Managers page shows deal value, win rate, response time, stage distribution, and average deal value for each team member, enabling comprehensive sales team performance analysis.
What KPIs does this CRM dashboard track?
The dashboard tracks 5 key CRM metrics: Total Deals, Total Deal Value, Average Deal Value, Win Rate, and Average Response Time. These KPIs are displayed on dynamic cards with supporting visualizations across 5 interactive pages.
Can I export data from this CRM dashboard?
Yes. The Data View page includes search, sort, pagination, and CSV export functionality, allowing you to extract filtered CRM records for further analysis, reporting, and executive presentations.
Does this dashboard work on mobile devices?
Yes. The CRM Dashboard in HTML features a responsive layout optimized for desktops, tablets, and mobile devices, so you can check your CRM metrics from anywhere.
Conclusion
The CRM Dashboard in HTML is a powerful, ready-to-use analytics solution for sales teams and CRM professionals who need clear visibility into deal performance, pipeline health, account manager productivity, and revenue trends. With 5 interactive pages, dynamic KPI cards, smart filters, and CSV export capabilities, this dashboard transforms raw CRM data into actionable insights that drive better sales decisions and faster revenue growth. Purchase this template today and start making data-driven CRM decisions immediately.
🎥 Visit our YouTube channel to learn step-by-step video tutorials
👉 Youtube.com/@NeoTechNavigators
Click to Purchases Customer Relationship Management (CRM) Dashboard in HTML