Rental Property Investment Dashboard in HTML is a powerful, interactive, and professionally designed browser-based dashboard template built to help property investors, landlords, real estate portfolio managers, and financial analysts monitor every critical aspect of their rental property investments. This template includes 5 interactive dashboard pages — Overview, Financial Analysis, Property Insights, Risk and Financing, and Data View — making it the most comprehensive HTML-based rental property analytics solution available today.
Click here to Purchase the Rental Property Investment Dashboard in HTML
Whether you own a few rental units or manage a large real estate portfolio, this dashboard transforms your raw property data into beautiful, actionable visual insights — all inside a single HTML file that runs directly in your browser. No installation, no plugins, no licenses — just unzip and open. If you have been searching for a modern, data-driven alternative to spreadsheets for tracking rental property performance, the Rental Property Investment Dashboard in HTML is your answer.
Key Features of Rental Property Investment Dashboard in HTML
This dashboard is packed with features designed specifically for rental property investment tracking and analysis. It includes 6 dynamic KPI cards on the overview page that display Total Portfolio Value, Total Monthly Rent, Avg Cap Rate, Occupancy Rate, Total Properties, and Avg ROI. These metrics give you an instant snapshot of your entire rental portfolio performance.
The template provides 5 dedicated analysis pages, each focusing on a different dimension of your rental property business. The interactive slicers and filters let you drill down by property type, city, state, investment strategy, occupancy status, and other dimensions. The comprehensive chart library visualizes your data through charts covering portfolio value, rental income, occupancy distribution, investment strategy breakdown, revenue vs expenses, cash flow analysis, risk assessment, and much more.
Because the dashboard is browser-based, it requires absolutely no software installation. It features a SaaS-grade professional design with responsive layout, multi-tab navigation, and a data explorer with search, sort, pagination, and CSV export capabilities. This makes it ideal for both personal use and professional presentations.
Dashboard Pages Explained
Overview Page
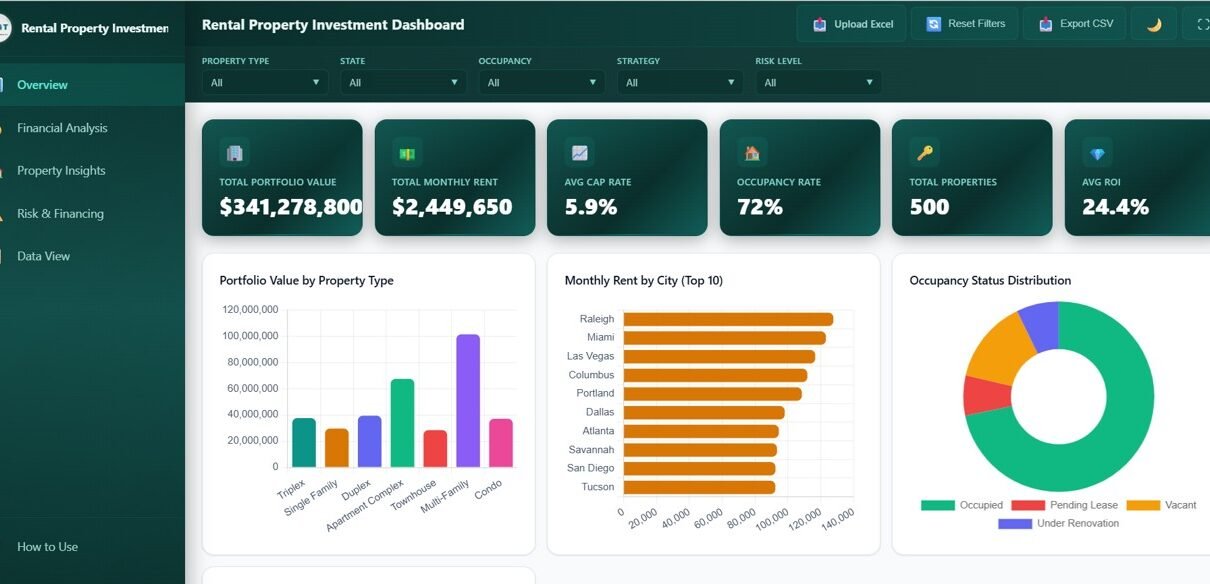
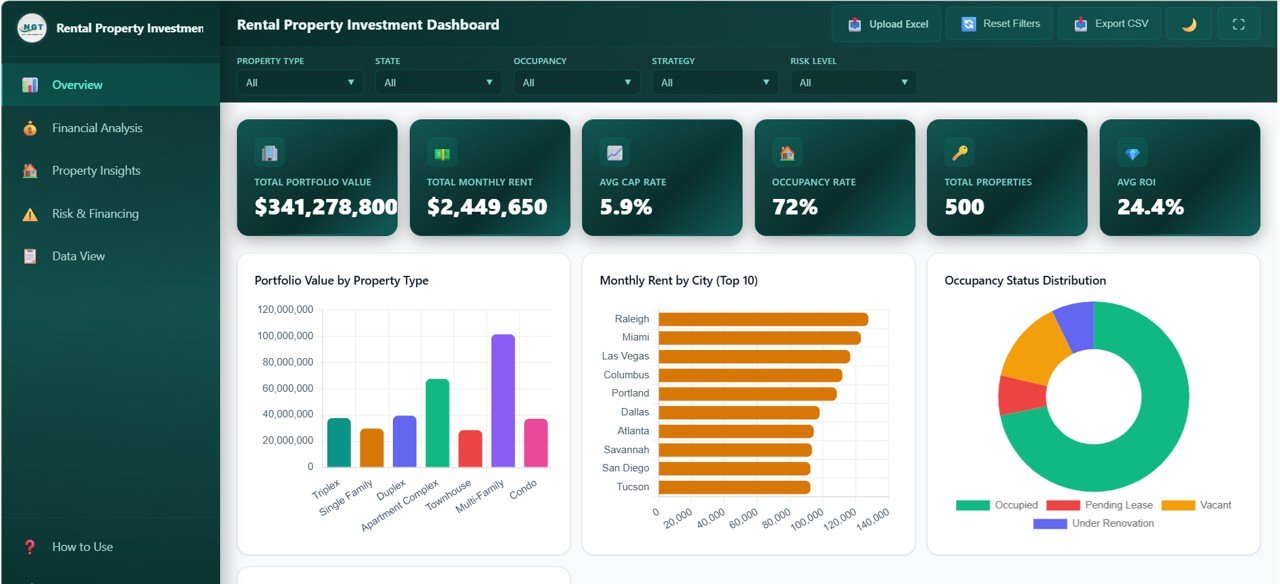
The Overview page serves as your main command center. At the top, 6 KPI cards display high-level metrics: Total Portfolio Value, Total Monthly Rent, Avg Cap Rate, Occupancy Rate, Total Properties, and Avg ROI. Below the cards, interactive charts show Portfolio Value by Property Type, Monthly Rent by City, Occupancy Status Distribution, Investment Strategy Breakdown, and Purchase Price vs Current Value Trend. Multiple slicers allow you to instantly filter the entire dashboard.
Rental Property Investment Dashboard in HTML
Financial Analysis
The Financial Analysis page provides a deep dive into the monetary performance of your rental portfolio. It includes charts for Revenue vs Expenses by Property Type to compare income against costs, Cash Flow by Strategy to evaluate different investment approaches, Appreciation by State to track property value growth geographically, and Expense Breakdown by Category to understand where your money goes. This page helps investors quickly identify which properties and strategies are generating the highest returns.
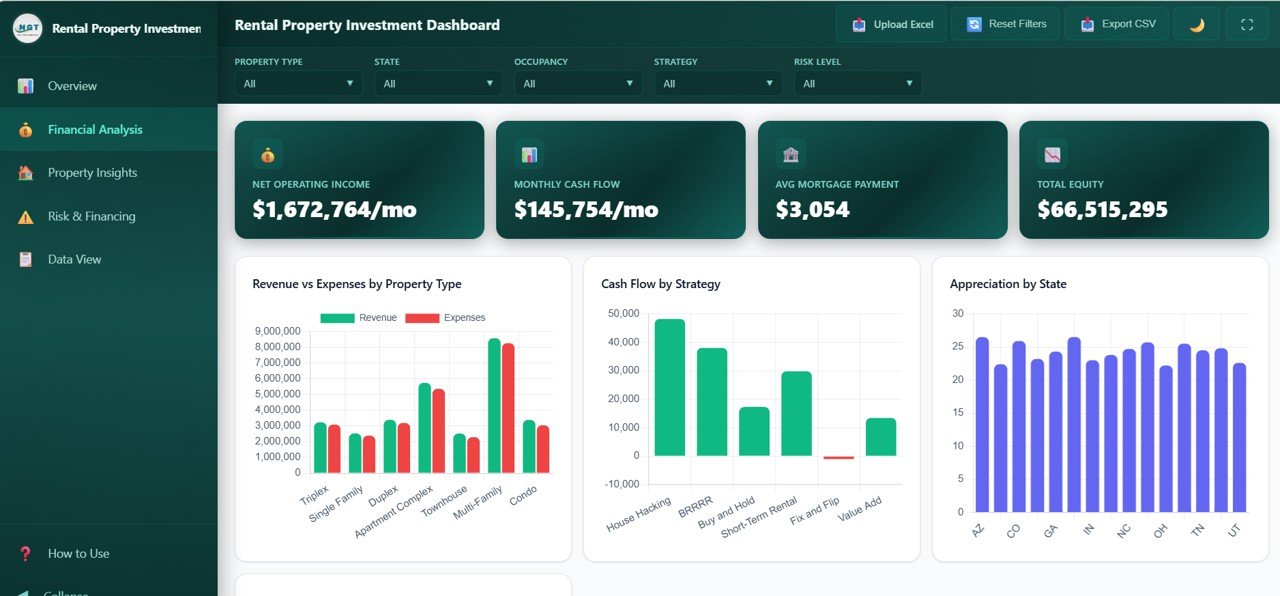
Financial Analysis
Property Insights
The Property Insights page helps you understand the physical characteristics of your portfolio. It visualizes Properties by Bedroom Count to see your unit mix distribution, Average Rent by Property Type to benchmark rental income, Square Feet vs Monthly Rent to analyze rent per square foot efficiency, and Properties by Neighborhood to understand geographic concentration. This analysis is invaluable for identifying which property configurations deliver the best rental returns.
Click here to Purchase the Rental Property Investment Dashboard in HTML
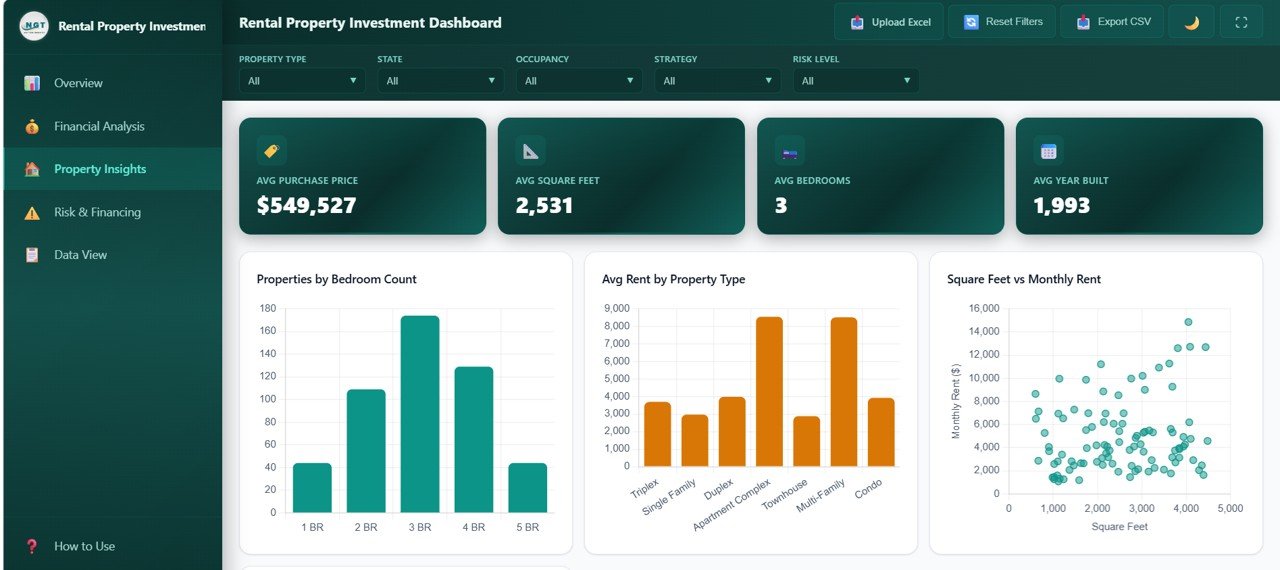
Property Insights
Risk and Financing
The Risk and Financing page evaluates the financial structure and risk exposure of your portfolio. Charts include Properties by Financing Type to see your mortgage and financing mix, Risk Level Distribution to understand overall portfolio risk, Average Interest Rate by Financing Type to compare borrowing costs, and Properties by Risk and Strategy to correlate risk levels with investment approaches. This page empowers data-driven risk management decisions.
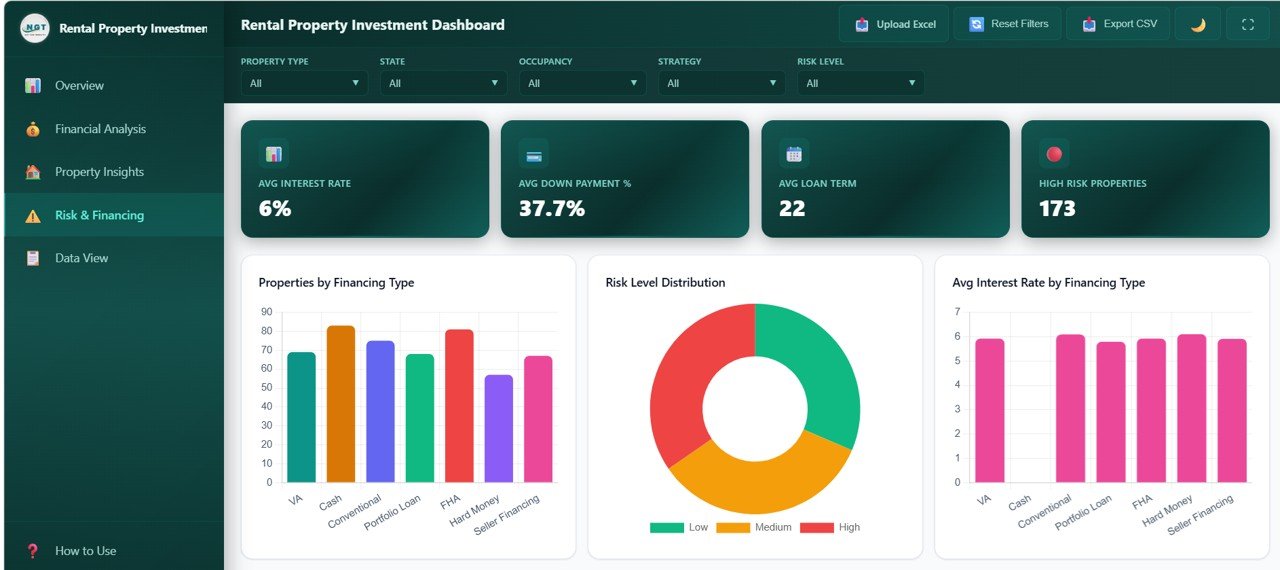
Risk and Financing
Data View
The Data View page is a detailed data table where you can see all your rental property records. It features search functionality to find specific properties, column sorting for quick analysis, pagination for easy navigation through large datasets, and CSV export capability so you can download filtered data for further analysis or reporting.
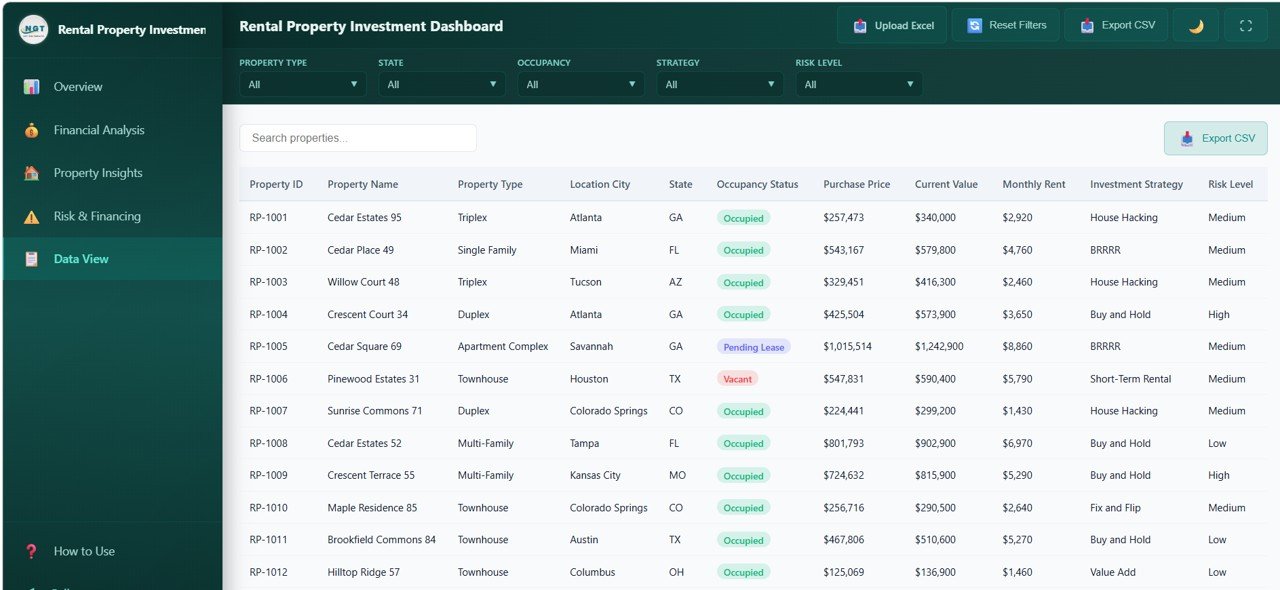
Data View
Advantages of Rental Property Investment Dashboard in HTML
This dashboard eliminates the need for expensive BI software or complex spreadsheet management. Since it runs entirely in a web browser, it offers true zero-cost analytics with no recurring license fees. The interactive filters and charts provide real-time insights that static reports cannot match. The professional design is presentation-ready, making it suitable for sharing with investors, partners, or lenders. Because it covers 5 different analytical dimensions — portfolio overview, financial analysis, property insights, risk assessment, and raw data exploration — it serves as a complete rental property analytics solution in one template.
The dashboard is also fully customizable. You can replace the sample data with your own rental property records, and all charts, KPIs, and filters update automatically. This flexibility makes it suitable for portfolios of any size, from a few rental units to hundreds of properties across multiple states.
Opportunities for Improvement
While this dashboard is comprehensive, there are areas where it could be enhanced further. Adding a dedicated Tenant Management page with lease expiration tracking and tenant demographics would add more operational value. Integration with live data sources or APIs for automatic data refresh would reduce manual data entry. Including a Map View page with geographic visualization of property locations could provide spatial analytics. Additionally, adding trend lines and forecasting capabilities for portfolio value and rental income projections would support long-term planning.
Best Practices
To get the most out of this dashboard, keep your property data up to date — ideally refreshing it monthly. Use the slicers strategically to compare performance across different property types, cities, and strategies. Review the Financial Analysis page regularly to spot expense trends and optimize costs. Use the Risk and Financing page before making new investment decisions to understand your current portfolio exposure. Export data from the Data View tab for presentations or to share with your accountant or financial advisor.
Explore Relevant Templates
If you are looking for similar dashboards in other platforms, check out these related templates from NextGenTemplates:
Rental Property Investment Dashboard in Excel – The Excel version with pivot tables and dynamic slicers for users who prefer Microsoft Excel.
Rental Property Investment Dashboard in Power BI – The Power BI version with advanced DAX measures and interactive visualizations.
Real Estate Dashboard in HTML – A browser-based real estate analytics dashboard with property, agent, and regional analysis.
Hospitality Dashboard in HTML – An interactive HTML dashboard for hotels and resorts with revenue, occupancy, and guest satisfaction tracking.
Real Estate Valuation Dashboard in Power BI – Analyze property valuation, rental income, and regional performance trends.
Click here to Purchase the Rental Property Investment Dashboard in HTML
Frequently Asked Questions
What is the best HTML dashboard template for tracking rental property investments?
The Rental Property Investment Dashboard in HTML from NextGenTemplates is one of the best options available. It includes 5 interactive pages covering portfolio overview, financial analysis, property insights, risk assessment, and a data explorer with CSV export — all in a professionally designed browser-based template that requires no software installation.
How many KPIs does the Rental Property Investment Dashboard in HTML track?
The dashboard tracks 6 key performance indicators on the Overview page: Total Portfolio Value, Total Monthly Rent, Avg Cap Rate, Occupancy Rate, Total Properties, and Avg ROI. It also includes detailed financial metrics across revenue, expenses, cash flow, appreciation, risk levels, and financing analysis across the other 4 pages.
Do I need any software to use this HTML dashboard?
No software is required. This dashboard runs entirely in your web browser. Simply unzip the downloaded file and open index.html in any modern browser like Chrome, Firefox, Edge, or Safari. There is no installation, plugins, or licenses needed.
Can I customize the data in this rental property dashboard?
Yes. You can replace the sample data with your own rental property records. Once updated, all charts, KPIs, filters, and the data table refresh automatically to reflect your actual portfolio data.
Who should use this rental property investment dashboard?
This dashboard is ideal for property investors, landlords, real estate portfolio managers, financial analysts, property management companies, real estate consultants, and students studying real estate analytics or data visualization.
Is this dashboard available in Excel or Power BI as well?
Yes. NextGenTemplates offers this dashboard in three platforms: HTML (browser-based), Excel (with pivot tables and slicers), and Power BI (with DAX measures and interactive visuals). You can choose the platform that best fits your workflow.
Conclusion
The Rental Property Investment Dashboard in HTML is a complete, professional, and interactive analytics solution for anyone managing rental property investments. With 5 dedicated pages covering portfolio overview, financial analysis, property insights, risk and financing, and raw data exploration, it provides the clarity and depth that real estate investors need to make smarter decisions. The browser-based design means you can start analyzing immediately without any software costs or setup complexity.
Click here to Purchase the Rental Property Investment Dashboard in HTML
Visit our YouTube channel for step-by-step video tutorials: Youtube.com/@NeoTechNavigators