Freelancer Business Dashboard in HTML is a browser-based, interactive analytics template built for freelancers, independent consultants, solopreneurs, and small business owners who want to monitor revenue, projects, clients, hourly rates, and financial performance from a single dynamic interface. This ready-to-use HTML Dashboard Template includes 5 dedicated pages covering an Overview with KPI cards, Client Insights, Project Analytics, Financial Overview, and a detailed Data View — giving you a complete 360-degree picture of your freelance business health.
Whether you are tracking revenue by project type, analyzing your top clients by revenue, or monitoring monthly income trends, this Freelancer Business Dashboard in HTML transforms your raw freelance data into clear, actionable visual insights. Simply unzip the file, open index.html in any modern browser, and replace the sample data with your own records. If you prefer working in Excel, check out the Freelancer Business Dashboard in Excel, or explore the Freelancer Business Dashboard in Power BI for advanced analytics.
Click here to Purchase Freelancer Business Dashboard in HTML
Key Features of Freelancer Business Dashboard in HTML
The Freelancer Business Dashboard in HTML includes 5 interactive dashboard pages and tracks 6 key metrics including Total Revenue, Net Profit, Total Projects, Hours Worked, Avg Hourly Rate, and Avg Project Value. Here are the standout features that make this template essential for every freelancer:
- 5 Interactive Dashboard Pages — Overview, Client Insights, Project Analytics, Financial Overview, and Data View tabs provide complete freelance business visibility from every angle.
- 6 Dynamic KPI Cards — Total Revenue, Net Profit, Total Projects, Hours Worked, Avg Hourly Rate, and Avg Project Value displayed prominently on the Overview page for instant performance monitoring.
- Multiple Slicer Filters — Apply quick filters to drill down into specific project types, platforms, categories, and time periods for targeted analysis.
- Client-Level Revenue Analysis — Top 10 Clients by Revenue, Client Revenue by Platform, Projects per Client, and Satisfaction Distribution on the Client Insights page.
- Project Performance Breakdown — Revenue by Project Type, Revenue by Priority, Status by Project Type, and Avg Revisions by Project Type on the Project Analytics page.
- Financial Health Monitoring — Monthly Revenue vs Expenses, Revenue by Payment Status, Revenue by Hourly Rate Tier, and Profit Margin by Category on the Financial Overview page.
- Data View with Search and Export — Browse all records with search, sort, pagination, and CSV export functionality.
- Browser-Based — No software installation required. Open index.html in Chrome, Edge, Firefox, or Safari.
- Easy Data Replacement — Swap sample data with your own freelance records and all visuals auto-update.
Dashboard Pages Explanation
The Freelancer Business Dashboard in HTML includes 5 purpose-built pages designed specifically for freelance business analytics. Each page focuses on a different aspect of your freelance operations to provide complete visibility.
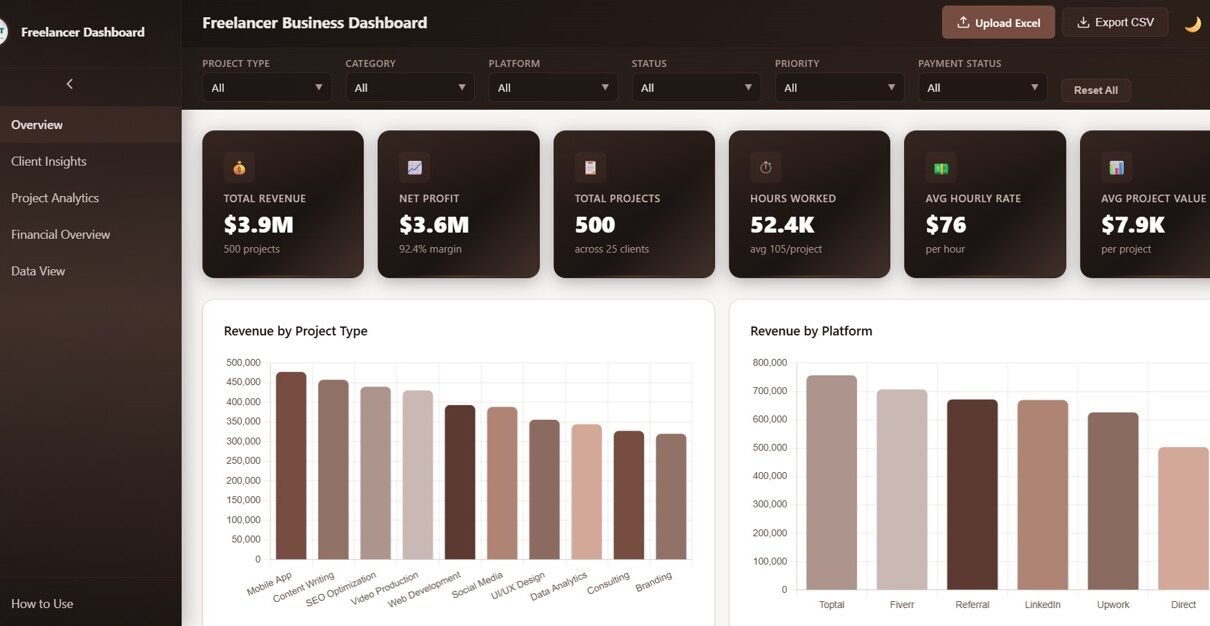
1. Overview Page
The Overview page serves as your main command center. At the top, 6 KPI cards display Total Revenue, Net Profit, Total Projects, Hours Worked, Avg Hourly Rate, and Avg Project Value for an instant snapshot of your freelance business health. Below the cards, interactive charts show Revenue by Project Type breaking down how much income each project category generates, Revenue by Platform comparing your earnings across different freelance platforms like Upwork, Fiverr, Toptal, and direct clients, Projects by Status displaying the distribution of completed, in-progress, and pending projects, Revenue by Category analyzing income by service category, and Monthly Revenue Trend tracking your earnings trajectory over time. Multiple slicers allow you to filter the entire page instantly by any dimension.
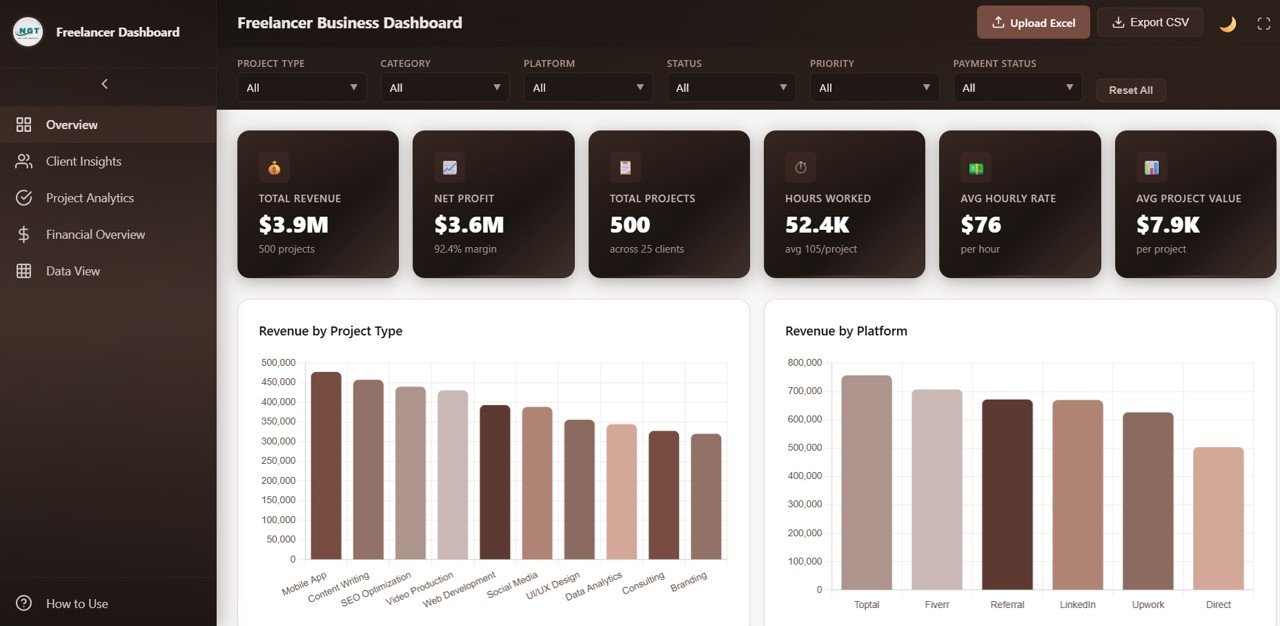
Freelancer Business Dashboard Overview
2. Client Insights
The Client Insights page provides a deep-dive into your client relationships and revenue patterns. It features Top 10 Clients by Revenue identifying your highest-value client relationships at a glance, Client Revenue by Platform showing which freelance channels drive the most client-sourced revenue, Projects per Client measuring how frequently each client engages you for work, and Satisfaction Distribution tracking overall client happiness levels across your entire portfolio. This page is essential for freelancers who want to understand which clients contribute the most to their bottom line and where to focus their relationship-building efforts.
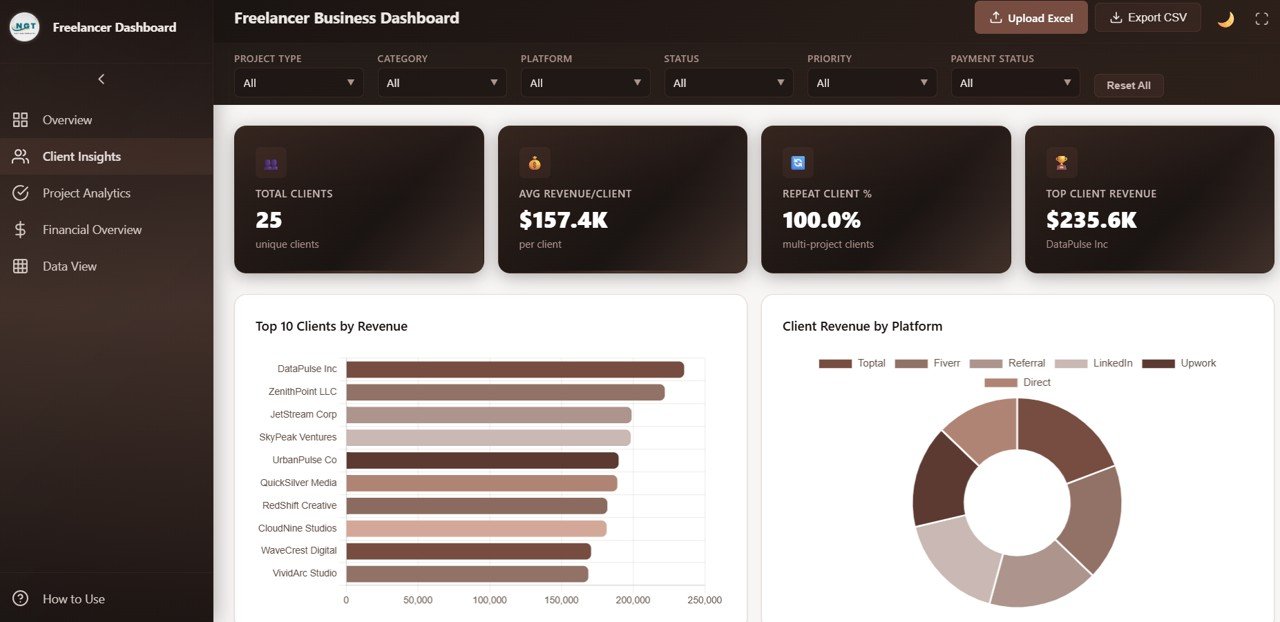
Client Insights
3. Project Analytics
The Project Analytics page breaks down your work at the project level to help you understand which types of projects are most profitable and efficient. It displays Revenue by Project Type showing which project categories generate the most income, Revenue by Priority comparing earnings across different priority levels to see if high-priority projects actually translate to higher revenue, Status by Project Type tracking completion patterns and identifying which project categories tend to stall or delay, and Avg Revisions by Project Type revealing which types of projects require the most rework and revision cycles.
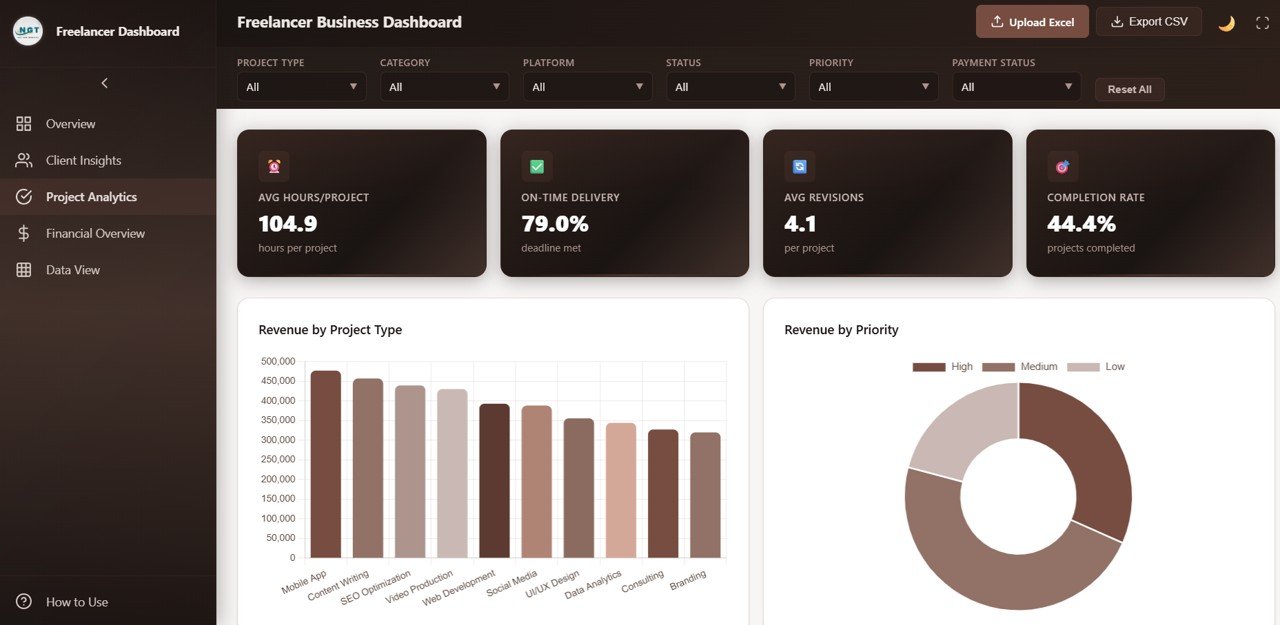
Project Analytics
4. Financial Overview
The Financial Overview page gives you complete visibility into the financial health of your freelance business. It features Monthly Revenue vs Expenses tracking your profitability trends month over month, Revenue by Payment Status showing the breakdown of paid, pending, and overdue amounts so you can manage your cash flow, Revenue by Hourly Rate Tier analyzing which hourly rate brackets generate the most total income, and Profit Margin by Category identifying your most profitable service lines so you can prioritize the work that delivers the highest returns.
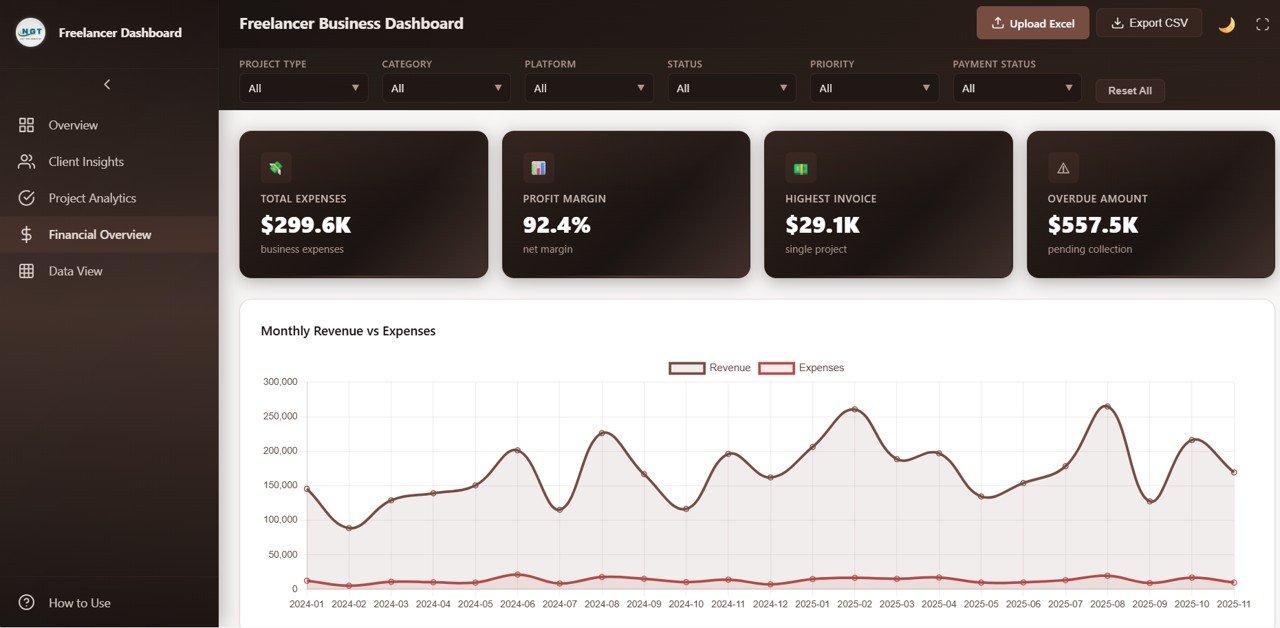
Financial Overview
5. Data View
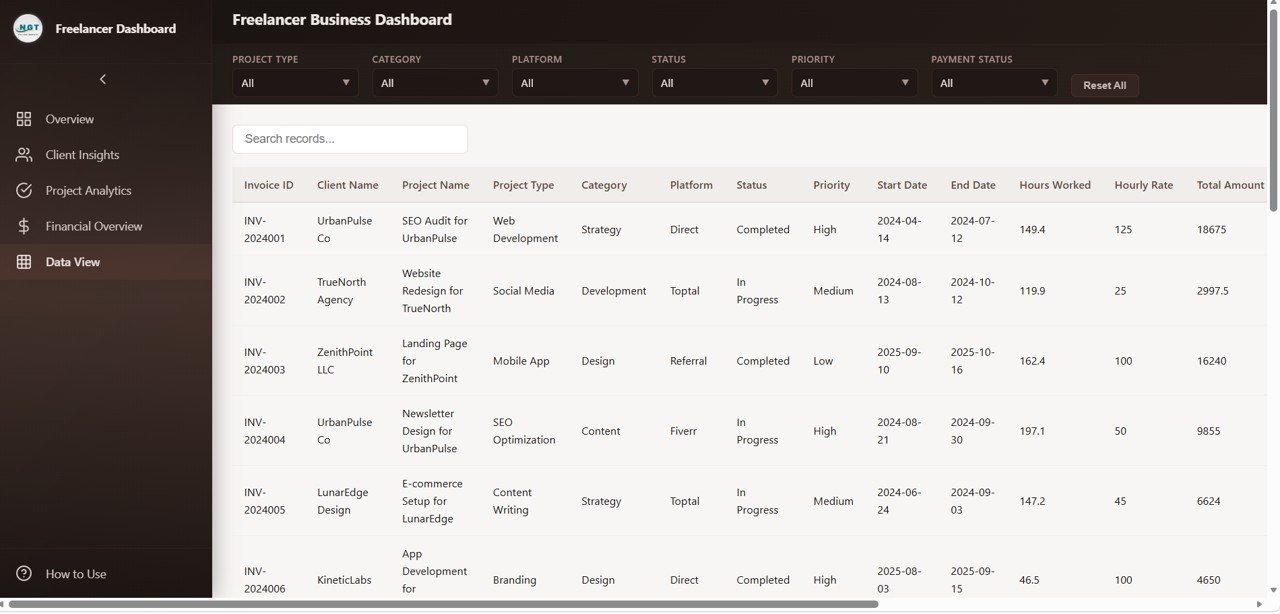
The Data View page is a detailed data table where you can see all your freelance project records in one place. It includes search functionality to quickly find specific records, column sorting to organize data by any field, pagination for easy navigation through large datasets, and CSV export to download your filtered data for external analysis, accounting, or reporting purposes. This page is particularly useful for audits, tax preparation, and detailed record review.
Advantages of Freelancer Business Dashboard in HTML
This dashboard offers several key advantages for freelancers looking to professionalize their business analytics:
- Zero Software Cost — Unlike Excel or Power BI dashboards, this HTML template works in any free web browser with no license or subscription needed.
- Instant Setup — Unzip and open in your browser. No installation, no configuration, no learning curve.
- Cross-Platform Compatibility — Works identically on Windows, Mac, Linux, and even tablets and smartphones through mobile browsers.
- Complete Business Visibility — Five dedicated pages cover every angle of your freelance operations from high-level KPIs to granular transaction data.
- Client Intelligence — Dedicated client analysis helps you identify your most valuable relationships and allocate your time more strategically.
- Financial Clarity — Revenue vs expense tracking, payment status monitoring, and profit margin analysis give you the financial insights needed to grow sustainably.
- Data Export — CSV export from the Data View page lets you share data with accountants, integrate with other tools, or perform deeper analysis externally.
Opportunities for Improvement
While this dashboard covers the core needs of freelance business analytics comprehensively, there are areas where you might consider extending its functionality:
- Tax Estimation — Adding a tax estimation calculator based on revenue and expense data could help freelancers with quarterly tax planning.
- Goal Setting — Incorporating monthly or yearly revenue targets with progress bars would enable freelancers to track their goals visually.
- Time Tracking Integration — Connecting with time tracking tools like Toggl or Clockify could automate hours worked data entry.
- Invoice Status — A dedicated invoice tracking view with aging analysis would complement the existing payment status charts.
Best Practices
To get the most out of your Freelancer Business Dashboard in HTML, follow these recommended practices:
- Update Data Weekly — Regular data updates ensure your dashboard always reflects current business performance rather than outdated snapshots.
- Use Consistent Categories — Maintain consistent naming conventions for project types, categories, and platforms to ensure accurate chart analysis.
- Review Client Insights Monthly — Monthly client analysis helps you spot declining accounts early and proactively strengthen key relationships.
- Monitor Profit Margins — Regularly check the Financial Overview page to ensure your pricing strategy delivers healthy margins across all service categories.
- Export and Archive — Use the CSV export feature to create monthly backups of your data for tax records and historical analysis.
Explore Relevant Templates
If you found this Freelancer Business Dashboard in HTML useful, explore these related templates from NextGenTemplates to build a complete freelance analytics toolkit:
- Freelancer Business Dashboard in Excel — The same freelance analytics concept built in Microsoft Excel with pivot tables and dynamic charts for users who prefer spreadsheet-based dashboards.
- Freelancer Business Dashboard in Power BI — Advanced freelance business analytics with interactive filtering, cross-page drill-through, and 5 dynamic Power BI pages.
- Freelance Business KPI Scorecard in Google Sheets — A KPI-focused scorecard for freelancers with Actual vs Target comparisons and trend analysis in Google Sheets.
- Personal Finance Dashboard in HTML — Track personal income, expenses, savings, and budgets in a browser-based HTML dashboard.
Frequently Asked Questions
What metrics does the Freelancer Business Dashboard in HTML track?
The Freelancer Business Dashboard in HTML tracks 6 key metrics on the Overview page: Total Revenue, Net Profit, Total Projects, Hours Worked, Avg Hourly Rate, and Avg Project Value. Additional analysis across 5 interactive pages covers client revenue breakdowns, project analytics by type and priority, financial health with revenue vs expenses and profit margins, and a searchable data view with CSV export capability.
Do I need any special software to use this HTML dashboard?
No. Simply unzip the downloaded file and open index.html in any modern web browser like Chrome, Firefox, Edge, or Safari. No Excel, Power BI, or additional software installation is needed. The dashboard works entirely in your browser.
Can I replace the sample data with my own freelance data?
Yes. The dashboard is designed for easy data replacement. Update the data file included in the download with your own freelance business records, and all charts, KPIs, and tables refresh automatically to reflect your actual performance.
Can I track multiple freelance platforms in this dashboard?
Yes. The dashboard includes platform-level analysis in the Overview page showing Revenue by Platform and in the Client Insights page showing Client Revenue by Platform. This makes it ideal for freelancers working across Upwork, Fiverr, Toptal, and direct client channels simultaneously.
Can I export my data from this dashboard?
Yes. The Data View page includes a CSV export feature that lets you download your filtered data for external analysis, accounting purposes, tax preparation, or integration with other business tools.
What is the best HTML dashboard template for freelancers?
The Freelancer Business Dashboard in HTML from NextGenTemplates is one of the most comprehensive browser-based freelance analytics templates available. It includes 5 interactive pages, 6 KPI cards, client insights, project analytics, financial overview, slicer filters, and a full data view with CSV export — all in a single HTML file ready for immediate use.
Conclusion
The Freelancer Business Dashboard in HTML is an essential tool for any freelancer who wants to move beyond guesswork and make data-driven decisions about their business. With 5 interactive pages covering revenue, clients, projects, finances, and raw data, this template gives you the complete visibility needed to grow your freelance business strategically. Whether you are just starting your freelance journey or running a well-established consulting practice, this dashboard adapts to your needs with easy data replacement and browser-based accessibility.
Click here to Purchase Freelancer Business Dashboard in HTML
Visit our YouTube channel for step-by-step video tutorials: Youtube.com/@NeoTechNavigators