If you run a veterinary practice and want a fast, lightweight way to turn clinic records into insights, the Veterinary Clinic Dashboard in HTML is built exactly for that. It is a browser-based analytics template that tracks visits, revenue, pet demographics, treatments, diagnoses, and veterinarian performance — all in one interactive, SaaS-style dashboard. No Excel, no Power BI, no Google Sheets required. Just open the HTML file in your browser and start exploring your clinic data in seconds.
This detailed guide walks you through every page, chart, and feature of the Veterinary Clinic Dashboard in HTML, along with best practices, advantages, and opportunities for improvement. If you prefer a spreadsheet version, you can also check out the Veterinary Clinic Dashboard in Google Sheets tutorial on NeoTechNavigators.
👉 Click here to Purchase the Veterinary Clinic Dashboard in HTML
Key Features of Veterinary Clinic Dashboard in HTML
The Veterinary Clinic Dashboard in HTML is a single-file interactive dashboard built using HTML, CSS, and JavaScript. It tracks 6 KPIs and 20+ charts across 5 dedicated pages. Here are the headline features:
- Runs in any modern browser – Chrome, Edge, Firefox, or Safari. No installation, no cloud account, no license fees.
- 6 KPI cards on the Overview page: Total Visits, Total Revenue, Avg Bill Amount, Avg Satisfaction, Completed Rate, and Avg Visit Duration.
- 5 analytical pages: Overview, Patient Analysis, Treatment Insights, Vet Performance, and Data View.
- Interactive slicers and filters to slice clinic data by date, pet type, department, or veterinarian.
- Search, sort, pagination, and CSV export built into the Data View page.
- Fully responsive design for desktop, tablet, and mobile.
- Easy data replacement – swap out the sample data in the data file and the whole dashboard refreshes automatically.
- Host anywhere – on your clinic website, a local machine, a secure intranet, or a static hosting service.
Dashboard Pages Explanation
Let us walk through each of the 5 pages inside the Veterinary Clinic Dashboard in HTML and understand what each page delivers.
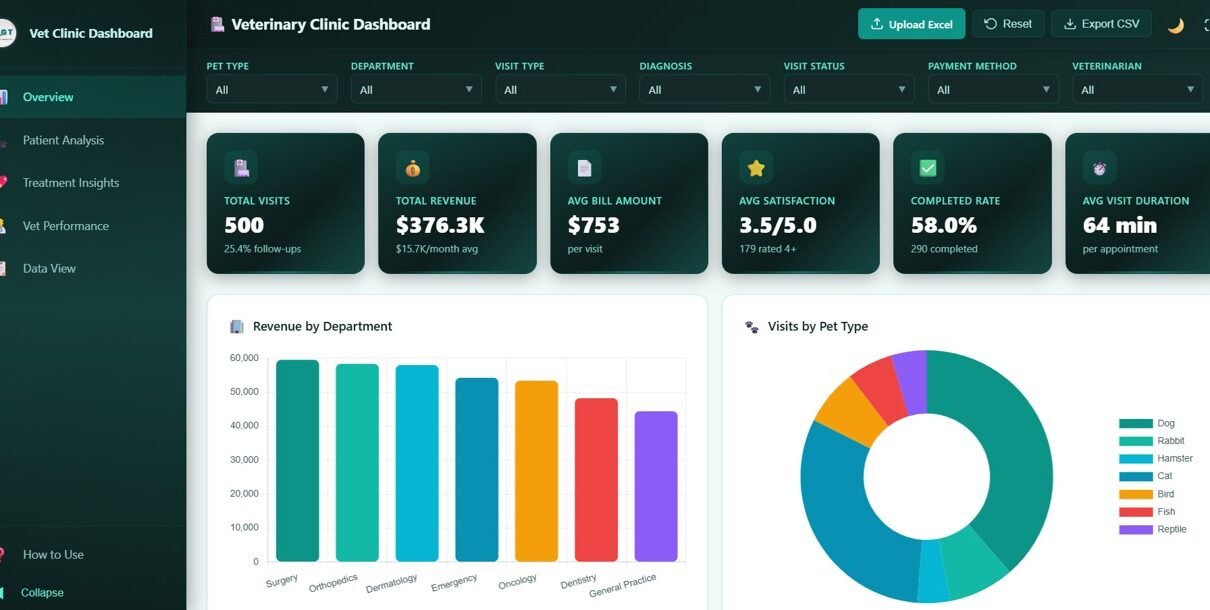
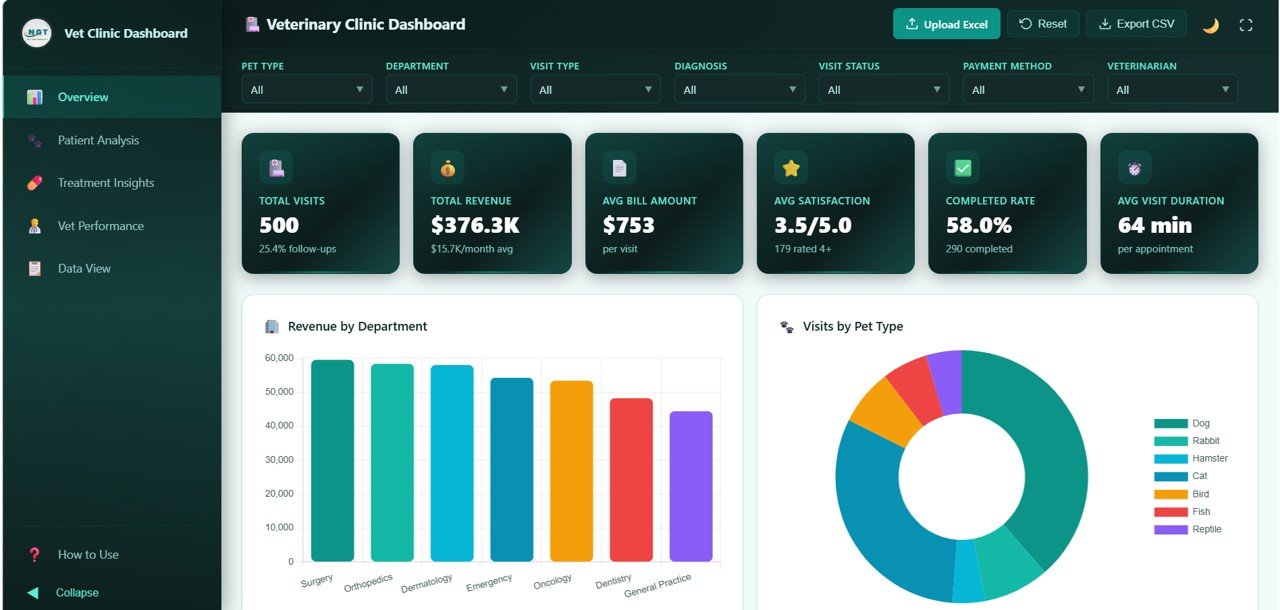
1. Overview Page
The Overview page is the home base of the dashboard. At the top, you will find 6 clearly labeled KPI cards that summarize your clinic performance at a glance:
- Total Visits – total count of clinic visits for the selected period.
- Total Revenue – cumulative revenue earned.
- Avg Bill Amount – average invoice value per visit.
- Avg Satisfaction – average satisfaction rating from pet owners.
- Completed Rate – percentage of visits that were completed successfully.
- Avg Visit Duration – average duration of each veterinary consultation.
Below the KPI cards, you get five analytical charts: Revenue by Department, Visits by Pet Type, Visit Status Distribution, Monthly Revenue Trend, and Top Diagnosis Categories. Together, these charts answer the most important questions for a clinic owner — which departments earn the most, which pets visit most frequently, how many visits are completed vs cancelled, how revenue is trending month-over-month, and what clinical issues are most common.
2. Patient Analysis
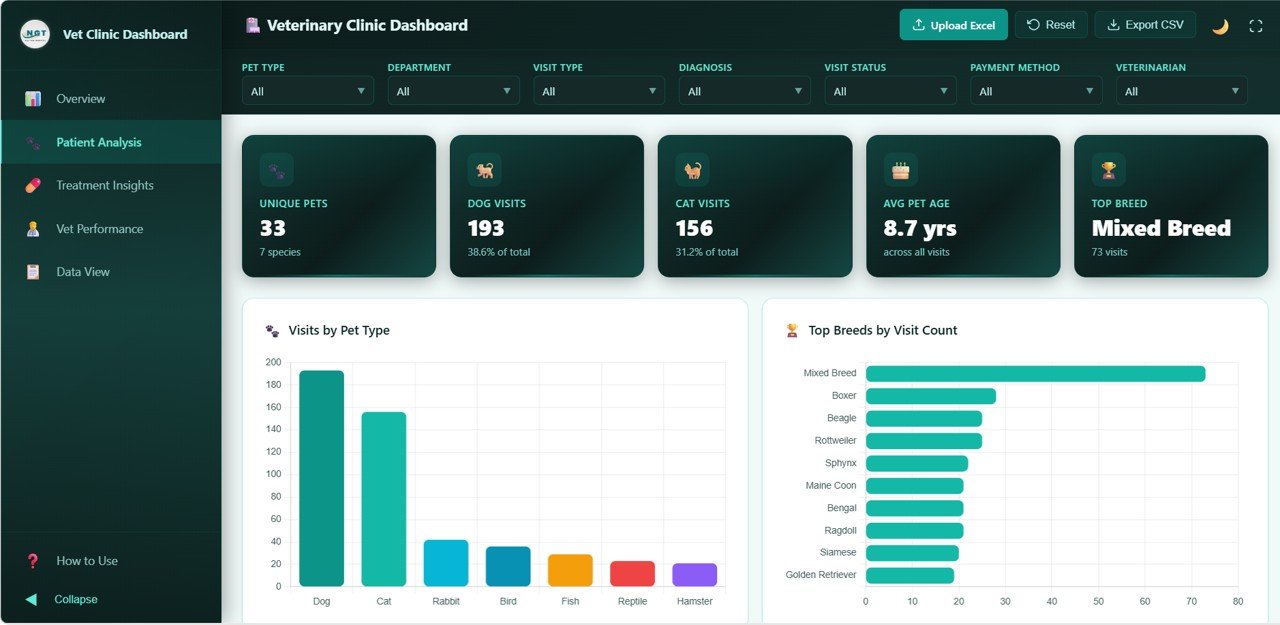
The Patient Analysis page gives you a demographic and behavioral view of your pet patients. You can study:
- Visits by Pet Type – the mix of dogs, cats, birds, and exotic pets in your patient base.
- Top Breeds by Visit Count – which breeds dominate your appointment book.
- Pet Age Distribution – how visits are spread across puppies, adults, and senior pets.
- Pet Type by Visit Type – which pets come in for checkups, emergencies, vaccinations, or surgeries.
- Diagnosis by Pet Type – correlation between species and typical conditions.
This page is useful for planning inventory, hiring specialists, targeting marketing campaigns, and stocking the right vaccines and medicines.
3. Treatment Insights
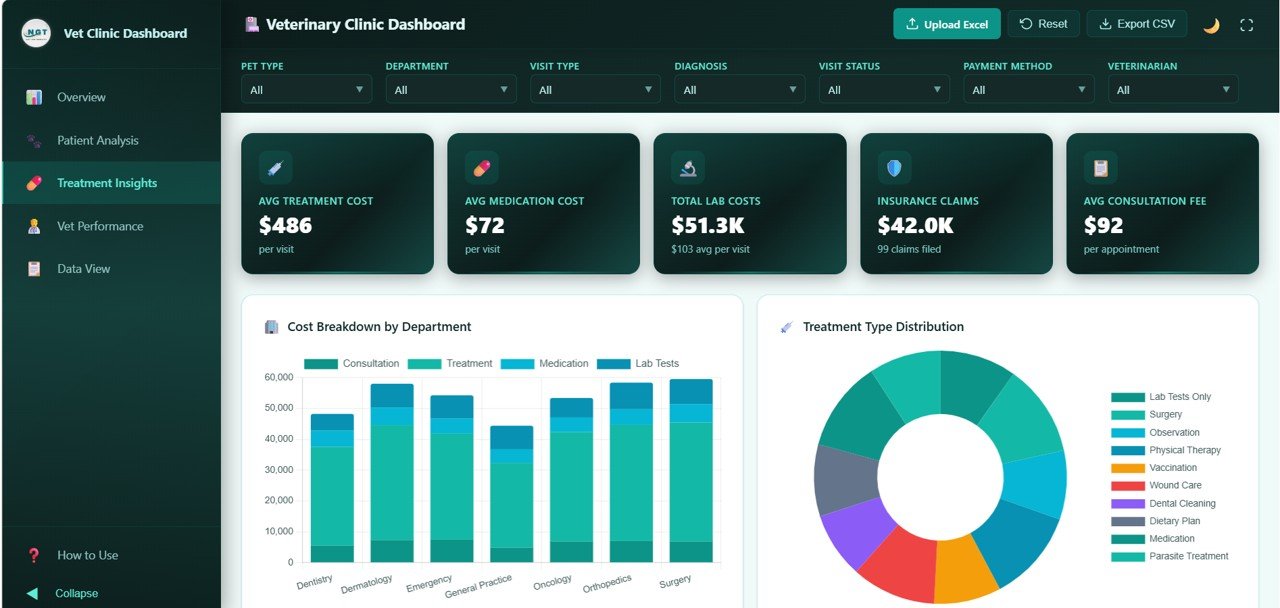
The Treatment Insights page blends clinical and financial analysis. The five charts on this page are:
- Cost Breakdown by Department – see where most of your clinic spending is absorbed.
- Treatment Type Distribution – quick view of what the clinic does most — consultations, surgeries, vaccinations, diagnostics, or dental.
- Diagnosis Category Distribution – top clinical categories being handled.
- Average Cost by Treatment Type – benchmark pricing across every treatment type.
- Payment Method Distribution – distribution of cash, card, insurance, and other payment methods.
This page helps practice managers understand cost-to-revenue ratios, set competitive pricing, and plan seasonal promotions.
4. Vet Performance
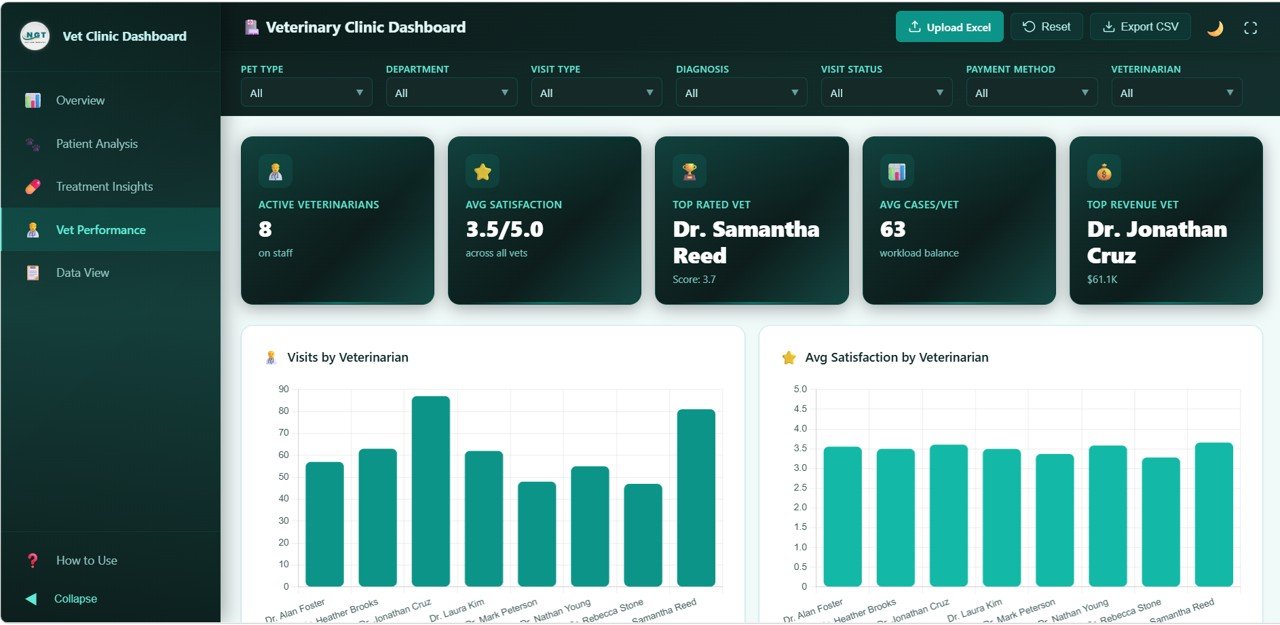
For multi-doctor clinics, the Vet Performance page is where the magic happens. It measures each veterinarian on five dimensions:
- Visits by Veterinarian – case volume handled per vet.
- Avg Satisfaction by Veterinarian – pet-owner satisfaction per vet.
- Revenue by Veterinarian – revenue contribution of each vet.
- Avg Visit Duration by Veterinarian – consultation efficiency.
- Department Distribution by Veterinarian – specialties each vet handles most.
Use this page for performance reviews, load balancing, and training decisions.
5. Data View
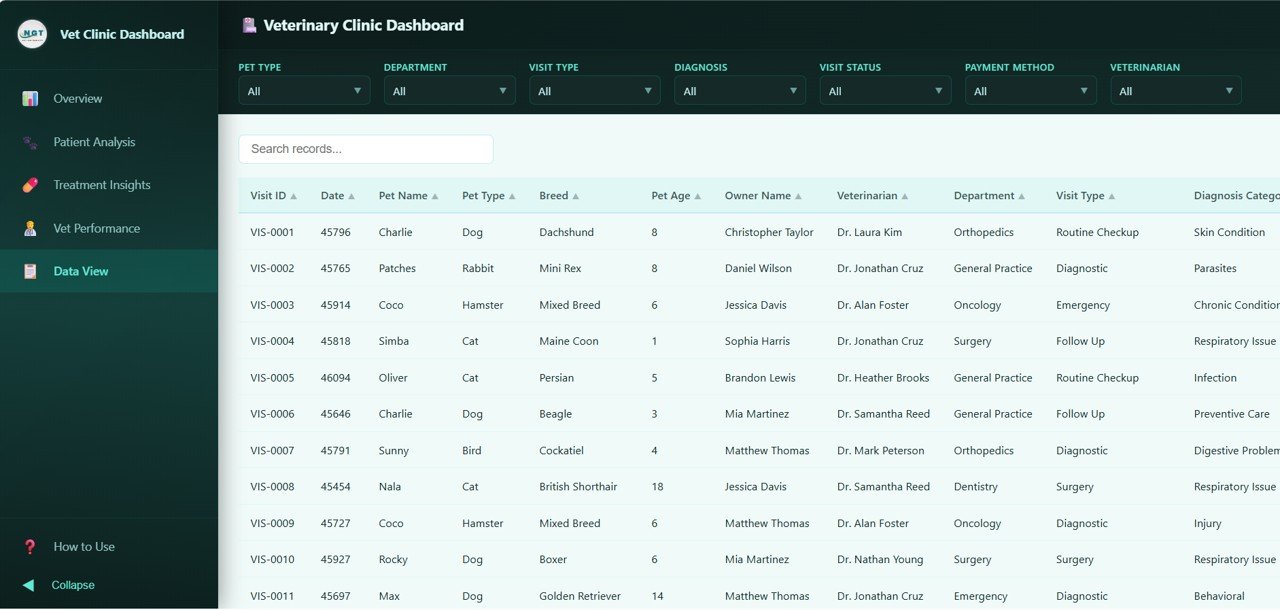
The Data View is a full record table. It includes a search box, column sorting, pagination, and a one-click CSV export. This makes it easy to audit individual visits, share a filtered dataset with an accountant, or pull data into another tool.
Advantages of Veterinary Clinic Dashboard in HTML
- Zero setup friction – no software to install, no subscriptions, no cloud logins.
- Portable – send it over email, host on your website, or run locally on a clinic laptop.
- Customizable – the underlying HTML, CSS, and JavaScript is editable; brand it with your clinic colors and logo.
- Mobile-friendly – the dashboard is usable on tablets at the front desk and phones on the move.
- Transparent data handling – your records stay local on your own machine or server, which is helpful for privacy-sensitive veterinary records.
- Cross-functional – owners, managers, vets, and accountants all get value from the same dashboard.
For related interactive dashboards, see our Event Management Analysis Dashboard in HTML and Warehouse Efficiency Dashboard in HTML tutorials.
Opportunities for Improvement
No dashboard is perfect. Here are honest areas where the Veterinary Clinic Dashboard in HTML can be extended further based on your clinic needs:
- Appointment scheduling – the dashboard is analytics-focused; you will still need a separate scheduling tool for booking appointments.
- Inventory and drug tracking – consider pairing it with a simple inventory sheet for medicine and consumables.
- Multi-branch support – if you operate more than one clinic, add a Branch column in the data and create a branch-level slicer.
- Automated data refresh – since the dashboard is static HTML, data refresh requires updating the included data file. For automatic syncing, you would need a lightweight backend or API.
Best Practices
- Keep data clean – standardize pet types, breeds, and diagnosis categories; messy inputs produce messy insights.
- Backup the data file regularly – even though the HTML is reusable, your clinic records are irreplaceable.
- Use slicers before reading KPIs – filter for the period or department that matters before drawing conclusions.
- Host internally for sensitive records – a secure intranet or a local share is safer than a public web host for patient data.
- Export to CSV monthly – this creates a time-stamped archive that is easy to audit and share with accountants.
For a broader view of how a dashboard strategy can boost a small business, explore our guide on NeoTechNavigators tutorials.
Explore Relevant Templates
- Veterinary Clinic Dashboard in Excel – same insights but built in Excel with pivot charts.
- Veterinary Clinic Dashboard in Google Sheets – cloud-based, shareable version.
- Veterinary Clinic Dashboard in Power BI – enterprise-level Power BI version with DAX measures.
- Veterinary Clinic KPI Scorecard in Excel – MTD and YTD scorecard for monthly reviews.
- Medical Practice Dashboard in Power BI – related healthcare dashboard for human practices.
Frequently Asked Questions
What is the Veterinary Clinic Dashboard in HTML?
The Veterinary Clinic Dashboard in HTML is an interactive, browser-based analytics template built with HTML, CSS, and JavaScript. It tracks visits, revenue, patient demographics, treatments, and veterinarian performance across 5 dedicated pages and runs in any modern browser.
How do I install the Veterinary Clinic Dashboard in HTML?
There is no installation. Simply unzip the downloaded package and double-click the index.html file. The dashboard opens instantly in your default browser.
What KPIs does the Veterinary Clinic Dashboard track?
It tracks 6 core KPIs — Total Visits, Total Revenue, Avg Bill Amount, Avg Satisfaction, Completed Rate, and Avg Visit Duration — along with 20+ charts for pet analytics, treatment insights, and vet performance.
Can I customize the Veterinary Clinic Dashboard in HTML?
Yes. Because the source code is plain HTML, CSS, and JavaScript, you can change colors, add your clinic logo, tweak chart types, or add new sections. Basic web development skills are enough for most customizations.
Is the Veterinary Clinic Dashboard in HTML suitable for multi-vet clinics?
Yes. The dedicated Vet Performance page compares each veterinarian on visits, satisfaction, revenue, visit duration, and department specialization, which makes it ideal for clinics with multiple doctors.
Where can I buy the Veterinary Clinic Dashboard in HTML?
You can purchase it directly on NextGenTemplates.com. The download is delivered as a zip file containing the HTML file and a sample data file.
Conclusion
The Veterinary Clinic Dashboard in HTML is a simple, elegant, and powerful way to turn raw clinic data into clear, actionable insight. Whether you are a single-vet clinic owner or manage a multi-doctor animal hospital, this dashboard gives you the metrics you need — visits, revenue, satisfaction, patient mix, treatment costs, and veterinarian performance — in a browser-based format that is lightweight, portable, and easy to share.
👉 Click here to Purchase the Veterinary Clinic Dashboard in HTML
For step-by-step video tutorials on dashboards, HTML templates, and Google Sheets automation, subscribe to our YouTube channel: Youtube.com/@NeoTechNavigators.