Real Estate Agent Dashboard in HTML is a comprehensive, browser-based analytics template built for real estate professionals who want to track agent performance, monitor commissions, analyze market dynamics, and identify sales trends — all without installing any software. This interactive dashboard from NextGenTemplates includes 5 dedicated pages covering everything from high-level KPI overviews to a full data table with export capability. Whether you manage a single real estate portfolio or oversee a brokerage with multiple agents, this dashboard gives you the visual insights you need to make data-driven decisions and close more deals.
Key Features of Real Estate Agent Dashboard in HTML
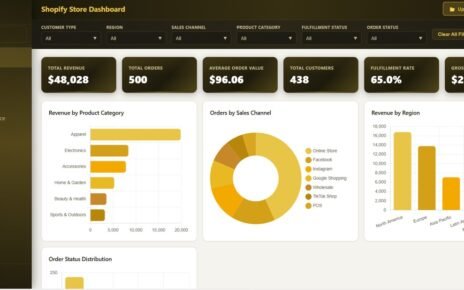
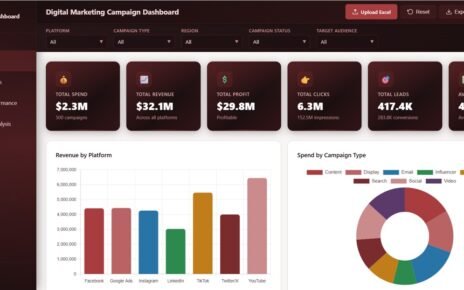
This HTML dashboard template is designed to be lightweight, fast, and easy to use. Here are the standout features that make it an essential tool for real estate professionals:Real Estate Agent Dashboard in HTML
- 5 Interactive Dashboard Pages — Overview, Agent Performance, Market Analysis, Sales Trends, and Data View, each focused on a different aspect of your real estate business.
- 6 Key Performance Indicators — Total Transactions, Total Sale Price, Total Commission, Average Sale Price, Average Days On Market, and Average Client Satisfaction displayed as interactive KPI cards.
- Interactive Slicers and Filters — Filter the entire dashboard by region, property type, listing status, lead source, and time period to see exactly the data you need.
- Agent-Level Performance Comparison — Compare commission earnings, client satisfaction ratings, transaction counts, and sold ratios across all agents on your team.
- Market-Level Analysis — Analyze pricing trends by city, neighborhood transaction volumes, and listing price versus sale price comparisons.
- Data Export — The Data View page supports search, sort, pagination, and one-click CSV export for sharing with stakeholders.
- No Installation Required — Opens directly in any modern web browser including Chrome, Edge, Firefox, and Safari.Real Estate Agent Dashboard in HTML
Dashboard Pages Explained
1. Overview Page
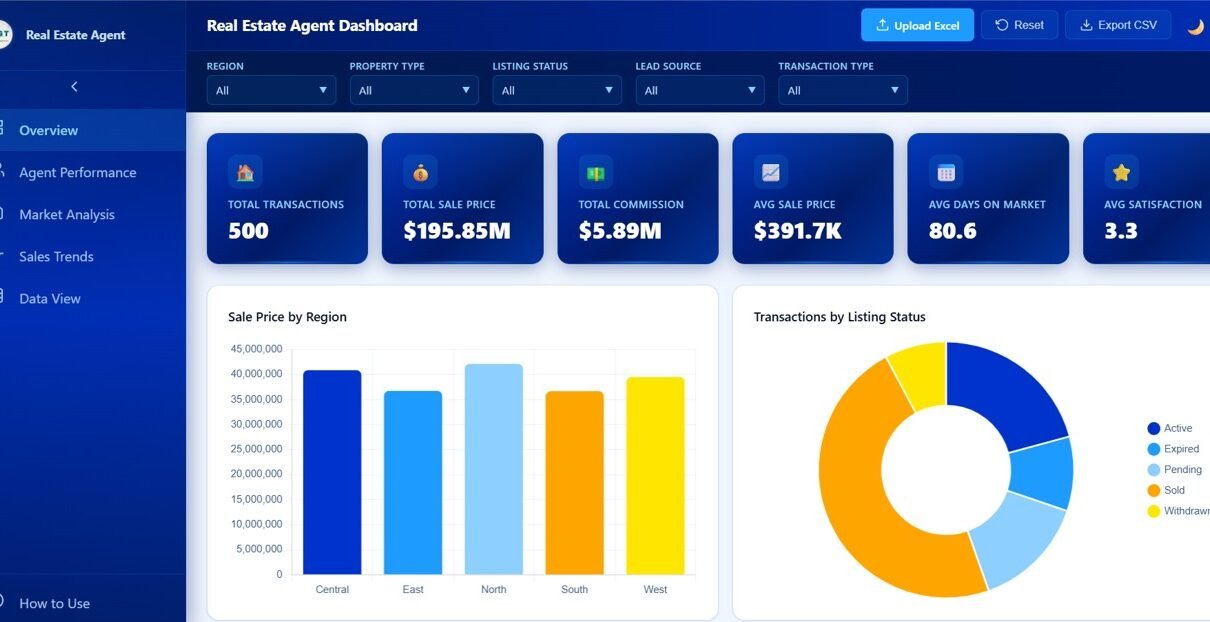
The Overview page serves as the command center of your real estate analytics. At the top, you will find 6 KPI cards displaying Total Transactions, Total Sale Price, Total Commission, Average Sale Price, Average Days On Market, and Average Client Satisfaction. Below the cards, interactive charts provide visual analysis including Sale Price by Region, Transactions by Listing Status, Commission by Property Type, Transactions by Lead Source, and Monthly Sale Price Trend. Multiple slicers allow you to filter all charts and KPIs simultaneously for rapid drill-down analysis.
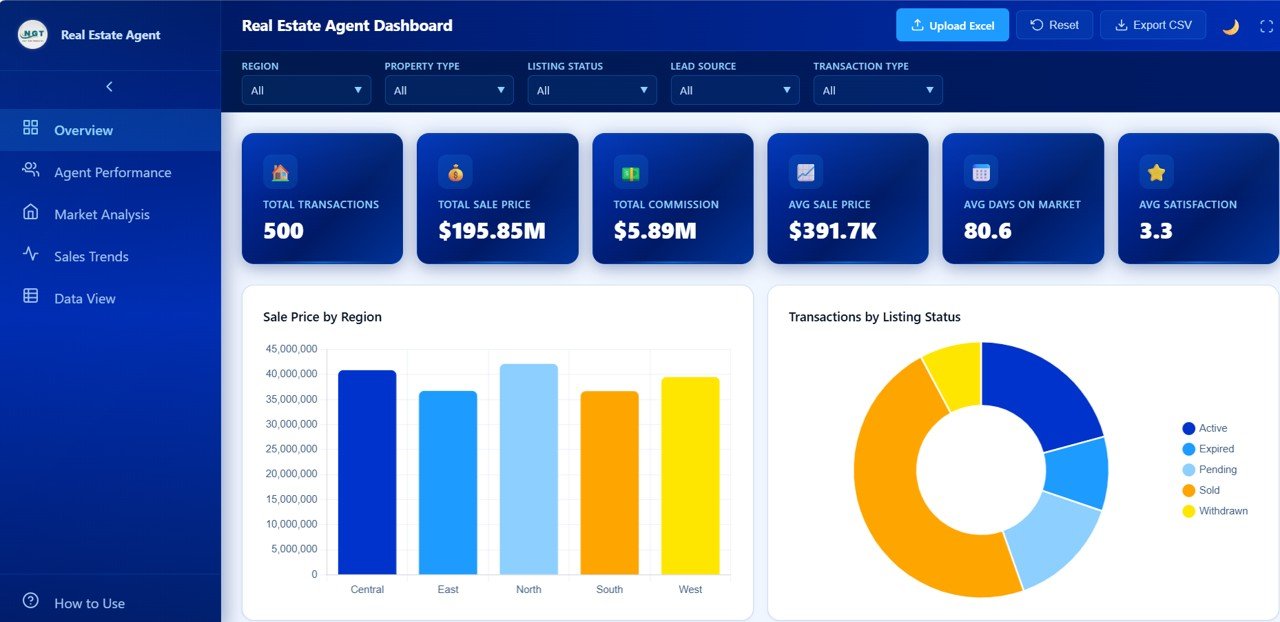
Real Estate Agent Overview
2. Agent Performance
The Agent Performance page focuses on individual agent metrics, making it easy to identify top performers and coaching opportunities. This page includes charts for Total Commission by Agent, Average Client Satisfaction by Agent, Average Days On Market by Agent, Transactions by Agent, and Sold Ratio by Agent. Brokerage managers can use this page to run performance reviews, set incentive targets, and allocate leads strategically based on each agent’s strengths.Real Estate Agent Dashboard in HTML
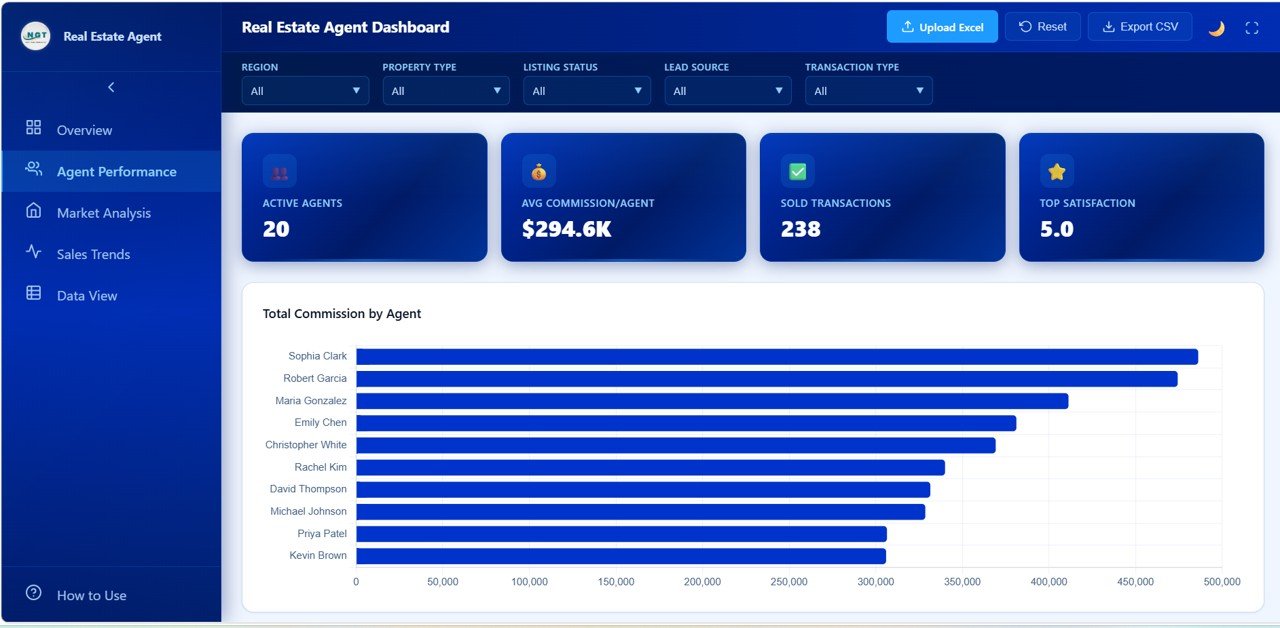
Agent Performance
3. Market Analysis
The Market Analysis page delivers location-based insights that help agents and brokerages understand where the opportunities are. Charts include Average Sale Price by City, Transactions by Neighborhood, Average Price by Property Type, Days On Market by Region, and Listing Price vs Sale Price by City. This page is invaluable for pricing strategy, territory planning, and identifying underserved neighborhoods with high transaction potential.Real Estate Agent Dashboard in HTML
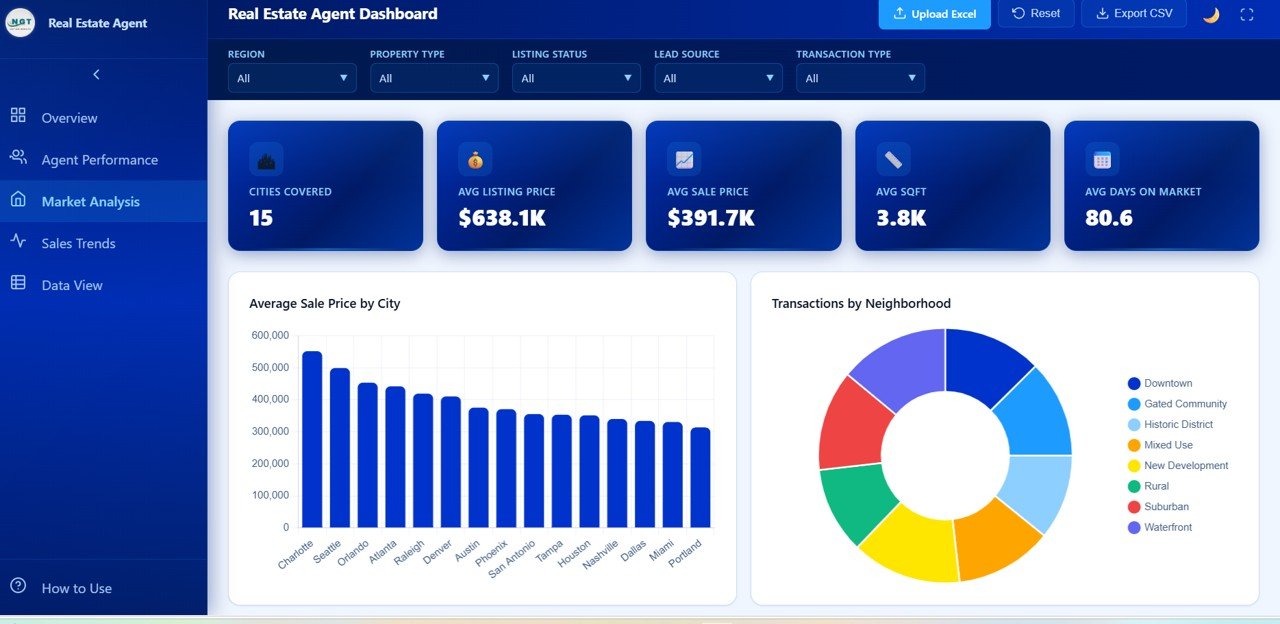
Market Analysis
4. Sales Trends
The Sales Trends page reveals time-based patterns in your real estate data. It includes Monthly Commission Trend, Monthly Transactions by Year, Average Days On Market by Month, Sale Price by Transaction Type, and Commission by Year. Use this page to spot seasonal patterns, evaluate year-over-year growth, and forecast future performance based on historical trends.
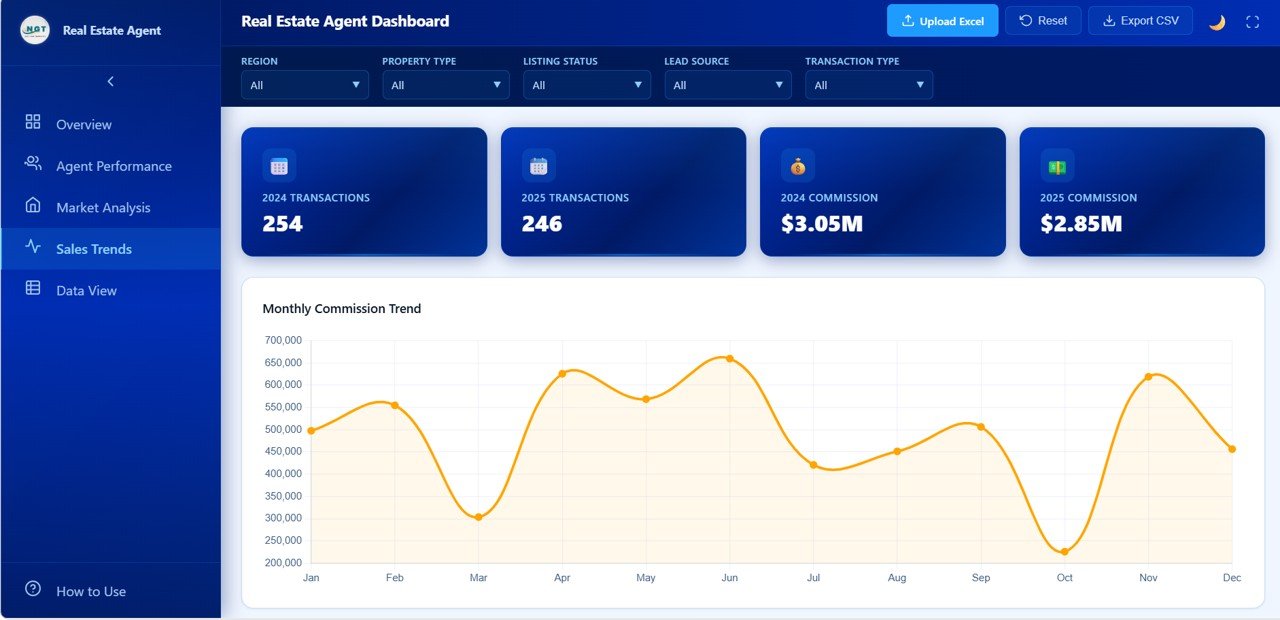
Sales Trends
5. Data View
The Data View page is a detailed data table showing all individual transaction records. It supports full-text search, column sorting, pagination for easy navigation, and one-click CSV export. This is perfect for when you need to look up a specific transaction, verify data points, or share raw data with your accounting or compliance team.
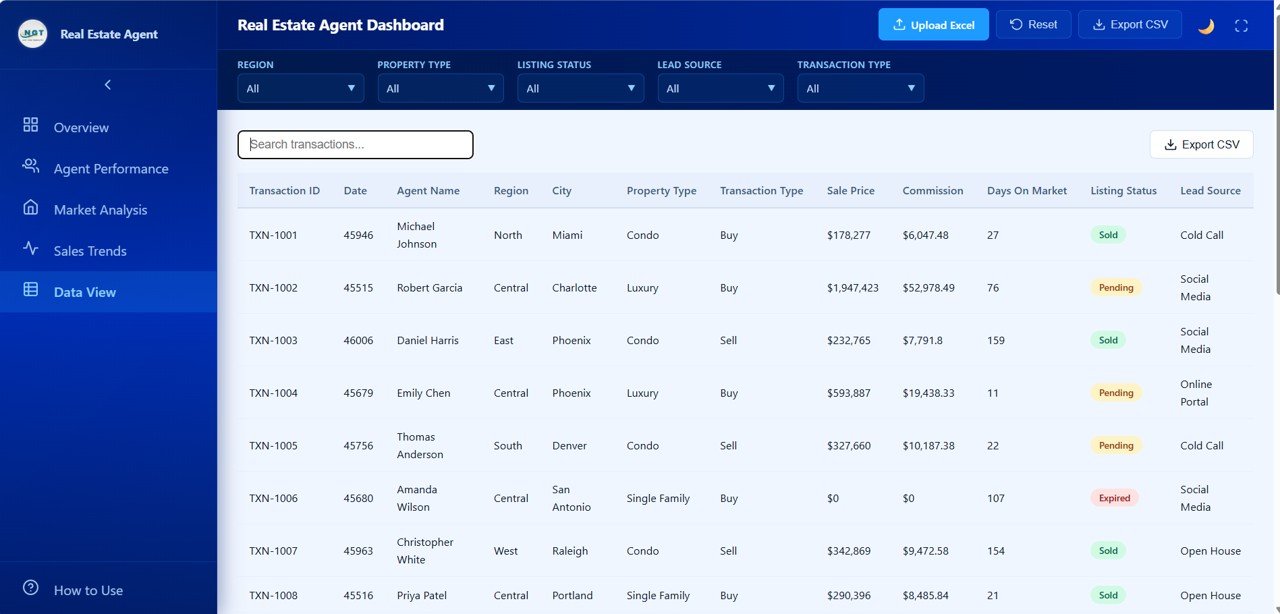
Data View
Advantages of Real Estate Agent Dashboard in HTML
- Zero Software Dependencies — Unlike Excel or Power BI dashboards, this HTML template runs entirely in a web browser. No licenses, no installations, no compatibility issues.
- Fast and Lightweight — HTML dashboards load instantly and perform smoothly even with large datasets, making them ideal for daily use.
- Easy Data Replacement — Simply swap the sample data file with your own transaction records and all charts, KPIs, and tables update automatically.
- Professional Presentation-Ready Design — The clean, modern layout is perfect for team meetings, client presentations, and management reporting.
- Complete Agent Analytics — Few templates offer dedicated agent-level comparison with commission tracking, satisfaction scores, and sold ratios in a single view.
Opportunities for Improvement
- Adding a client relationship management (CRM) view linking clients to specific agents and properties would enhance lead tracking.
- A geographic map visualization showing property locations and pricing heatmaps would add spatial context to the market analysis.
- Goal-tracking widgets comparing actual performance against quarterly targets would make the agent performance page even more actionable.
- Integration with live MLS data feeds would allow automatic data updates without manual file replacement.
Best Practices for Using This Dashboard
- Update data weekly — Replace the data file at least once a week to keep your KPIs and trend charts current and actionable.
- Use slicers strategically — Filter by specific regions or time periods when presenting to different stakeholders who care about different segments.
- Benchmark agent performance monthly — Use the Agent Performance page to run structured monthly reviews comparing each agent against team averages.
- Export data for deep analysis — Use the CSV export feature on the Data View page when you need to run custom calculations or share data with external tools.
- Pair with other real estate templates — Combine this dashboard with the Rental Property Investment Dashboard in HTML for a complete analytics suite covering both sales and investment properties.
Explore Relevant Templates
If you found this dashboard useful, check out these related templates from NextGenTemplates:
- Real Estate Dashboard in HTML — Broader real estate analytics covering property listings, pricing trends, and market overview.
- Rental Property Investment Dashboard in HTML — Track rental income, expenses, occupancy rates, and ROI for investment properties.
- Construction Dashboard in HTML — Monitor construction project progress, budgets, and contractor performance.
- Hospitality Dashboard in HTML — Analyze hotel occupancy, revenue per room, and guest satisfaction metrics.
Browse the full collection of HTML Dashboard Templates at NextGenTemplates.
Frequently Asked Questions
What KPIs does the Real Estate Agent Dashboard in HTML track?
The dashboard tracks 6 key performance indicators: Total Transactions, Total Sale Price, Total Commission, Average Sale Price, Average Days On Market, and Average Client Satisfaction. These are displayed as interactive KPI cards on the Overview page and analyzed across multiple dimensions on the other 4 pages.
Do I need any coding skills to use this HTML dashboard?
No. Simply download and unzip the file, then open index.html in any modern web browser like Chrome, Edge, or Firefox. Replace the sample data with your own records and all charts and KPIs update automatically. No programming or coding knowledge is required.
Can I compare individual real estate agent performance with this template?
Yes. The dedicated Agent Performance page provides side-by-side comparisons of all agents across 5 metrics: Total Commission, Average Client Satisfaction, Average Days On Market, Transactions Count, and Sold Ratio. This makes it easy to identify top performers and areas needing improvement.
What is the best dashboard template for tracking real estate agent commissions?
The Real Estate Agent Dashboard in HTML by NextGenTemplates is specifically designed for commission tracking. It displays Total Commission as a KPI card, breaks down Commission by Property Type, shows commission trends monthly and yearly, and provides agent-level commission comparisons — all in a single browser-based template.
How do I replace the sample data with my own real estate data?
Open the data file included in the download package, replace the sample records with your own transaction data following the same column structure, save the file, and refresh the dashboard in your browser. All charts, KPIs, and tables will reflect your data instantly.
Can I export data from this HTML dashboard?
Yes. The Data View page includes a built-in CSV export feature. You can search, filter, and sort data in the table, then click the export button to download the filtered dataset as a CSV file for use in Excel, Google Sheets, or any other analytics tool.
Conclusion
The Real Estate Agent Dashboard in HTML is a must-have analytics tool for any real estate professional looking to track performance, understand market dynamics, and make smarter business decisions. With 5 interactive pages, 6 KPI cards, powerful filtering, and CSV export capabilities, this template covers every aspect of real estate agent analytics in a clean, browser-based format. No software installation needed — just open, replace data, and start analyzing.
🛒 Click here to Purchase Real Estate Agent Dashboard in HTML
🎥 Visit our YouTube channel for step-by-step tutorials: Youtube.com/@NeoTechNavigators