The Digital Marketing Campaign Dashboard in Google Sheets is a powerful, ready-to-use analytics template that helps marketing professionals track campaign performance, measure ROI, and optimize budget allocation — all from a single Google Sheets workbook. Whether you run paid search, social media ads, email campaigns, or SEO initiatives, this dashboard brings all your marketing data together into 6 interactive pages with 12+ dynamic charts, 5 KPI cards, interactive slicers, and a campaign search tool. It is one of the most comprehensive Google Sheets marketing dashboard templates available for digital marketing teams.Digital Marketing Campaign Dashboard in Google Sheets
👉 Click here to Purchase Digital Marketing Campaign Dashboard in Google Sheets
Key Features of the Digital Marketing Campaign Dashboard in Google Sheets
This template is designed for marketers who want actionable insights without complex setup. Here are the standout features that make this dashboard a must-have for any digital marketing team:
- 6 Interactive Dashboard Pages — Overview, Channel Analysis, Campaign Performance, ROI & Budget, Search, and Data Sheet covering every aspect of campaign analytics
- 5 KPI Cards — Total Campaigns, Total Spend, Total Revenue, Total Conversions, and Average ROAS displayed prominently for quick decision-making
- 12+ Dynamic Charts — Visual analysis including Spend by Channel, Monthly Revenue Trends, ROAS Cumulative Trend, Conversions by Audience, and more
- Interactive Slicers — Filter all dashboard pages by Channel, Region, Campaign Type, Status, or Time Period with a single click
- Campaign Search Tool — Look up any campaign by ID and instantly view all 17 data fields including ROAS, CTR, CPC, CPM, and Status
- Multi-Channel Support — Track Google Ads, Facebook, Instagram, LinkedIn, Email, SEO, and any other marketing channel in one unified view
- Auto-Updating — Replace sample data with your own campaign records and every chart, card, and slicer refreshes automatically
- Cloud-Based Access — Works in Google Sheets with real-time collaboration, sharing, and access from any device
Dashboard Pages Explanation
1. Overview Page
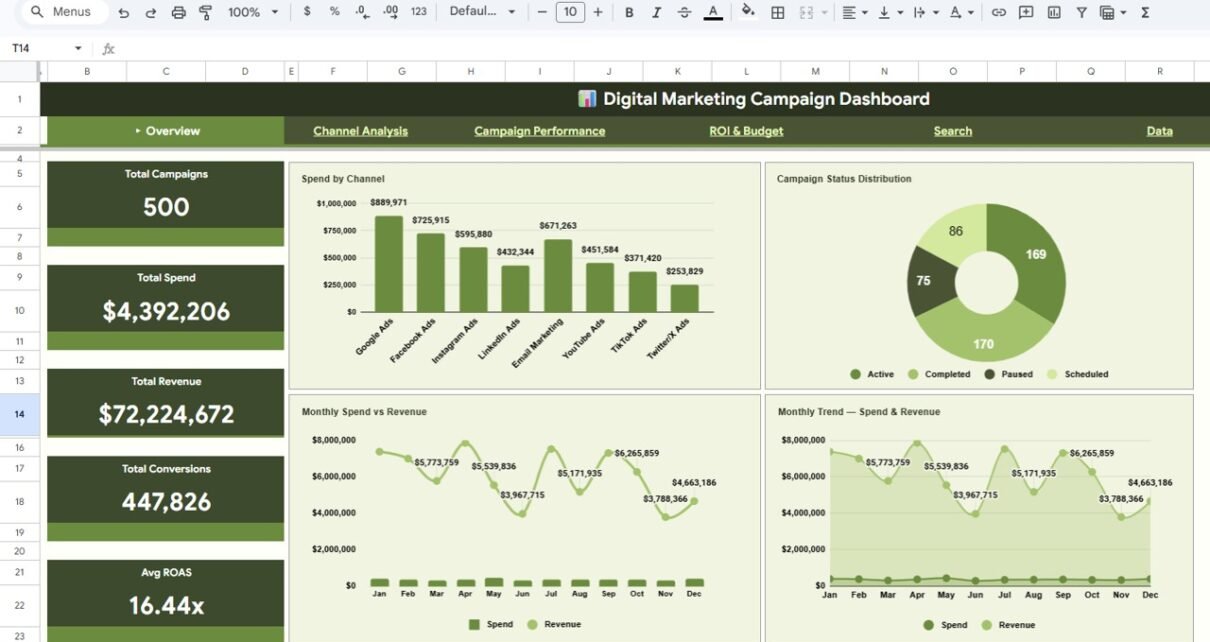
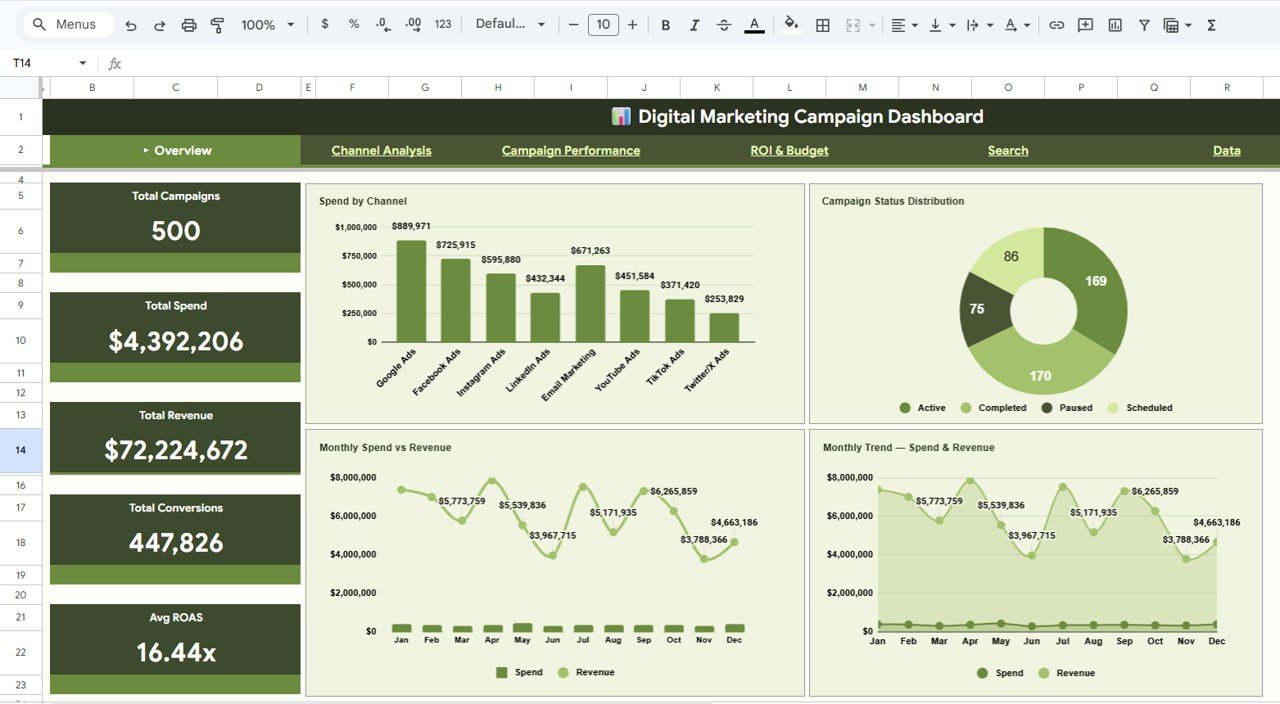
The Overview page serves as the command center of the Digital Marketing Campaign Dashboard in Google Sheets. At the top, you will find 5 high-level KPI cards that instantly show Total Campaigns, Total Spend, Total Revenue, Total Conversions, and Average ROAS. Below the cards, interactive charts provide visual breakdowns of your marketing data. The Spend by Channel chart reveals how your budget is distributed across marketing platforms. The Campaign Status Distribution chart shows how many campaigns are active, paused, or completed. The Monthly Spend vs Revenue chart compares your investment against returns over time, while the Monthly Trend for Spend and Revenue tracks spending and revenue patterns across months. Multiple slicers on this page let you filter the entire dashboard by channel, region, campaign type, or status for focused analysis.Digital Marketing Campaign Dashboard in Google Sheets
Digital Marketing Campaign Dashboard in Google Sheets
2. Channel Analysis
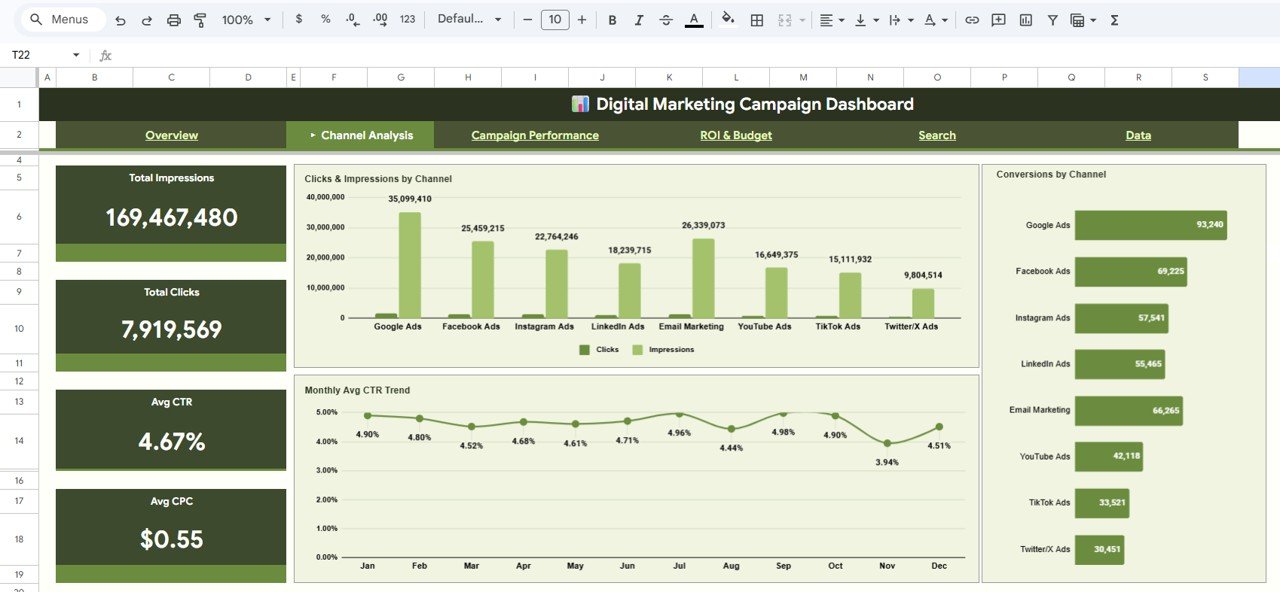
The Channel Analysis page provides a deep-dive into how each marketing channel performs. The Clicks and Impressions by Channel chart compares engagement volume across platforms like Google Ads, Facebook, Instagram, LinkedIn, and Email. The Monthly Avg CTR Trend chart tracks click-through rate patterns over time, helping you spot seasonal trends or declining engagement. The Conversions by Channel chart shows which channels actually drive conversions, enabling smarter budget reallocation. This page is especially useful for identifying underperforming channels and doubling down on high-converting ones.
Channel Analysis
3. Campaign Performance
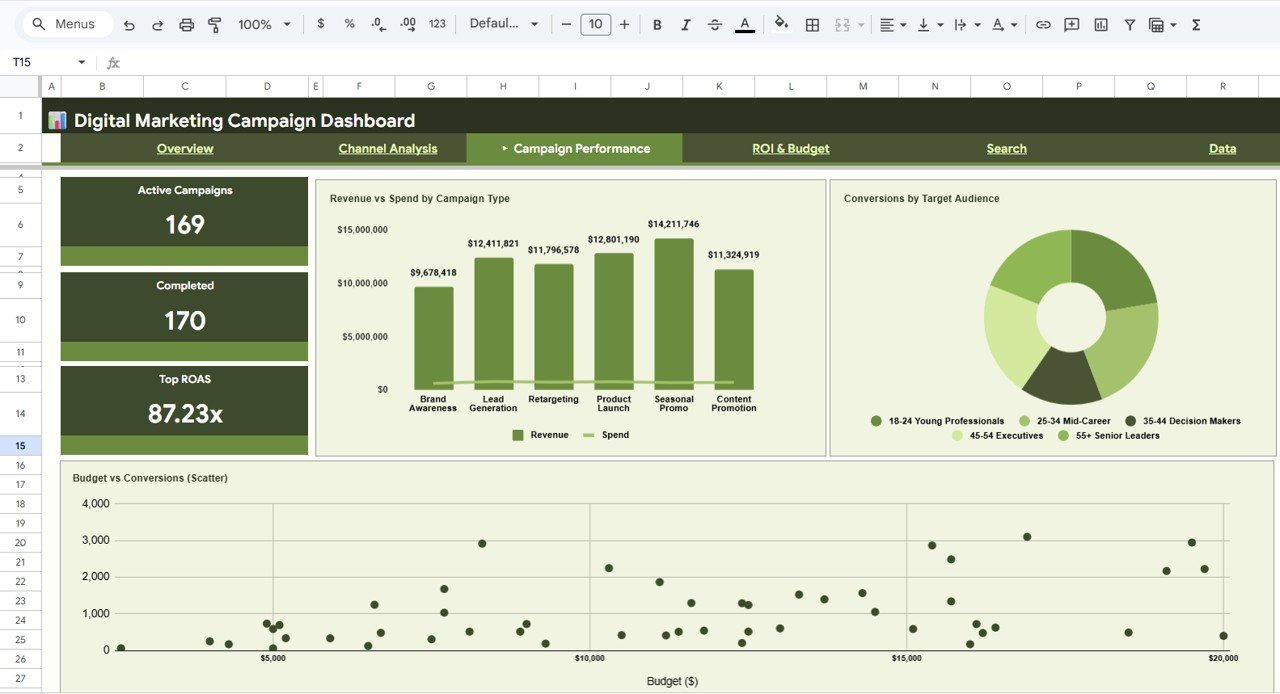
The Campaign Performance page focuses on individual campaign effectiveness and audience targeting. The Revenue vs Spend by Campaign Type chart shows which campaign strategies — such as brand awareness, lead generation, or retargeting — deliver the best return. The Conversions by Target Audience chart reveals which demographic segments respond most to your marketing efforts. The Budget vs Conversions chart helps you evaluate whether higher budget allocations translate into proportionally higher conversions. Together, these visuals guide strategic decisions about campaign types and audience targeting.Digital Marketing Campaign Dashboard in Google Sheets
Campaign Performance
4. ROI and Budget
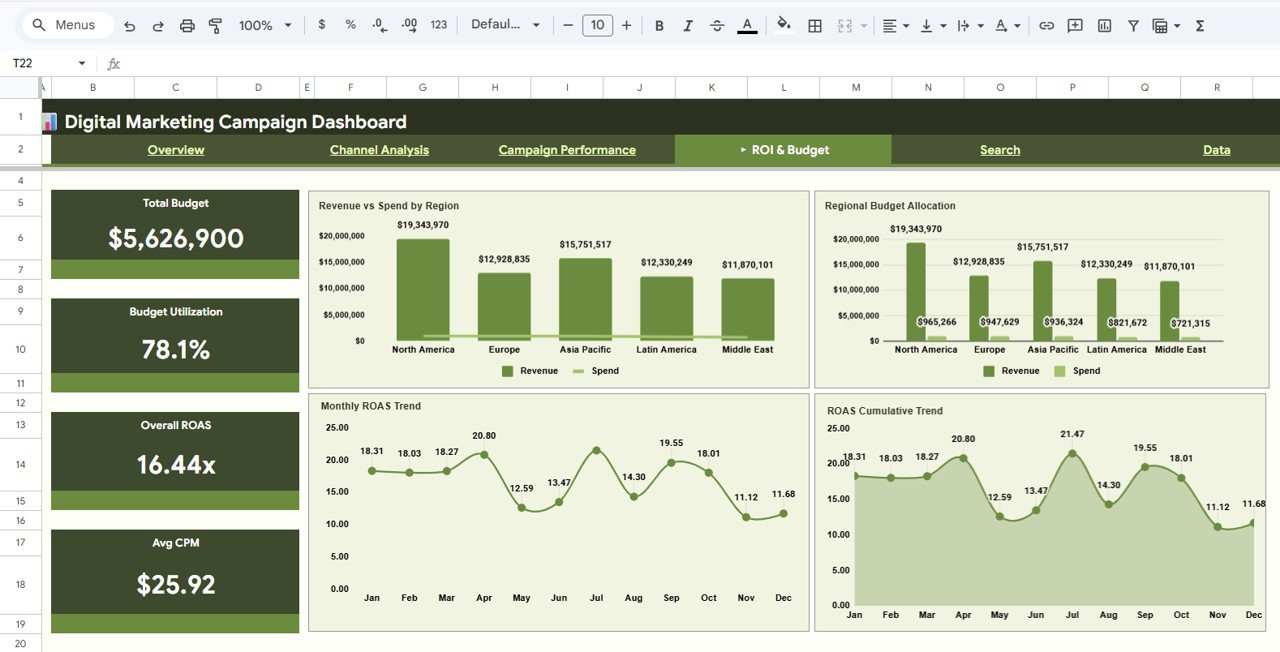
The ROI and Budget page gives you a complete picture of return on ad spend and regional budget efficiency. The Revenue vs Spend by Region chart compares marketing investment against returns across different geographies. The Regional Budget Allocation chart shows how your total marketing budget is split across regions. The Monthly ROAS Trend chart tracks how your return on ad spend evolves month over month, while the ROAS Cumulative Trend provides a running total view of ROAS performance over time. This page is critical for finance-minded marketers who need to justify ad spend and optimize regional allocation.
ROI and Budget
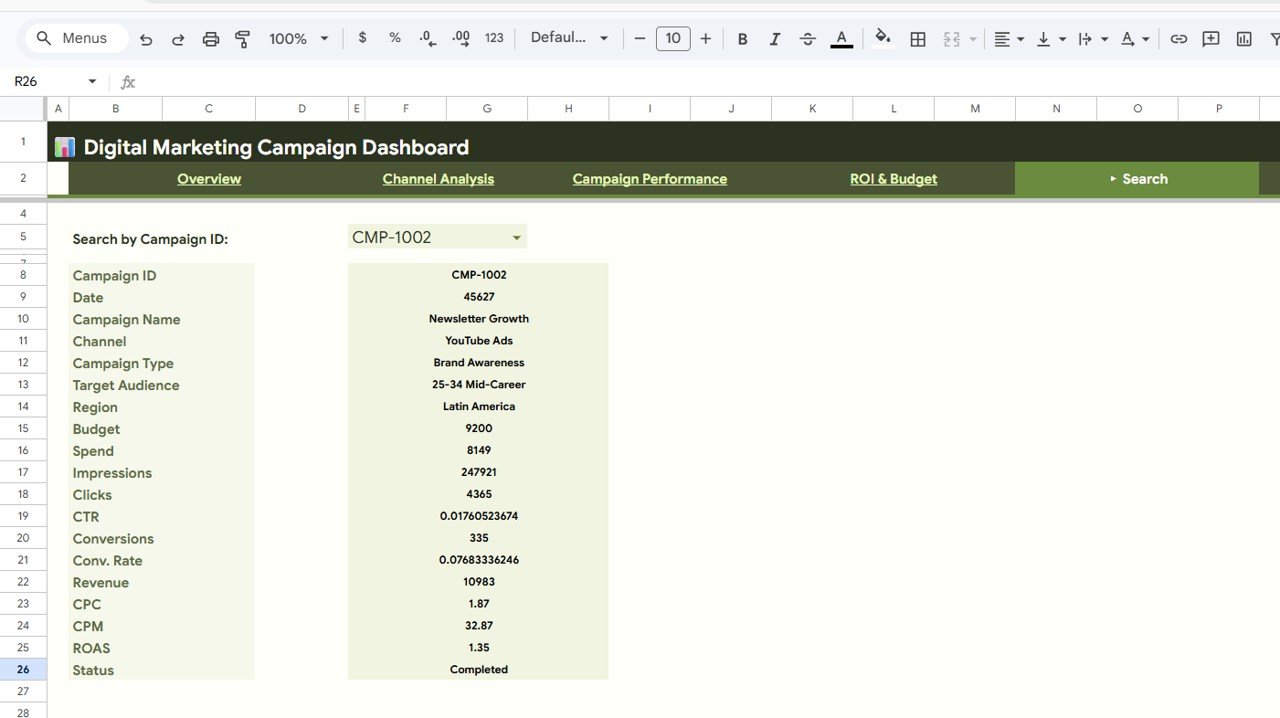
5. Search Sheet
The Search sheet is a quick-reference lookup tool that lets you find any campaign by its Campaign ID using a dropdown selector. Once you select a Campaign ID, it immediately displays all 17 data fields for that campaign including Campaign Name, Channel, Campaign Type, Target Audience, Region, Budget, Spend, Impressions, Clicks, CTR, Conversions, Conv. Rate, Revenue, CPC, CPM, ROAS, and Status. This is extremely useful when you need to quickly pull up details for a specific campaign during meetings or reporting.
Search Sheet
6. Data Sheet
The Data sheet is the foundation of the entire dashboard. This is where you add your campaign records in a structured format. Each row represents one campaign with fields for Campaign ID, Campaign Name, Channel, Campaign Type, Target Audience, Region, Budget, Spend, Impressions, Clicks, CTR, Conversions, Conv. Rate, Revenue, CPC, CPM, ROAS, and Status. Simply replace the sample data with your own campaign information and every dashboard page will auto-update.Digital Marketing Campaign Dashboard in Google Sheets
Data Sheet
Advantages of the Digital Marketing Campaign Dashboard in Google Sheets
👉 Click here to Purchase Digital Marketing Campaign Dashboard in Google Sheets
- Unified Multi-Channel View — Instead of switching between Google Analytics, Facebook Ads Manager, and email platforms, consolidate all campaign data in one place for a holistic view of marketing performance.
- Zero Setup Time — The dashboard comes pre-built with charts, formulas, KPI cards, and slicers. No need to create anything from scratch — just add your data and start analyzing.
- Cloud-Based Collaboration — Being in Google Sheets means your team can access, edit, and share the dashboard from anywhere. Perfect for remote marketing teams and agency-client collaboration.
- Budget Optimization Insights — The ROI and Budget page with regional allocation and ROAS trends helps you redirect budget from underperforming regions and channels to high-converting ones.
- Professional Reporting — The multi-page layout with clean charts and KPI cards creates presentation-ready reports for stakeholders, clients, or management reviews.
Opportunities for Improvement
- Custom Date Range Filtering — Adding a date range slicer with start and end date pickers would give users more granular control over the reporting period beyond monthly views.
- Automated Data Import — Integrating Google Sheets API connections to pull data directly from Google Ads, Facebook Ads, or other platforms would eliminate manual data entry.
- Goal Tracking — Adding target vs actual comparisons for KPIs like ROAS, conversion rate, and spend would help teams measure progress against predefined goals.
- Funnel Visualization — A marketing funnel chart showing the progression from impressions to clicks to conversions would add valuable context to the conversion analysis.
Best Practices for Using This Dashboard
👉 Click here to Purchase Digital Marketing Campaign Dashboard in Google Sheets
- Update Data Weekly — For the most accurate insights, refresh your campaign data at least once a week. Consistent data entry ensures your trend charts remain meaningful.
- Use Consistent Channel Names — Maintain standardized naming conventions for channels (e.g., always “Google Ads” instead of mixing “Google”, “Ads”, “SEM”) so charts aggregate correctly.
- Review ROAS Trends Monthly — The cumulative ROAS trend is your most powerful metric for long-term budget justification. Use it in monthly marketing reviews to demonstrate marketing efficiency.
- Leverage the Search Sheet for Quick Audits — When a specific campaign underperforms, use the Search sheet to pull up all its details instantly rather than scrolling through the data sheet.
- Compare Across Dimensions — Use slicers to compare performance by channel, then by region, then by campaign type. Cross-dimensional analysis often reveals insights that single-view charts miss.
Explore Relevant Templates
If you found this Digital Marketing Campaign Dashboard useful, explore these related templates on NextGenTemplates:
- Digital Marketing Campaign Dashboard in Excel — The Excel version with pivot tables and slicers for desktop analysis.
- Digital Marketing Campaign Dashboard in Power BI — Advanced Power BI version with drill-through pages and interactive filtering.
- SaaS Metrics Dashboard in Google Sheets — Track MRR, churn, LTV, and CAC for SaaS businesses.
- Etsy Seller Analytics Dashboard in Google Sheets — Monitor Etsy shop performance with revenue, orders, and conversion tracking.
- Freelancer Business Dashboard in Google Sheets — Track freelance income, clients, projects, and profitability.
Also check out our complete collection of Google Sheets tutorials and templates for more dashboard ideas. You may also like the Marketing Funnel and Conversion Dashboard in Google Sheets and the PPC Campaign KPI Dashboard in Google Sheets for specialized marketing analytics.
Frequently Asked Questions
👉 Click here to Purchase Digital Marketing Campaign Dashboard in Google Sheets
What is the best Google Sheets template for tracking digital marketing campaigns?
The Digital Marketing Campaign Dashboard in Google Sheets from NextGenTemplates is one of the most comprehensive options available. It includes 6 interactive pages with 5 KPI cards, 12+ charts, interactive slicers, a campaign search tool, and a structured data sheet that covers all essential metrics including ROAS, CTR, CPC, conversions, and budget allocation across channels and regions.
How do I use a digital marketing dashboard in Google Sheets?
Open the PDF guide included in your download and click the Google Sheets copy link to create your editable copy. Navigate to the Data sheet, replace the sample data with your campaign records keeping the same column format, and all 6 dashboard pages will auto-update with your data. Use slicers on each page to filter by channel, region, campaign type, or status.
Can I track multiple marketing channels in one Google Sheets dashboard?
Yes. The Digital Marketing Campaign Dashboard supports all marketing channels including Google Ads, Facebook, Instagram, LinkedIn, Email, SEO, and any other channel. The Channel Analysis page provides dedicated charts comparing clicks, impressions, CTR, and conversions across channels so you can identify which platforms deliver the best results.
What KPIs does this digital marketing dashboard track?
The dashboard tracks 5 primary KPIs — Total Campaigns, Total Spend, Total Revenue, Total Conversions, and Average ROAS. It also provides detailed metrics including CTR, CPC, CPM, Conversion Rate, Impressions, Clicks, Budget, and Status across channels, regions, campaign types, and target audiences.
Is this template suitable for marketing agencies?
Absolutely. Marketing agencies can use this dashboard to generate professional campaign performance reports for clients. The multi-page layout covering Overview, Channel Analysis, Campaign Performance, and ROI pages provides a complete performance narrative. The cloud-based Google Sheets format also makes it easy to share dashboards with clients directly.
Do I need advanced Google Sheets skills to use this dashboard?
No. The template is completely pre-built with all charts, formulas, KPI cards, and slicers. You only need to replace the sample data in the Data sheet with your own campaign records. No formulas to write, no charts to create — everything updates automatically.
Conclusion
The Digital Marketing Campaign Dashboard in Google Sheets is a complete solution for marketing professionals who need to track, analyze, and report on campaign performance across multiple channels. With 6 interactive pages, 5 KPI cards, 12+ dynamic charts, interactive slicers, and a campaign search tool, this template eliminates hours of manual reporting and gives you instant visibility into your marketing ROI. Whether you are a solo marketer, a startup founder, or an agency managing multiple client campaigns, this dashboard adapts to your needs with zero setup required.
👉 Click here to Purchase Digital Marketing Campaign Dashboard in Google Sheets
🎥 Visit our YouTube channel for step-by-step video tutorials: Youtube.com/@NeoTechNavigators