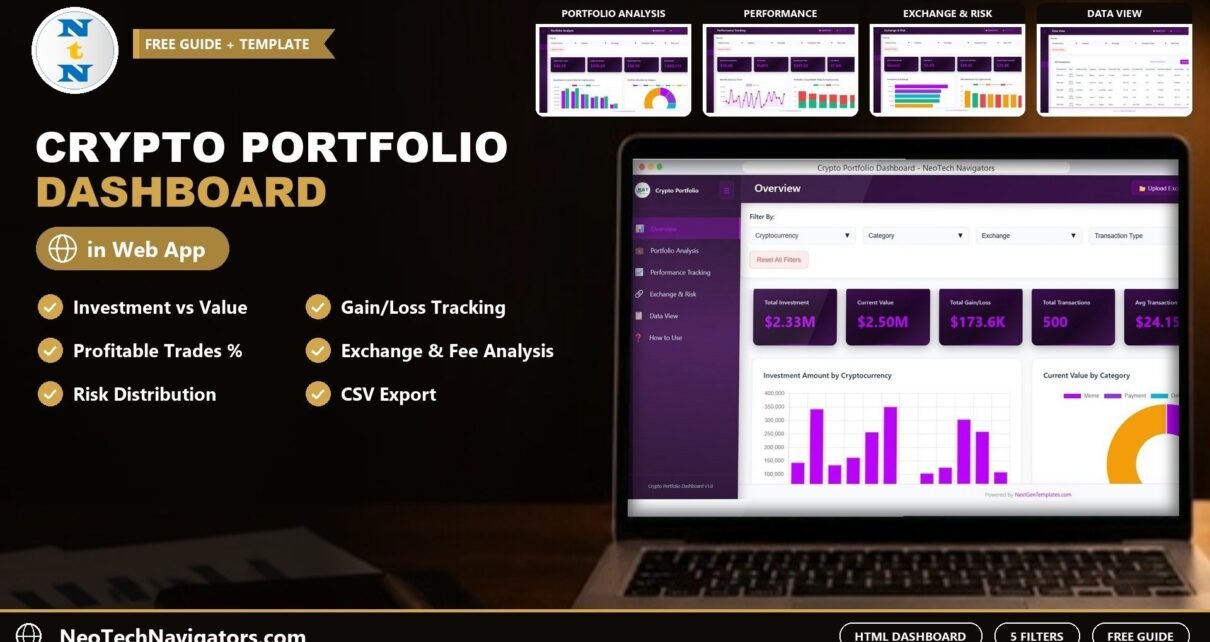
The Crypto Portfolio Dashboard in HTML is a browser-based dashboard for keeping track of your cryptocurrency transactions. It shows what you invested, what those holdings are worth now, your total gain or loss, trading fees and how many trades were profitable, all from one page that opens in Chrome, Edge or Firefox without installing anything.
It is meant for individual crypto holders, active traders and small fund or club treasurers who keep a transaction log and want a clear picture of it. The dashboard has five working pages (Overview, Portfolio Analysis, Performance Tracking, Exchange & Risk and Data View) plus a How to Use page. Five filters (Cryptocurrency, Category, Exchange, Transaction Type and Risk Level) apply across the pages.
This guide walks through each page, explains how the main numbers are calculated from your data, and covers setup, use cases and limits. It describes a record-keeping tool, not investment advice.
🎥 Watch the Video Tutorial
Get the Crypto Portfolio Dashboard in HTML
What Problem Does This Crypto Portfolio Dashboard Solve?
If you buy, sell and stake coins on more than one exchange, your history ends up spread across several account exports. Working out your overall position, which exchanges charge you the most in fees, or what share of your trades actually made money usually means a lot of spreadsheet work.
This dashboard reads one transaction table and turns it into KPI cards and charts. Because it is a set of HTML files, it runs locally in your browser and works on Windows, Mac or Linux with no Excel or Power BI licence.
Dashboard Pages Explained
Every page shares the same layout: a left menu, a filter bar with Reset All Filters, and header buttons for Upload Excel, Dark Mode and Fullscreen.
1. Overview
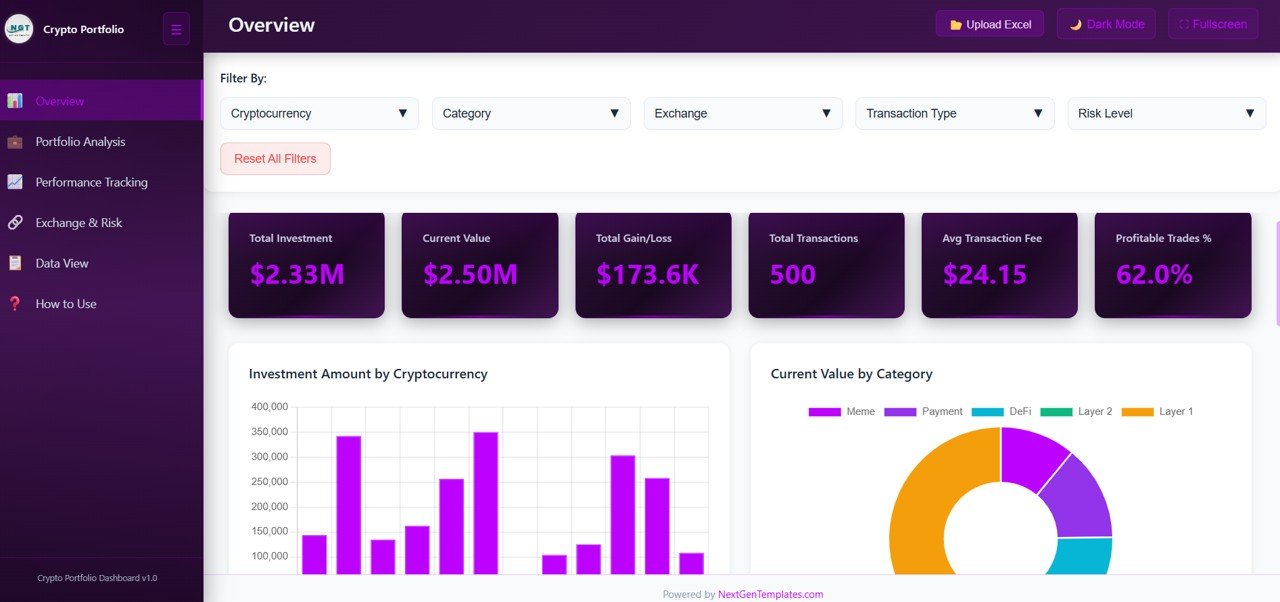
Six KPI cards summarise the whole portfolio. In the sample data: Total Investment $2.33M, Current Value $2.50M, Total Gain/Loss $173.6K, Total Transactions 500, Avg Transaction Fee $24.15 and Profitable Trades % 62.0%. Below them, Investment Amount by Cryptocurrency shows where your money went, and Current Value by Category splits today’s value across Meme, Payment, DeFi, Layer 2 and Layer 1 coins. More charts follow further down the page.
2. Portfolio Analysis
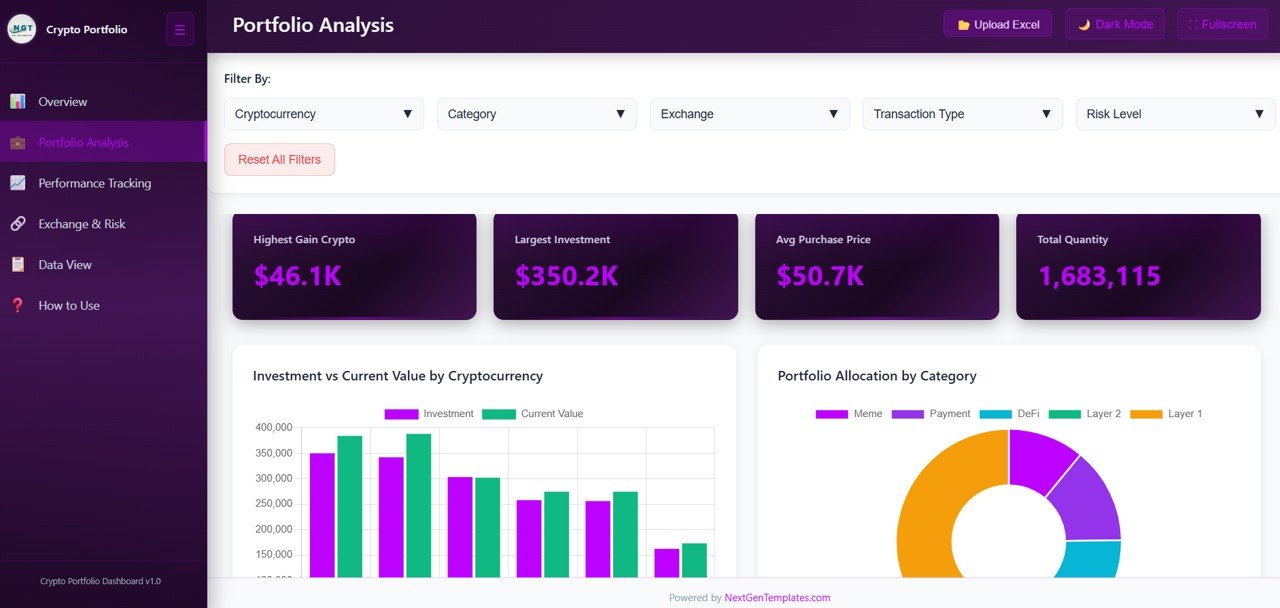
Four cards: Highest Gain Crypto, Largest Investment, Avg Purchase Price and Total Quantity. The charts start with Investment vs Current Value by Cryptocurrency, which puts cost and current worth side by side for each coin, and Portfolio Allocation by Category.
3. Performance Tracking
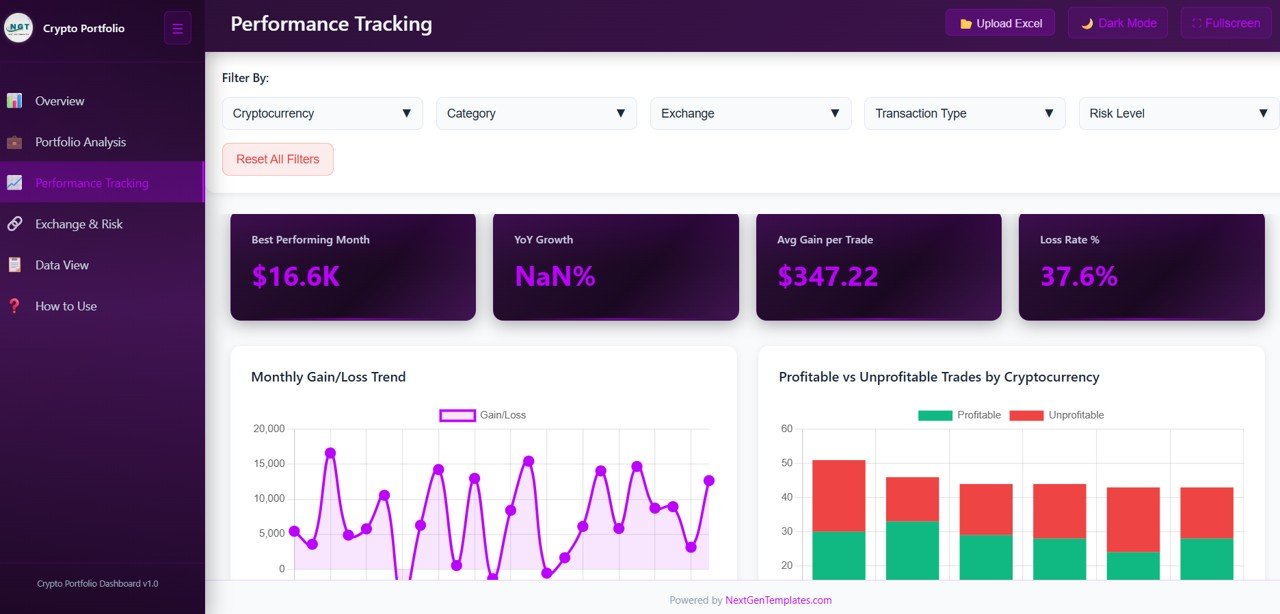
Cards for Best Performing Month ($16.6K in the sample), YoY Growth, Avg Gain per Trade ($347.22) and Loss Rate % (37.6%). The Monthly Gain/Loss Trend line shows which months were positive or negative, and Profitable vs Unprofitable Trades by Cryptocurrency stacks winning and losing trades for each coin. YoY Growth needs data from more than one year to show a meaningful value.
4. Exchange & Risk
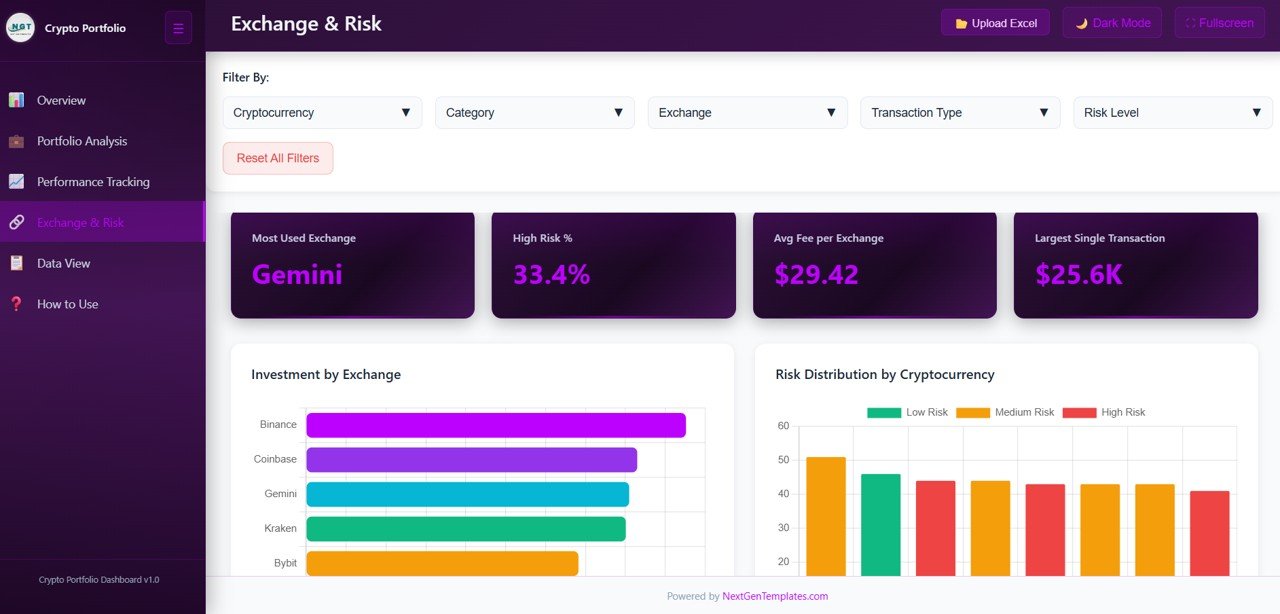
Cards for Most Used Exchange (Gemini in the sample), High Risk % (33.4%), Avg Fee per Exchange ($29.42) and Largest Single Transaction ($25.6K). Investment by Exchange compares Binance, Coinbase, Gemini, Kraken and Bybit, and Risk Distribution by Cryptocurrency groups coins into Low, Medium and High Risk.
5. Data View
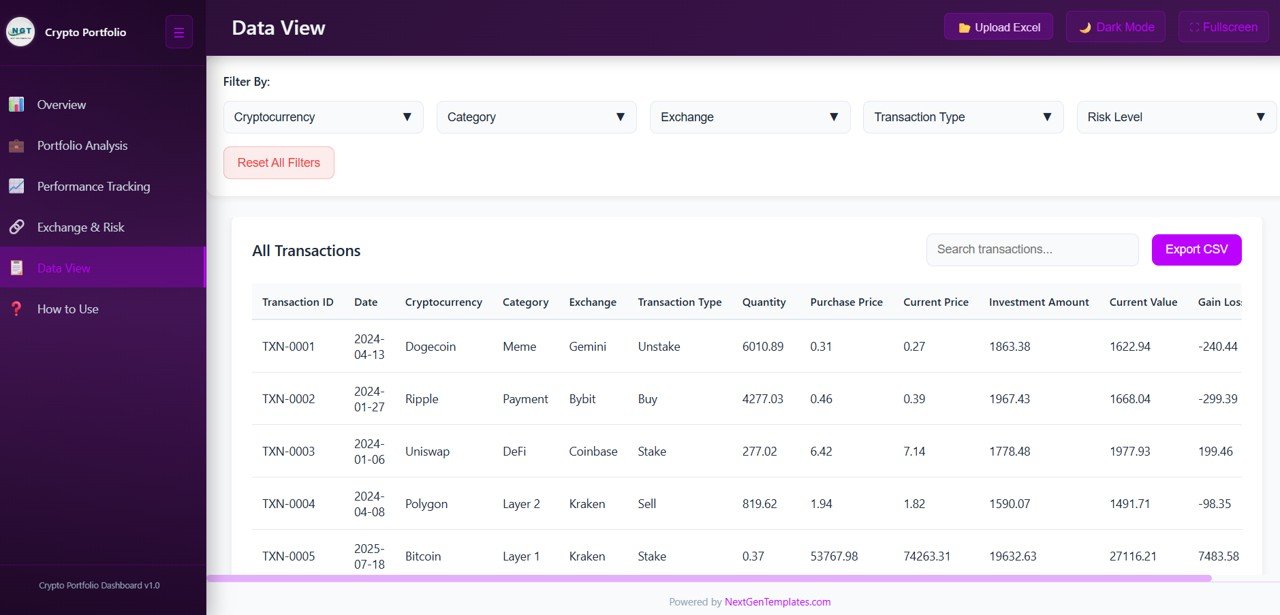
The All Transactions table lists every record with a search box and an Export CSV button. Columns include Transaction ID, Date, Cryptocurrency, Category, Exchange, Transaction Type, Quantity, Purchase Price, Current Price, Investment Amount, Current Value and Gain Loss, with more to the right. Transaction types in the sample include Buy, Sell, Stake and Unstake.
How the Main Numbers Are Calculated
Each transaction row has its own investment, current value and gain or loss. You can check them against the first sample row (TXN-0001: 6,010.89 Dogecoin with a Purchase Price of 0.31 and a Current Price of 0.27):
Investment Amount = Quantity × Purchase Price = 6,010.89 × 0.31 = 1,863.38
Current Value     = Quantity × Current Price  = 6,010.89 × 0.27 = 1,622.94
Gain Loss = Current Value − Investment = 1,622.94 − 1,863.38 = −240.44| Card | What it tells you | How it relates to your data | Better when |
|---|---|---|---|
| Total Investment | Money put into the filtered transactions | Sum of Investment Amount | Context |
| Current Value | What those holdings are worth at Current Price | Sum of Current Value | Higher |
| Total Gain/Loss | Overall result | Current Value − Total Investment ($2.50M − $2.33M ≈ $173.6K in the sample) | Higher |
| Total Transactions | Number of records after filters | Count of rows | Context |
| Avg Transaction Fee | Typical cost per trade | Average fee across the filtered transactions | Lower |
| Profitable Trades % | Share of transactions showing a gain | Based on each row’s Gain Loss | Higher |
Current Value depends on the Current Price stored in your data, so update prices before each review. Gains shown are paper (unrealised) figures based on those prices.
How to Use It With Your Own Transactions
- Unzip the download and open index.html in a modern browser.
- Look at the sample data in Data View to see the column structure you need.
- Prepare your file: export history from each exchange and arrange it into the same columns (Transaction ID, Date, Cryptocurrency, Category, Exchange, Transaction Type, Quantity, Purchase Price, Current Price and so on).
- Load your data with the Upload Excel button, or replace the sample data file as explained on the How to Use page.
- Update Current Price for each coin whenever you want a fresh valuation.
- Filter and review: use the five filters to focus on one coin, category, exchange, transaction type or risk level, then export the filtered rows with Export CSV if you need them elsewhere.
Real-World Use Cases
- Personal portfolio check-in. A long-term holder updates prices monthly and looks at Investment vs Current Value by Cryptocurrency to see which positions are above or below cost.
- Fee review for active traders. A trader compares Avg Fee per Exchange and Investment by Exchange to decide where to route future trades.
- Record keeping for an accountant. At year-end, Data View is filtered by Transaction Type and exported to CSV as a starting point for tax preparation with a professional.
HTML vs Excel vs Power BI Version
| Point | HTML dashboard | Spreadsheet or Power BI dashboard |
|---|---|---|
| Software needed | Any modern browser | Excel, Google Sheets or Power BI Desktop |
| Editing formulas and layout | Needs HTML/JavaScript knowledge | Easier for spreadsheet users |
| Dark mode and fullscreen | Built in | Depends on the tool |
| CSV export of filtered rows | Built in | Varies |
Best Practices
- Keep one row per transaction and use a unique Transaction ID.
- Use the same coin and exchange names every time so filters group correctly.
- Refresh Current Price before reviewing gains; stale prices give misleading totals.
- Keep a backup copy of your data file outside the dashboard folder.
- Treat the Risk Level field as your own label and apply it consistently.
Limitations: Who Should Not Use This Dashboard
- It does not connect to exchanges or price feeds. Transactions and prices must be loaded by you.
- It is not tax software. Cost-basis methods and tax rules vary by country, so use the CSV export with a qualified adviser.
- It does not give buy or sell recommendations.
- Very large histories may feel slower in older browsers or low-memory devices.
- Changing charts or adding pages requires editing HTML and JavaScript.
Related Templates and Guides
If you prefer a spreadsheet, the Blockchain & Cryptocurrency KPI Dashboard in Google Sheets tracks crypto KPIs month by month, and the Investment Tracker in Google Sheets covers wider investments. For profit and loss on mixed holdings, see the Google Sheets Investment Portfolio Tracker. Another browser-based option for household money is the Personal Finance Dashboard in HTML.
Related templates: the same topic is available as the Crypto Portfolio Dashboard in Google Sheets.
If you plan to analyse the exported CSV further, the Excel Pivot Tables and Dashboards course on NextGenTemplates Academy shows how to summarise transaction data with pivots and charts.
Frequently Asked Questions
Do I need coding skills to use the Crypto Portfolio Dashboard in HTML?
No. You open index.html in a browser and load your data. Coding is only needed if you want to change the layout or charts.
Which filters does the dashboard have?
Cryptocurrency, Category, Exchange, Transaction Type and Risk Level, plus a Reset All Filters button.
Does it update prices automatically?
No. Current Price comes from your data, so update it whenever you want a new valuation.
How is Total Gain/Loss calculated?
It is Current Value minus Total Investment for the filtered transactions, built up from each row’s Gain Loss.
Can I export my transactions?
Yes. Data View has a search box and an Export CSV button that saves the rows you are viewing.
Is my data uploaded anywhere?
The dashboard runs from files on your computer and opens in your browser; it has no account or server sign-in.
Wrapping Up
The Crypto Portfolio Dashboard in HTML gives you a clear, filterable view of your crypto transactions: what you put in, what it is worth now, your fees and how many trades worked out. Load your own history, keep prices current and use the Data View export for your records.
Get the Crypto Portfolio Dashboard in HTML
📅 Last updated: October 2026