Managing construction project budgets is one of the most complex challenges in the industry. From fluctuating material costs to contractor overruns and timeline delays, keeping every project financially healthy requires constant monitoring. The Construction Project Cost Dashboard in Google Sheets solves this problem by bringing all your critical project data into a single, interactive dashboard that updates automatically as you enter your records. Whether you oversee 5 projects or 50, this template delivers instant clarity on budgets, actual costs, variances, completion rates, and contractor performance — all inside Google Sheets with zero coding required.
Click here to Purchase Construction Project Cost Dashboard in Google Sheets
Key Features of Construction Project Cost Dashboard in Google Sheets
This dashboard template includes 5 interactive analysis pages plus a structured data entry sheet. It tracks 5 key performance indicators — Total Projects, Total Budget, Total Actual Cost, Average Completion %, and Total Variance — giving you a comprehensive view of your entire construction portfolio. The dashboard features dynamic slicers for instant filtering by category, region, status, and priority. Each page focuses on a different analytical dimension: budget performance, timelines, contractor evaluation, and individual project lookup. The template works with any type of construction project including residential, commercial, infrastructure, and renovation work.
- 5 interactive dashboard pages with automated charts and KPI cards
- Dynamic slicers to filter by category, region, status, priority, and more
- Budget vs actual cost comparison across multiple dimensions
- Contractor performance analysis with completion rates and variance tracking
- Project search functionality for instant individual project lookup
- Structured data sheet — just replace sample data and everything updates
- Works entirely in Google Sheets with no macros or add-ons needed
Dashboard Pages Explained
1 — Overview Page
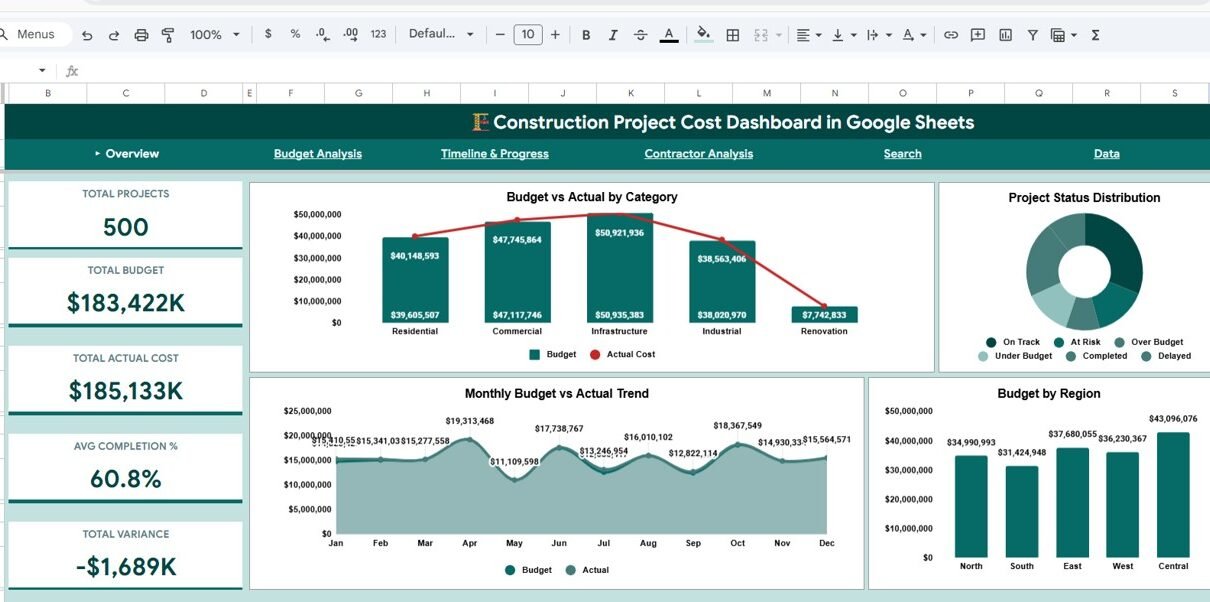
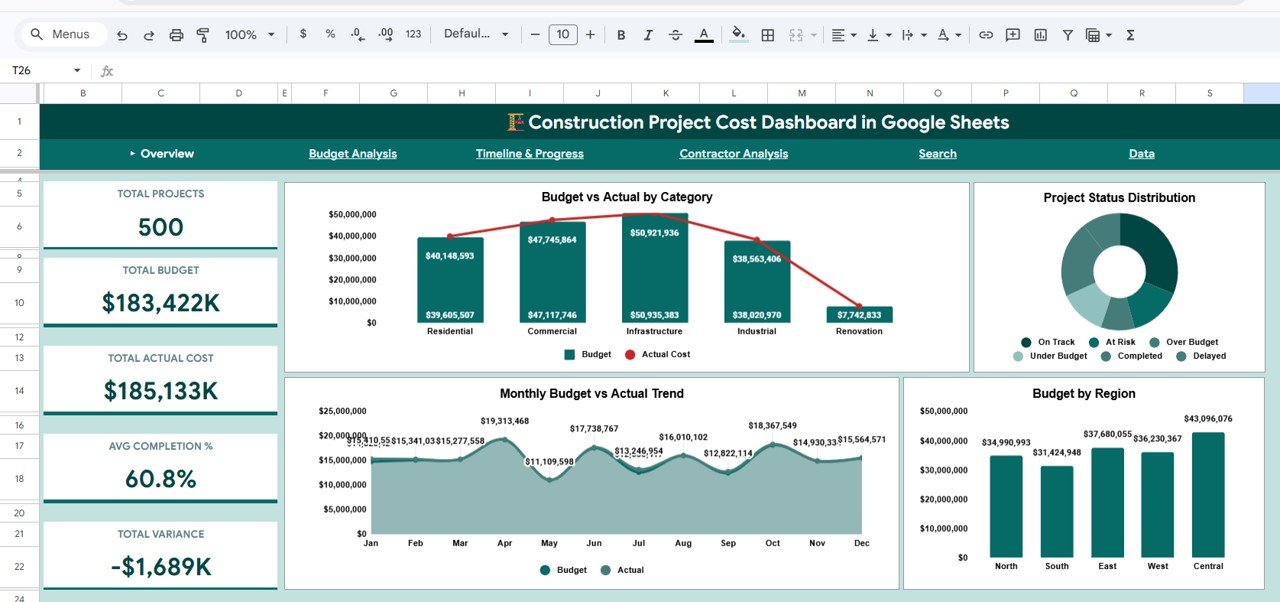
The Overview Page serves as the command center of your construction project portfolio. At the top, you’ll find 5 KPI cards displaying Total Projects, Total Budget, Total Actual Cost, Avg Completion %, and Total Variance. These cards give you an immediate snapshot of your portfolio’s financial health without scrolling through any dataConstruction Project Cost Dashboard in Google Sheets
Below the KPI cards, the page features four analytical charts. Budget vs Actual by Category compares your planned budgets against real expenditures across different construction categories, helping you spot which types of projects consistently run over budget. Project Status Distribution shows how your projects are distributed across different status levels — completed, in progress, on hold, or delayed. Monthly Budget vs Actual Trend reveals spending patterns over time so you can identify seasonal fluctuations or emerging cost issues early. Budget by Region breaks down your total budget allocation by geographic area, making it easy to see which regions consume the largest share of resources. Multiple slicers let you filter the entire dashboard instantly.Construction Project Cost Dashboard in Google Sheets
Overview Page
2 — Budget Analysis
The Budget Analysis page takes a deeper look at where your money is going and how it compares to your plans. Avg Variance by Phase shows which project phases (planning, foundation, framing, finishing, etc.) tend to deviate the most from budgeted amounts. Budget by Category & Priority cross-references your spending by both construction category and priority level, revealing whether high-priority projects are getting the financial attention they need. Budget vs Actual Cost (Sample) provides a project-level comparison for a quick visual check. Monthly Variance Trend tracks how the gap between budget and actual cost changes over time, helping you catch worsening trends before they become critical problems.Construction Project Cost Dashboard in Google Sheets
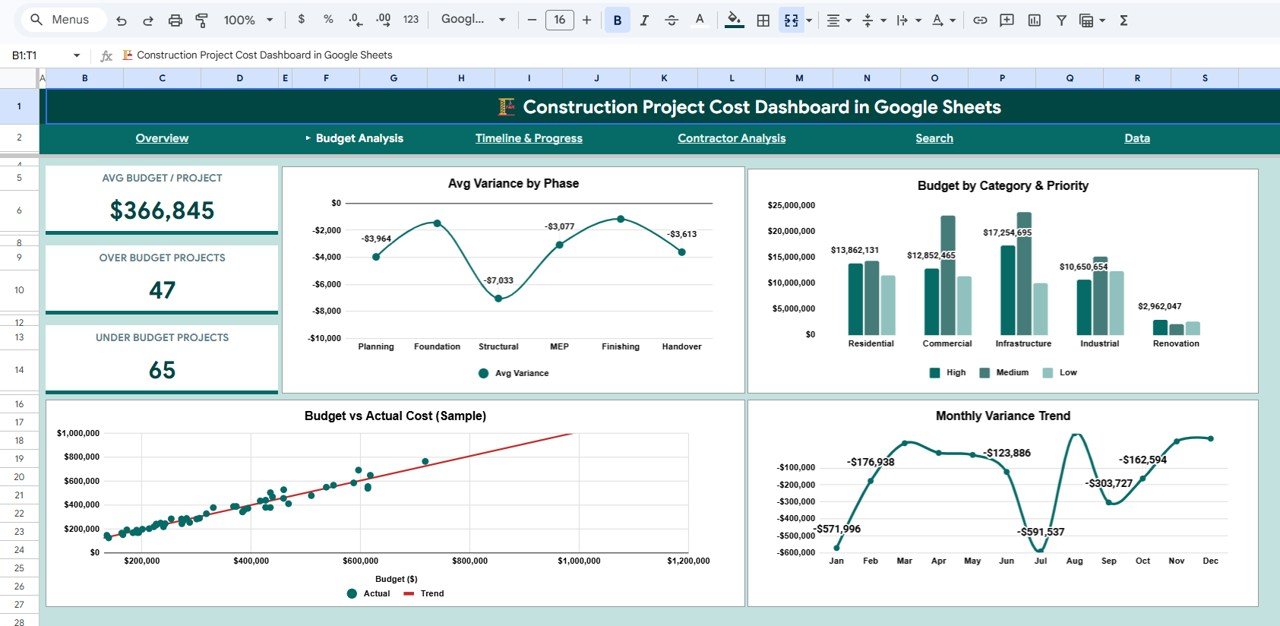
Budget Analysis
3 — Timeline & Progress
The Timeline & Progress page focuses on whether your projects are finishing on time and at what pace. Avg Completion % by Category shows how far along projects are on average within each construction category. Avg Duration by Phase highlights which phases take the longest, helping you plan more realistic timelines for future projects. Monthly Completed vs Delayed gives you a month-over-month picture of how many projects are finishing on schedule versus falling behind. On Track vs At Risk by Region identifies geographic areas where projects are more likely to face delays, so you can allocate extra resources or attention proactively.
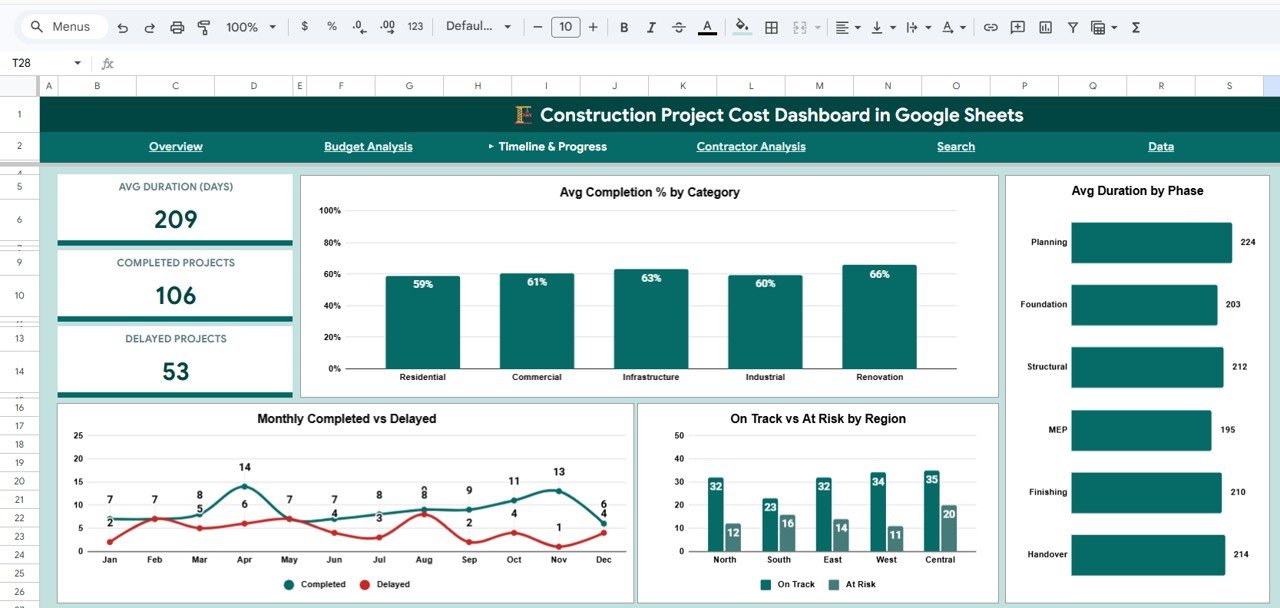
Timeline & Progress
4 — Contractor Analysis
The Contractor Analysis page helps you evaluate the performance of each contractor working on your projects. Contractor Avg Completion % ranks contractors by how far along their assigned projects are on average. Projects per Contractor shows workload distribution to help you identify overloaded or underutilized contractors. Contractor Budget vs Actual compares each contractor’s budgeted costs against actual spending, making it easy to identify who consistently stays within budget and who tends to overspend. Avg Variance per Contractor highlights the average cost deviation for each contractor, supporting data-driven decisions for future project assignments. If you need even more construction project tracking, check out the Construction Progress & Cost Control Dashboard in Google Sheets.
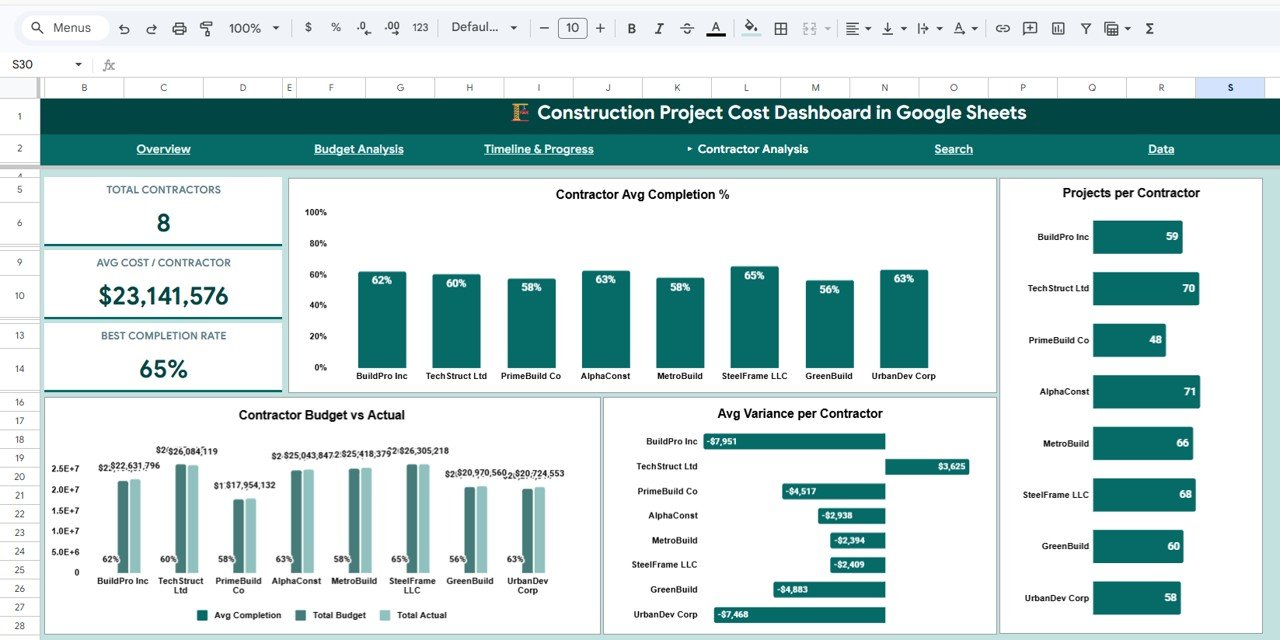
Contractor Analysis
5 — Search Page
The Search Page provides a quick-lookup functionality where you can select a Project ID from the dropdown and instantly view all the key details of that specific project. The displayed information includes Project Name, Category, Phase, Contractor, Region, Budget, Actual Cost, Variance, Status, Priority, Completion %, and Duration in Days. This eliminates the need to scroll through hundreds of rows in the data sheet and gives you an instant snapshot of any project in your portfolio.Construction Project Cost Dashboard in Google Sheets
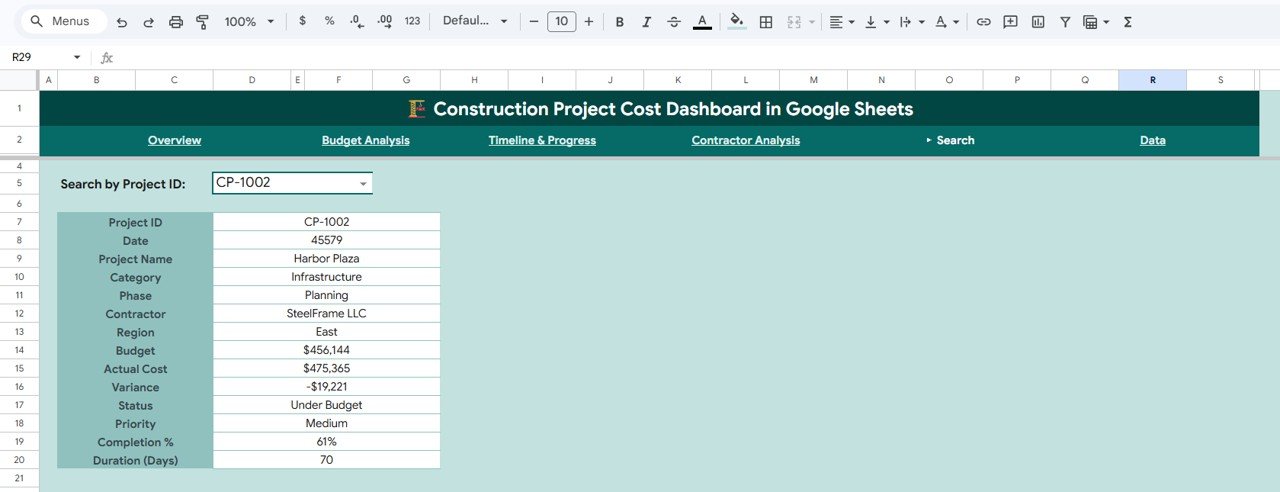
Search Page
6 — Data Sheet
The Data Sheet is where all your project records live. Each row represents a construction project with fields for Project ID, Project Name, Category, Phase, Contractor, Region, Budget, Actual Cost, Variance, Status, Priority, Completion %, Start Date, End Date, and Duration in Days. Simply replace the sample data with your own records in the same format, and all five dashboard pages update automatically.
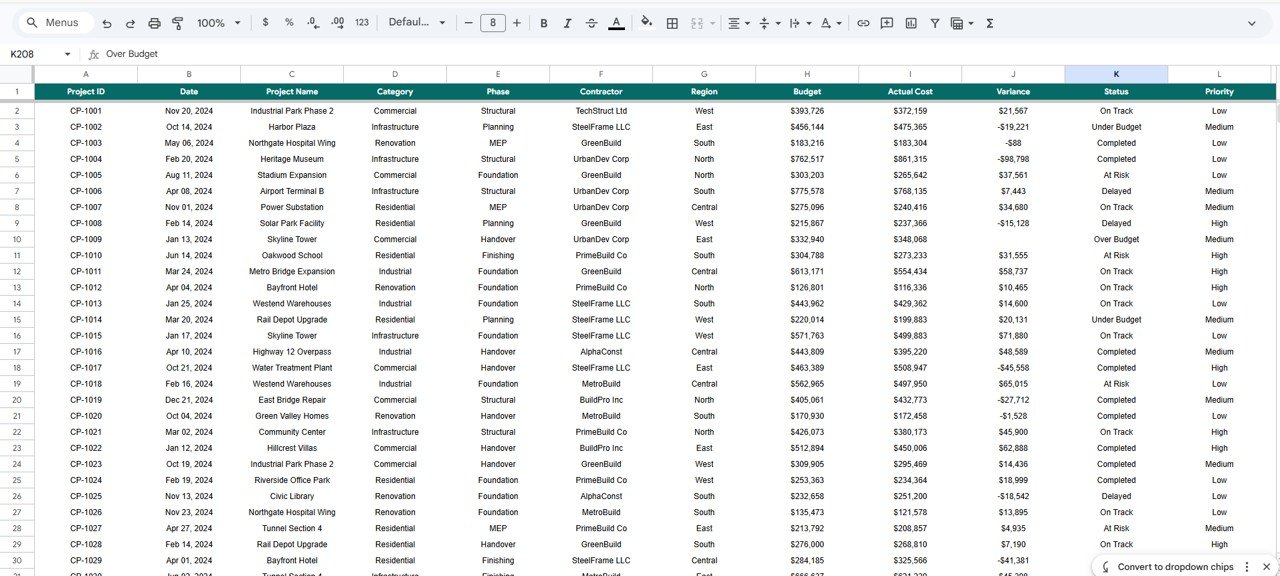
Data Sheet
Advantages of the Construction Project Cost Dashboard
This template saves construction professionals significant time compared to building analytics from scratch. All formulas, charts, and KPI calculations are pre-built — you only need to enter your data. The Google Sheets format means your team can collaborate in real time from any device, and there’s no software to install. The dashboard provides both high-level portfolio views and granular project details, which makes it suitable for both executive reporting and day-to-day project management. The slicer-based filtering allows you to answer specific questions (e.g., “How are my North region projects performing?”) in seconds rather than manually sorting and filtering spreadsheets.Construction Project Cost Dashboard in Google Sheets
Opportunities for Improvement
Click here to Purchase Construction Project Cost Dashboard in Google Sheets
While the dashboard covers the most critical project cost metrics, users managing very large portfolios (100+ projects) may want to consider splitting data into quarterly or yearly sheets for better performance. The current template does not include automated email alerts for budget overruns, though Google Apps Script could be added for that functionality. Adding a cash flow forecasting section or an earned value management (EVM) analysis page could further enhance the template for advanced project controllers. Users who need multi-currency support would need to add a conversion layer to the data sheet.
Best Practices for Using This Dashboard
Update your data sheet at least weekly to keep the dashboard accurate and actionable. Use consistent naming conventions for categories, phases, contractors, and regions — this ensures the charts and slicers work correctly. Review the Budget Analysis page during monthly project review meetings to catch cost variances early. Use the Contractor Analysis page before awarding new contracts to evaluate past performance. Export dashboard pages as PDFs for stakeholder presentations by using Google Sheets’ built-in print functionality. For related project tracking capabilities, also explore the Solar Project Construction Dashboard in Google Sheets and the Construction Equipment KPI Dashboard in Google Sheets.
Explore Relevant Templates
- Construction Progress & Cost Control Dashboard in Google Sheets — Comprehensive progress tracking with cost control analytics for construction firms.
- Project Performance and Cost Control Dashboard in Google Sheets — A broader project performance template covering cost control, timelines, and resource allocation.
- Construction Equipment KPI Dashboard in Google Sheets — Track equipment utilization, maintenance costs, and fleet performance KPIs.
- Infrastructure KPI Scorecard in Google Sheets — Monitor infrastructure project KPIs with a scorecard format for quick reviews.
- Construction Project Cost Dashboard in Excel — Prefer Excel? Get the same construction cost tracking in Microsoft Excel format.
Frequently Asked Questions
Click here to Purchase Construction Project Cost Dashboard in Google Sheets
What is the best Google Sheets template for tracking construction project costs?
The Construction Project Cost Dashboard in Google Sheets is one of the most comprehensive templates available. It tracks 5 KPIs including Total Budget, Total Actual Cost, and Total Variance across 5 interactive dashboard pages covering budget analysis, timeline progress, contractor performance, and a project search page.Construction Project Cost Dashboard in Google Sheets
How do I track budget vs actual cost for construction projects in Google Sheets?
This dashboard includes a dedicated Budget Analysis page that compares budget vs actual cost by category, by phase, and over time with monthly variance trends. Simply enter your project data and the charts calculate everything automatically.
Can I use this dashboard for multiple construction projects at once?
Yes. The dashboard is designed for multi-project portfolios. Each row in the Data Sheet represents a different project, and the dashboard aggregates all projects into KPI cards, charts, and analysis pages with slicer-based filtering.
Does this template require Google Sheets add-ons or macros?
No. The Construction Project Cost Dashboard works entirely with native Google Sheets formulas and chart features. No add-ons, macros, or Apps Script are required.
How do I evaluate contractor performance using this dashboard?
The Contractor Analysis page shows Contractor Avg Completion %, Projects per Contractor, Contractor Budget vs Actual, and Avg Variance per Contractor — giving you a complete performance picture for each contractor in your portfolio.
Is this template suitable for residential and commercial construction projects?
Absolutely. The template works for all types of construction projects including residential, commercial, infrastructure, renovation, and specialty construction. Just customize the category and phase fields to match your project types.
Conclusion
Click here to Purchase Construction Project Cost Dashboard in Google Sheets
The Construction Project Cost Dashboard in Google Sheets gives construction professionals a powerful, easy-to-use tool for monitoring project budgets, tracking actual costs, evaluating contractor performance, and identifying timeline delays — all in one template. With 5 interactive pages, automated KPI cards, and dynamic slicers, it transforms raw project data into actionable insights. Purchase the Construction Project Cost Dashboard in Google Sheets today and take control of your construction project finances.
Visit our YouTube channel for step-by-step video tutorials on using Google Sheets dashboard templates:
Youtube.com/@NeoTechNavigators
For more information about Google Sheets features and formulas, visit the Google Sheets Help Center.
Click here to Purchase Construction Project Cost Dashboard in Google Sheets