Veterinary Clinic Dashboard in Google Sheets — Complete Clinic Analytics at Your Fingertips
Veterinary Clinic Dashboard in Google Sheets is a powerful, ready-to-use analytics template built specifically for veterinary clinics that want to track patient visits, monitor revenue trends, analyze treatment costs, and evaluate veterinary team performance — all inside Google Sheets. This dashboard includes 6 interactive pages covering every critical aspect of clinic operations, from high-level KPI summaries to granular visit record lookups. It tracks 5 key performance indicators — Total Visits, Total Revenue, Avg Bill, Surgeries, and Follow-Up Rate — with interactive slicers for instant filtering across every view.
Whether you run a small animal practice or a multi-location veterinary hospital, this Google Sheets dashboard delivers real-time analytics without the complexity of enterprise BI tools. Simply open the template in Google Drive, replace the sample data with your clinic records, and all charts, KPIs, and filters update automatically. No formulas to write, no scripts to configure — it works out of the box.
Veterinary Clinic Dashboard in Google Sheets
Key Features of the Veterinary Clinic Dashboard in Google Sheets
This veterinary clinic dashboard delivers everything you need to run a data-driven animal healthcare practice. It includes 6 dedicated pages — Overview, Patient Analysis, Financial Analysis, Service Analysis, Search Page, and Data Sheet — covering every operational and financial metric that matters. The template tracks 5 core KPIs on the overview page: Total Visits, Total Revenue, Avg Bill, Surgeries, and Follow-Up Rate, giving you an instant snapshot of your clinic’s health.
Multiple interactive slicers let you filter the entire dashboard by pet type, visit type, veterinarian, payment status, and more. The Patient Analysis page breaks down visits by pet type per quarter, revenue by pet type, monthly dog vs cat visits, and pet age distribution. The Financial Analysis page covers revenue by veterinarian, payment status distribution, monthly treatment vs medication cost, and treatment cost vs total bill comparisons. The Service Analysis page evaluates revenue by visit type, service mix by quarter, average bill by visit type, and total bill distribution.
A unique Search Page lets you look up any visit record by Visit ID, instantly displaying 14 detail fields including Date, Pet Name, Pet Type, Breed, Owner Name, Visit Type, Veterinarian, Diagnosis, Treatment Cost, Medication Cost, Total Bill, Payment Status, Pet Age, and Follow-Up Required. The pre-structured Data Sheet makes data entry effortless — simply add your records in the provided format and watch the entire dashboard come alive.
Dashboard Pages Explained
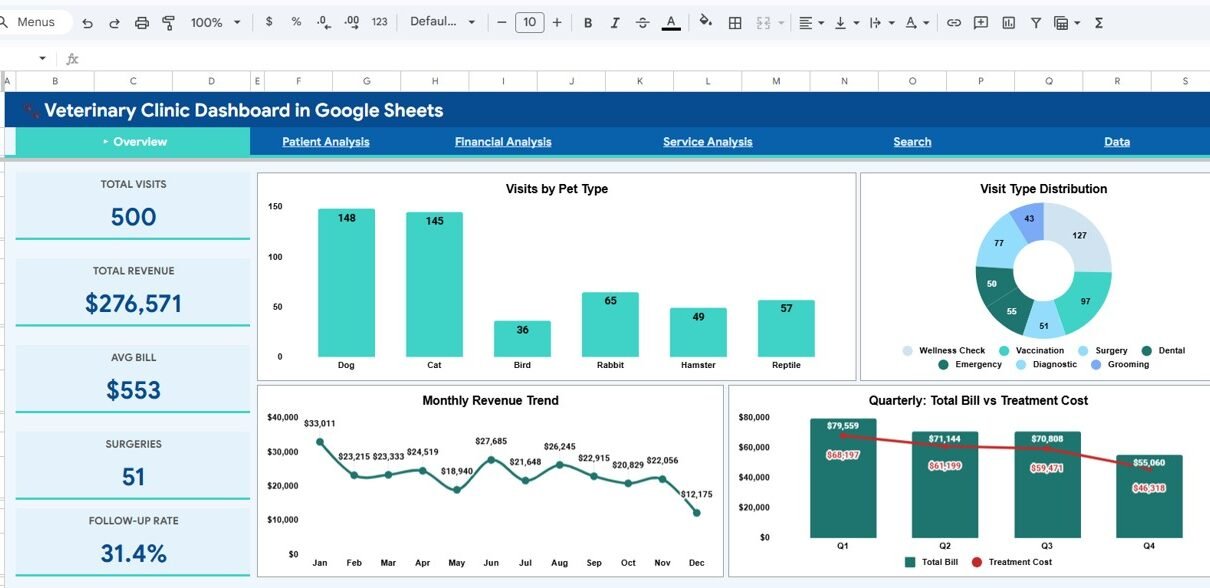
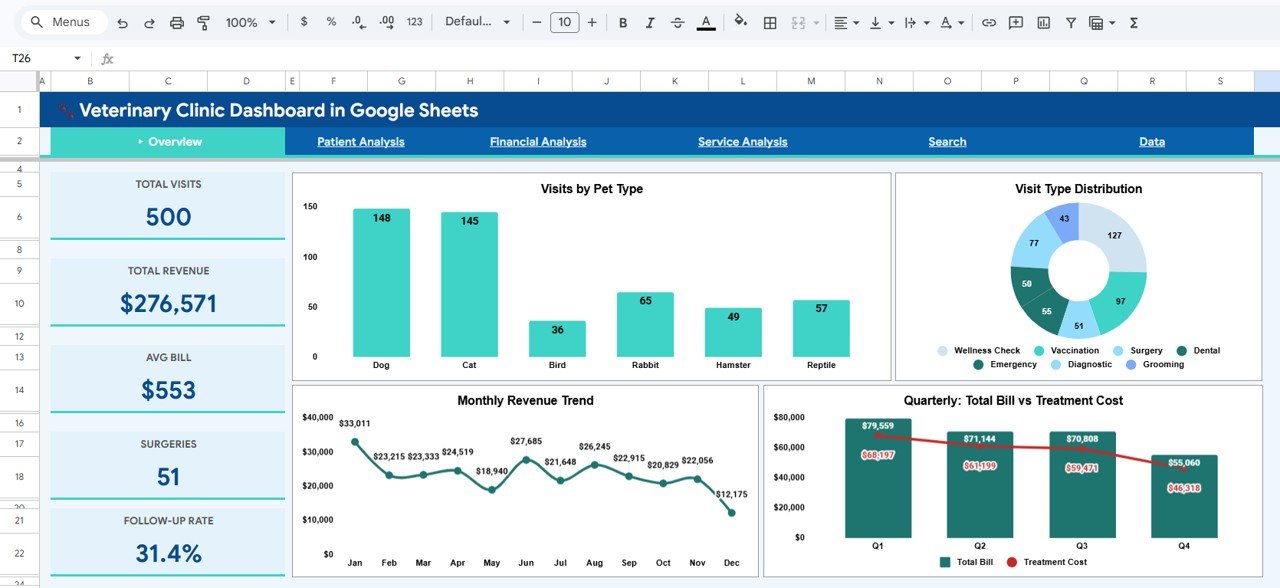
1. Overview Page
The Overview page serves as your clinic’s command center. At the top, KPI cards display Total Visits, Total Revenue, Avg Bill, Surgeries, and Follow-Up Rate for an instant performance snapshot. Below, you’ll find four analytical charts: Visits by Pet Type shows the distribution of visits across different animal types, Visit Type Distribution breaks down visits by category (checkup, surgery, vaccination, emergency, etc.), Monthly Revenue Trend tracks your income over time, and Quarterly Total Bill vs Treatment Cost reveals cost efficiency patterns. Interactive slicers on this page let you filter the entire dashboard by any dimension for quick drill-down analysis.
Overview Page
2. Patient Analysis
The Patient Analysis page provides deep insights into your patient demographics and visit patterns. Visits by Pet Type per Quarter helps you identify seasonal trends for different animal types. Revenue by Pet Type shows which pet categories generate the most income. Monthly Dog vs Cat Visits reveals the comparative volume trends of your two most common patient types. Pet Age Distribution gives you a clear picture of the age demographics across your patient base, helping you tailor services and treatment protocols accordingly.
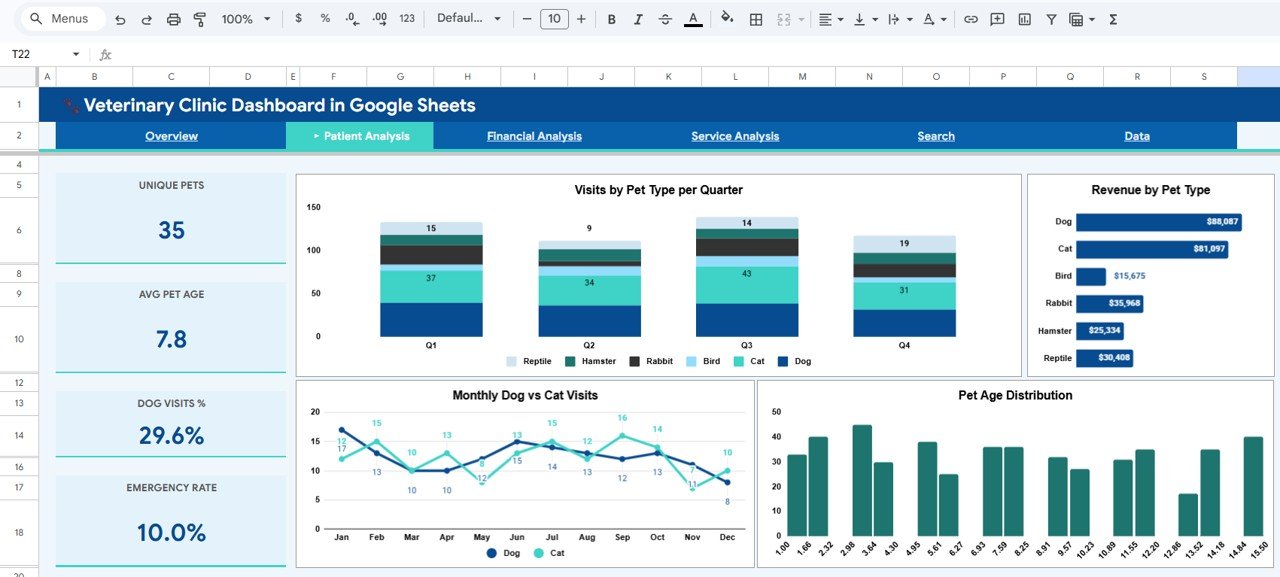
Patient Analysis
3. Financial Analysis
The Financial Analysis page gives you complete visibility into your clinic’s finances. Revenue by Veterinarian identifies which vets generate the most revenue — essential for performance reviews and staffing decisions. Payment Status Distribution shows the breakdown between paid, pending, and overdue billing. Monthly Treatment vs Medication Cost tracks your two largest expense categories over time. Treatment Cost vs Total Bill compares what you spend on treatments against what you charge, helping you evaluate margin health across services.
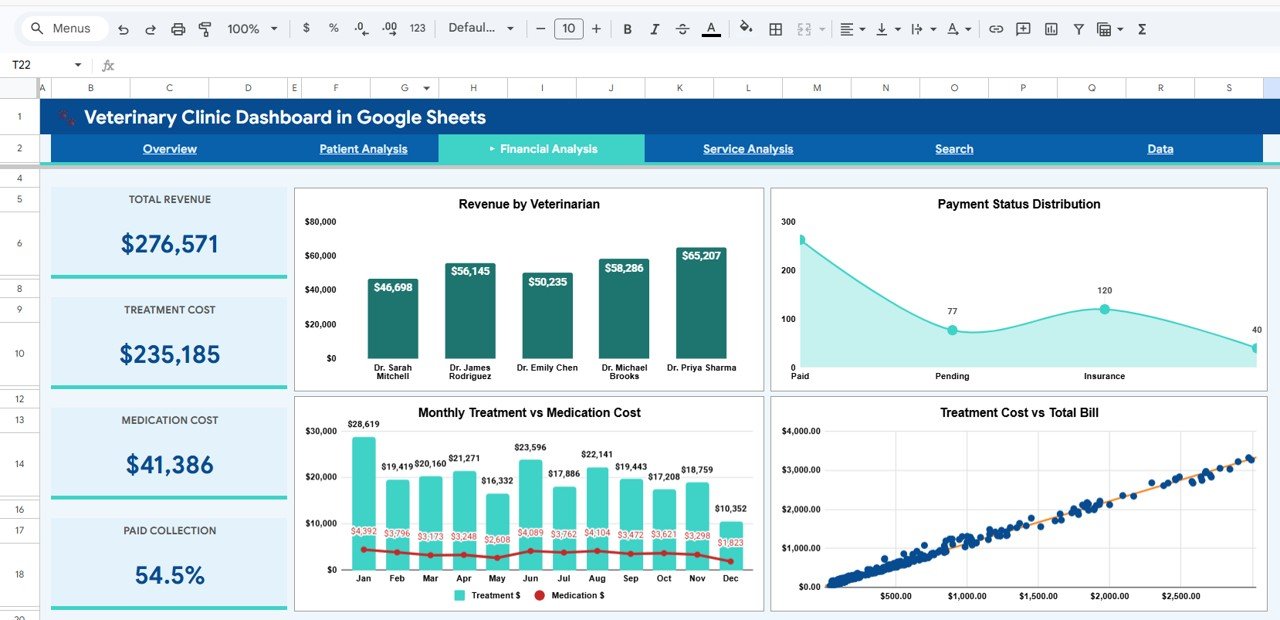
Financial Analysis
4. Service Analysis
The Service Analysis page evaluates your service offerings and pricing strategy. Revenue by Visit Type shows which types of visits (checkups, surgeries, vaccinations, emergencies) drive the most income. Service Mix by Quarter reveals how your service portfolio evolves over time. Avg Bill by Visit Type helps you benchmark pricing across service categories. Total Bill Distribution gives you a histogram view of billing amounts to understand your pricing spread and identify optimization opportunities.
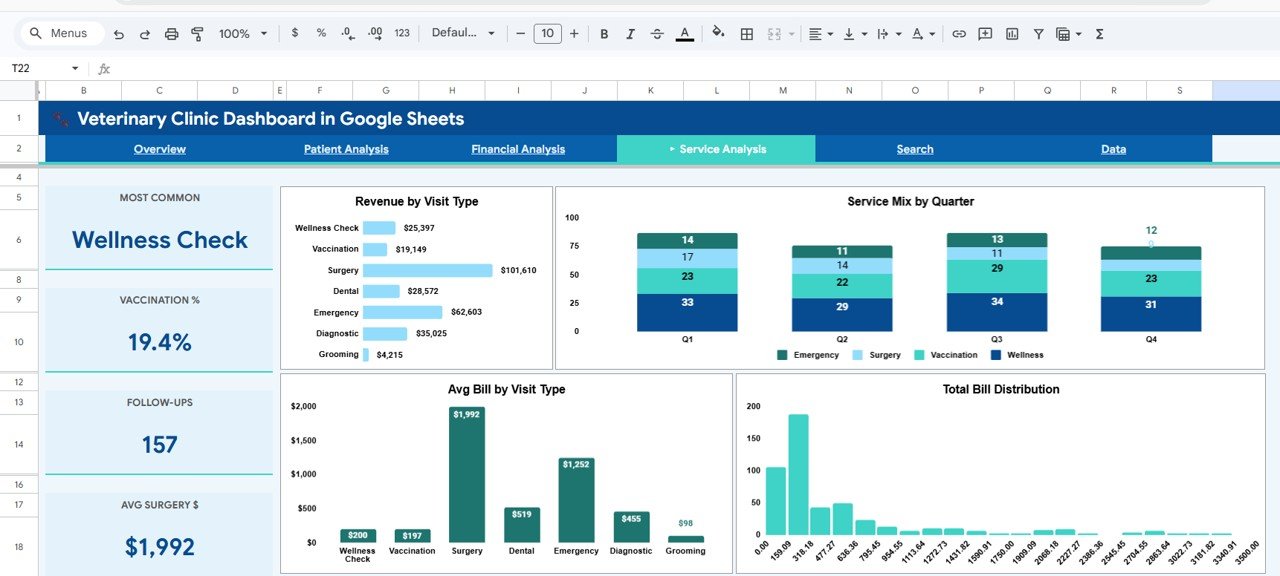
Service Analysis
5. Search Page
The Search Page features a powerful Visit Record Lookup tool. Select any Visit ID from the dropdown and instantly view the complete visit details — including Visit ID, Date, Pet Name, Pet Type, Breed, Owner Name, Visit Type, Veterinarian, Diagnosis, Treatment Cost, Medication Cost, Total Bill, Payment Status, Pet Age, and Follow-Up Required. This page is perfect for quickly verifying individual records, answering client inquiries, or auditing specific visits.
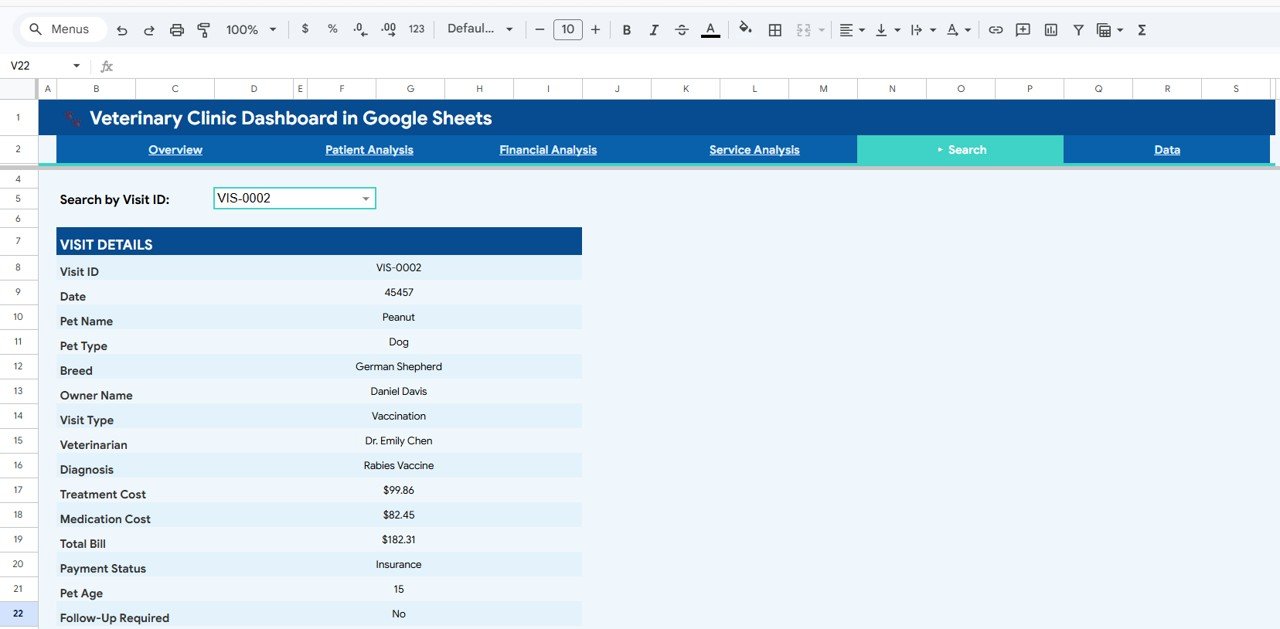
Search Sheet Tab
6. Data Sheet
The Data Sheet is your single source of truth. Enter all visit records in the pre-structured format provided — all dashboard pages, charts, and KPIs update automatically based on the data you enter here. The columns include Visit ID, Date, Pet Name, Pet Type, Breed, Owner Name, Visit Type, Veterinarian, Diagnosis, Treatment Cost, Medication Cost, Total Bill, Payment Status, Pet Age, and Follow-Up Required.
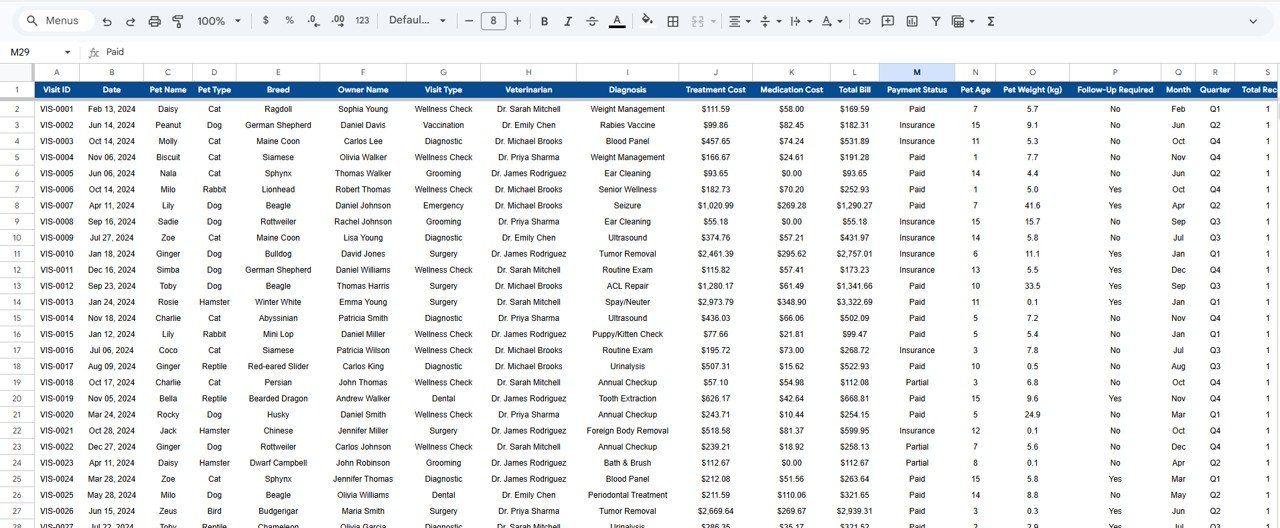
Data Sheet Tab
Advantages of the Veterinary Clinic Dashboard in Google Sheets
- Zero Installation Required — Works entirely in your browser via Google Drive. No software downloads, no licensing fees, no IT setup.
- Real-Time Collaboration — Multiple team members can view and update the dashboard simultaneously, making it ideal for multi-vet practices.
- Automatic Updates — All charts, KPIs, and analysis pages refresh instantly when you enter or modify data in the Data Sheet.
- Comprehensive Analytics — 6 dedicated pages cover overview KPIs, patient demographics, financial performance, service analysis, and individual record lookup.
- Cross-Platform Access — Access your dashboard from any device with an internet connection — desktop, tablet, or mobile.
- No Coding Skills Needed — The entire template runs on built-in Google Sheets formulas and charts. No scripts, no macros, no technical setup.
Opportunities for Improvement
- Appointment Scheduling Integration — Adding a scheduling view could help clinics manage upcoming appointments alongside historical analytics.
- Vaccination Reminder Tracking — A dedicated tracker for pet vaccination schedules could add preventive care management capabilities.
- Multi-Location Comparison — For veterinary chains, adding location-based filtering would enable cross-location performance benchmarking.
- Client Communication Log — Integrating a follow-up communication tracker could improve client retention and care continuity.
Best Practices for Using This Dashboard
🛒 Click here to Purchase the Veterinary Clinic Dashboard in Google Sheets
- Update Data Weekly — For the most accurate insights, add new visit records to the Data Sheet at least once a week.
- Use Consistent Naming — Maintain consistent naming conventions for pet types, visit types, and veterinarian names to ensure charts aggregate correctly.
- Review Financial Analysis Monthly — Use the Financial Analysis page during monthly reviews to track revenue trends and cost management.
- Leverage the Search Page — When clients call with billing questions, use the Search Page for instant record lookup instead of scrolling through the data sheet.
- Share with Your Team — Share the Google Sheet with your veterinary team (view-only or edit access) to promote data transparency and collaborative decision-making.
Explore Relevant Templates
If you found this Veterinary Clinic Dashboard useful, check out these related templates:
- Veterinary Clinic Dashboard in Excel — Pivot-driven Excel dashboard with 5 interactive analysis pages and automated charts.
- Veterinary Clinic Dashboard in Power BI — Advanced Power BI dashboard with DAX-powered visuals and drill-through capabilities.
- Veterinary Clinic KPI Scorecard in Excel — Track monthly and yearly KPI targets with color-coded performance indicators.
- All Google Sheets Dashboard Templates — Browse our full collection of Google Sheets dashboards across industries.
Frequently Asked Questions
What KPIs does the Veterinary Clinic Dashboard in Google Sheets track?
The Veterinary Clinic Dashboard in Google Sheets tracks 5 key performance indicators: Total Visits, Total Revenue, Avg Bill, Surgeries, and Follow-Up Rate. These KPIs are displayed as interactive cards on the Overview page and update automatically when you enter your data in the Data Sheet.
Do I need advanced Google Sheets skills to use this veterinary dashboard?
No. This dashboard is designed for users of all skill levels. Simply replace the sample data in the Data Sheet tab with your own clinic records and all charts, KPIs, and filters update automatically. No formulas or scripts to configure.
Can I filter the dashboard by specific veterinarians or pet types?
Yes. The Overview page includes multiple interactive slicers that let you filter the entire dashboard by pet type, visit type, veterinarian, payment status, and other criteria for instant drill-down analysis.
How do I look up a specific visit record?
Navigate to the Search Page tab and select a Visit ID from the dropdown. The page will instantly display all 14 details for that visit including Date, Pet Name, Breed, Veterinarian, Diagnosis, Treatment Cost, Total Bill, Payment Status, and more.
What is the best Google Sheets dashboard for a veterinary clinic?
The Veterinary Clinic Dashboard in Google Sheets is one of the best options available. It offers 6 interactive pages covering patient analysis, financial insights, service performance, and a powerful visit record search feature — all in a cloud-based, no-install format.
Is there a Power BI or Excel version of this dashboard?
Yes! We offer both a Veterinary Clinic Dashboard in Power BI with DAX-powered analytics and a Veterinary Clinic Dashboard in Excel with pivot-driven charts.
Conclusion
The Veterinary Clinic Dashboard in Google Sheets is a comprehensive, cloud-based analytics solution that empowers veterinary professionals to track every aspect of clinic performance — from patient visits and treatment costs to revenue trends and veterinarian productivity. With 6 interactive pages, 5 real-time KPIs, a powerful search function, and zero-installation setup, it’s the ideal tool for data-driven veterinary clinic management.
🛒 Click here to Purchase the Veterinary Clinic Dashboard in Google Sheets
For more Google Sheets templates, dashboards, and tutorials, visit Youtube.com/@NeoTechNavigators