The food truck industry in the U.S. alone generates over $1.4 billion annually, yet most food truck owners rely on paper receipts and gut instinct to make location and menu decisions. The Food Truck Dashboard in Google Sheets tracks 4 KPIs across 6 interactive pages, with 10+ pre-built charts and slicer filters covering revenue, menu performance, location analytics, and weather impact — all in a browser-based spreadsheet that any team member can access from their phone.
Whether you run one truck or manage a fleet, this Food Truck Dashboard in Google Sheets eliminates manual reporting. Replace the 500 sample rows with your transaction data, and every chart, KPI card, and analysis page updates automatically. No formulas to write, no macros to enable, no recurring software fees.
Key Features of Food Truck Dashboard in Google Sheets
📊 Click here to Purchase Food Truck Dashboard in Google Sheets
- 4 KPI Cards — Total Revenue, Total Orders, Average Order Value, and Average Rating display on the Overview page. All metrics recalculate automatically when you modify the Data sheet.
- 10+ Interactive Charts — Revenue by Truck, Payment Method Split, Location Performance, Menu Category Mix, Monthly Revenue Trend, Revenue by Day of Week, Time Slot Performance, Category Revenue, Top Items by Revenue, Monthly Revenue by Category, Location Revenue, Revenue by Weather, and Monthly Location Trend.
- Slicer-Based Filtering — Click slicer controls on the Overview page to filter all charts by truck name, location, time period, menu category, or payment method. No formulas to edit.
- Transaction Lookup — The Search page lets you select any Transaction ID from a dropdown to view 14 fields including Date, Truck Name, Location, Menu Item, Revenue, and Weather.
- 500-Row Sample Dataset — Pre-loaded with realistic food truck data covering multiple trucks, locations, menu items, and payment methods.
- Real-Time Team Collaboration — Share the dashboard via link with your accountant, partners, or staff. Multiple people can view simultaneously through Google Sheets.
Dashboard Pages Explanation
1. Overview Page
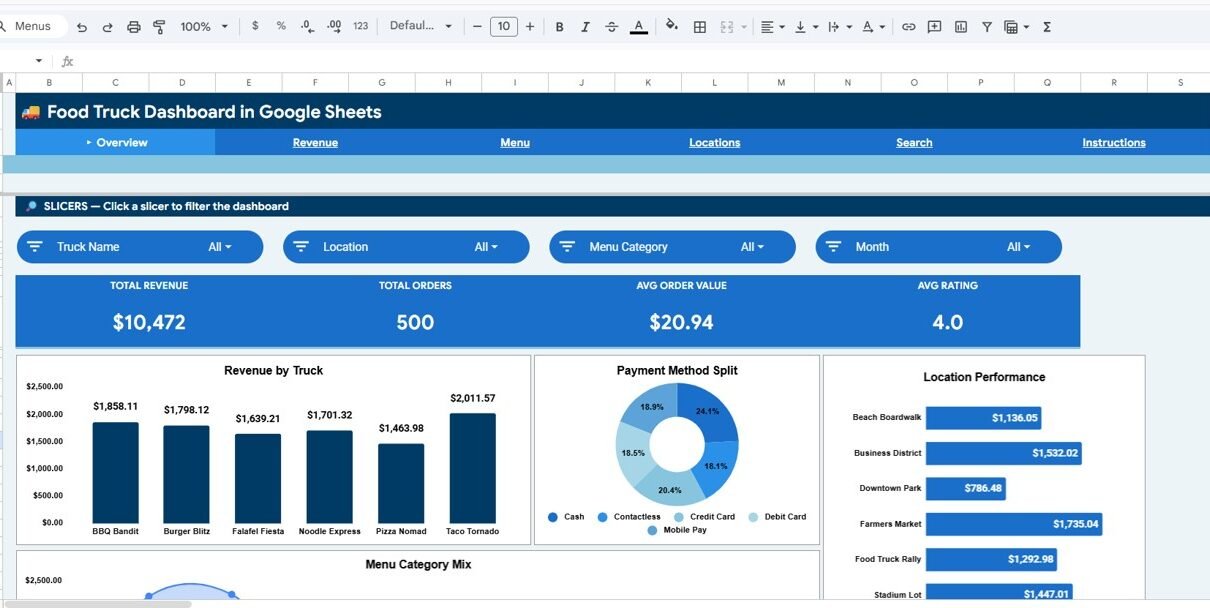
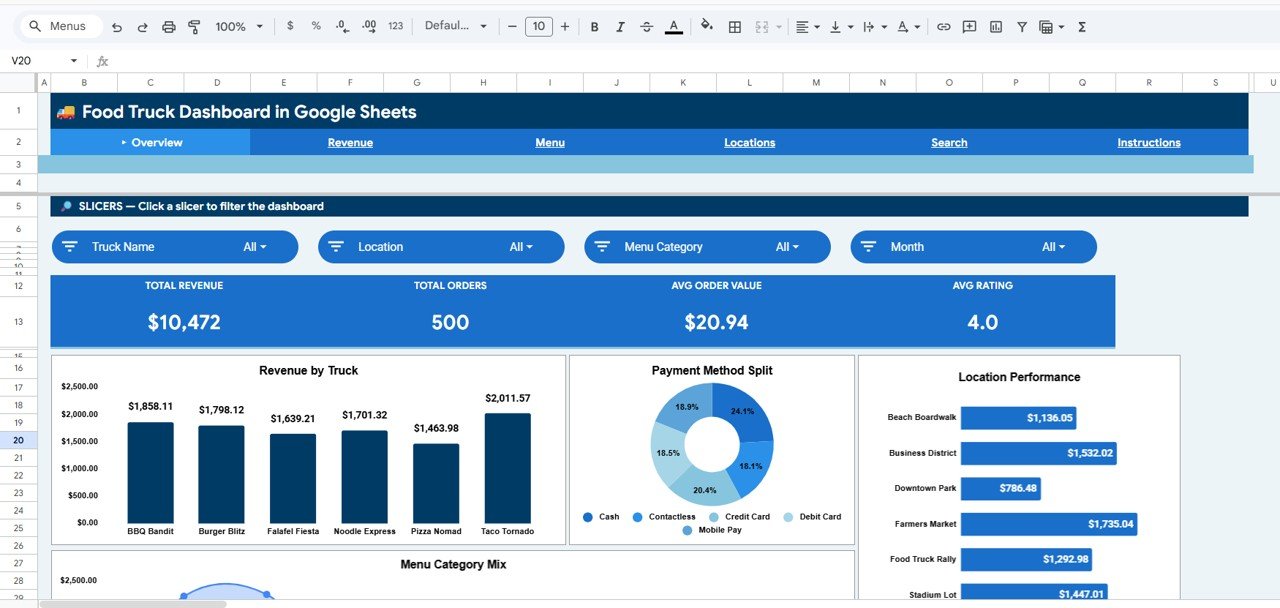
The Overview page is your command center. At the top, 4 KPI cards show Total Revenue, Total Orders, Average Order Value, and Average Rating. Below the cards, 4 analysis charts break down your business: Revenue by Truck shows which truck generates the most income, Payment Method Split tracks cash versus card versus mobile payments, Location Performance compares revenue across your serving locations, and Menu Category Mix shows the revenue share of each food category. Multiple slicers at the top let you filter the entire page instantly.
 Food Truck Dashboard in Google Sheets
2. Revenue Analysis
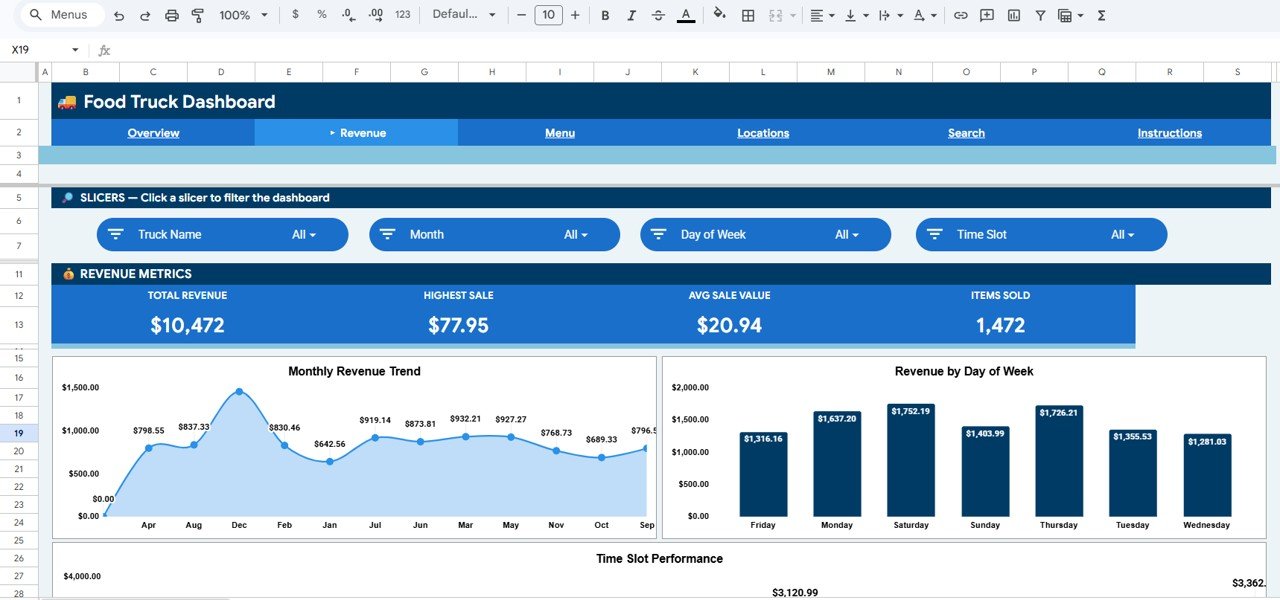
The Revenue Analysis page digs deeper into your earnings. Monthly Revenue Trend shows how your income fluctuates over time — useful for identifying seasonal dips and planning promotions. Revenue by Day of Week highlights your busiest days so you can optimize staffing and location choices. Time Slot Performance breaks sales into morning, lunch, afternoon, and evening windows to help you decide which hours to operate.
 Revenue Analysis
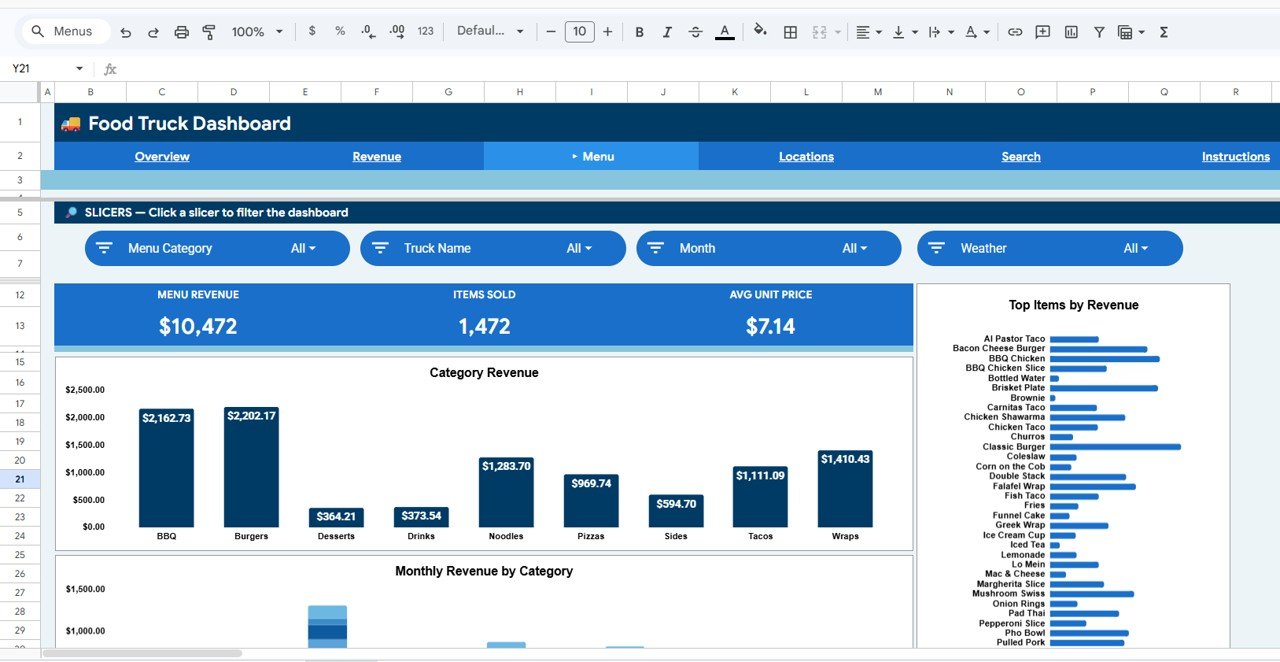
3. Menu Analysis
The Menu Analysis page helps you understand which items sell and which don’t. Category Revenue compares food categories (tacos, burgers, drinks, desserts, etc.) by total revenue. Top Items by Revenue ranks individual menu items so you can spotlight best-sellers. Monthly Revenue by Category reveals seasonal shifts in customer preferences — if dessert sales spike in summer and drop in winter, you’ll see it here.
 Menu Analysis
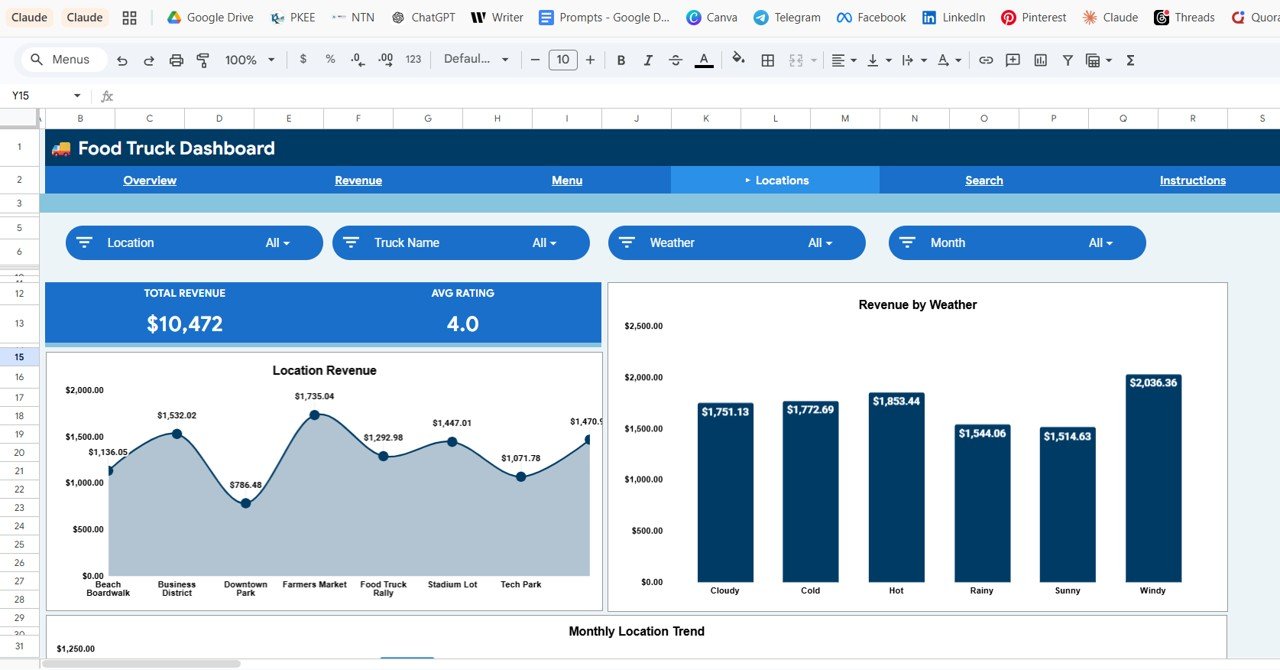
4. Location Analysis
Location is everything for food trucks. The Location Revenue chart ranks your serving spots by income. Revenue by Weather shows whether rain, sun, or overcast conditions help or hurt your sales. Monthly Location Trend tracks each location’s performance over time, making it easy to spot which spots are gaining or losing traction. This data helps you make smarter routing and scheduling decisions.
 Location Analysis
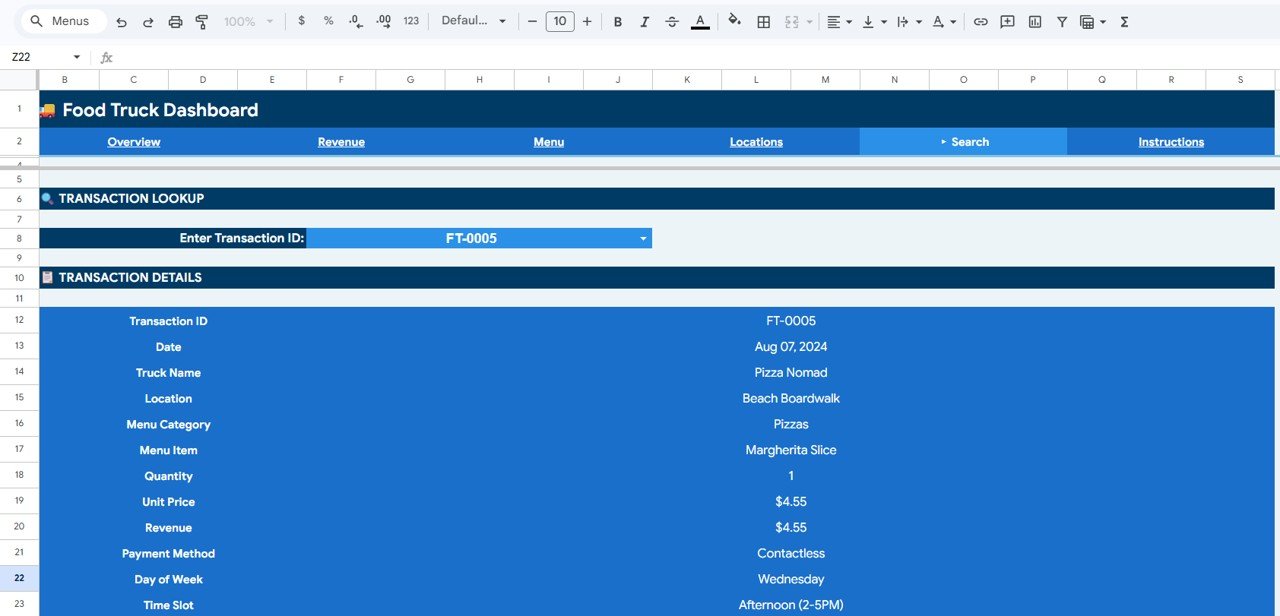
5. Search Page
The Search page provides a Transaction Lookup feature. Select a Transaction ID from the dropdown, and the page displays all details for that transaction: Transaction ID, Date, Truck Name, Location, Menu Category, Menu Item, Quantity, Unit Price, Revenue, Payment Method, Day of Week, Time Slot, Customer Rating, and Weather. This is useful for investigating specific orders or resolving customer complaints.
 Search Sheet Tab
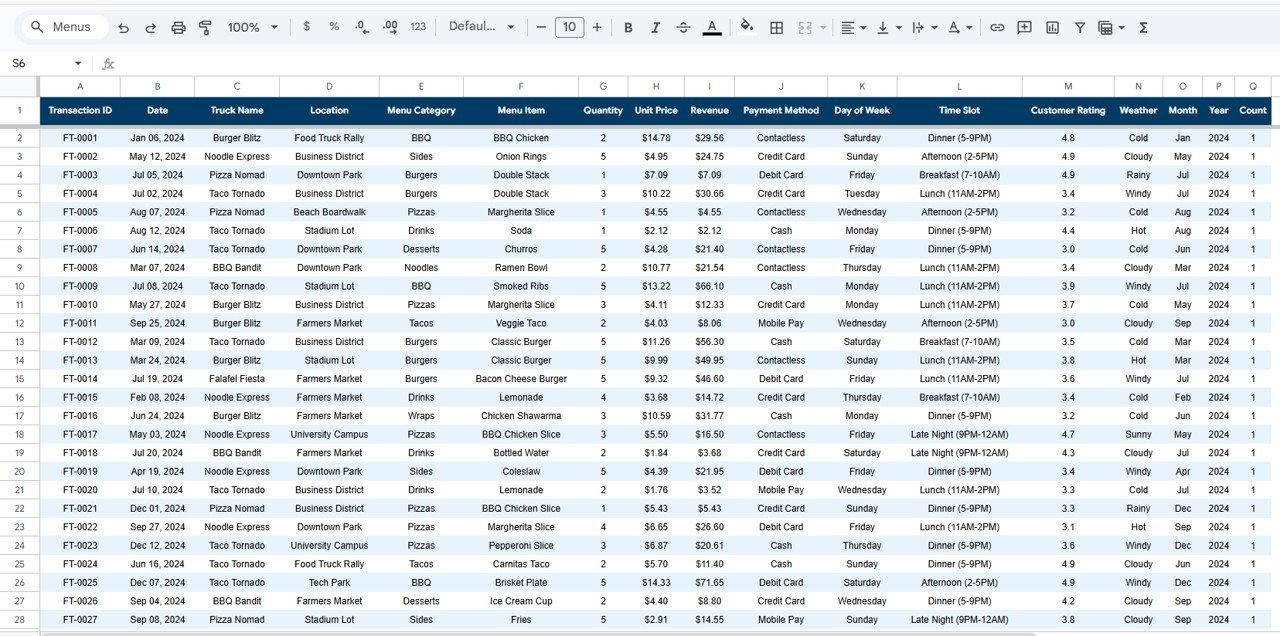
6. Data Sheet
The Data sheet holds all your transaction records. 500 sample rows are pre-loaded with realistic food truck data. Replace them with your own data in the same column format and every dashboard page updates automatically. Columns include Transaction ID, Date, Truck Name, Location, Menu Category, Menu Item, Quantity, Unit Price, Revenue, Payment Method, Day of Week, Time Slot, Customer Rating, and Weather.
 Data Sheet Tab
Food Truck Dashboard in Google Sheets vs. Microsoft Excel Dashboard vs. Square for Restaurants — Feature Comparison
| Feature | Food Truck Dashboard in Google Sheets | Excel Food Truck Dashboard | Square for Restaurants |
|---|---|---|---|
| Cost | $9.99 one-time | $9.99–$14.99 one-time | $60/month + processing fees |
| Platform | Google Sheets (browser-based) | Microsoft Excel (desktop) | Web + mobile app |
| Setup Time | Under 10 minutes | 10–15 minutes | 1–2 hours |
| Real-Time Team Collaboration | ✅ Built-in (Google Sheets) | ❌ Requires OneDrive | ✅ Yes |
| Mobile Access | ✅ Google Sheets app | Limited on mobile | ✅ Full mobile app |
| Customizable Fields | ✅ Fully editable | ✅ Fully editable | Limited to plan |
| Share with Link | ✅ One-click sharing | ❌ Need to send file | ✅ Yes |
| Year-1 Cost (3 users) | $9.99 total | $9.99 + Excel license | $720+ per year |
| Weather Impact Analysis | ✅ Built-in | Requires custom setup | ❌ Not available |
For food truck owners who want location-level revenue analytics without paying $60+/month for Square reporting, the Food Truck Dashboard in Google Sheets sits in the sweet spot.
Who Should Use This Template
📊 Click here to Purchase Food Truck Dashboard in Google Sheets
Perfect for:
- Food truck owners and operators tracking revenue across 1–10 trucks
- Mobile food business managers analyzing menu performance and location profitability
- Food truck fleet operators who need team-shared dashboards without per-user SaaS fees
- Street food vendors and pop-up restaurant owners making data-driven location decisions
- Catering truck operators who share financials with accountants and partners via link
Not a fit if:
- You need POS-integrated real-time inventory management for a restaurant chain
- You need automated order processing or payment gateway integration on the truck
- You need mobile-first live data entry while serving customers (this is a reporting dashboard)
Real-World Use Cases
Marco runs a fleet of 3 taco trucks in Austin. He uses the Food Truck Dashboard in Google Sheets to compare daily revenue across trucks and locations. The Location Analysis page showed him that his downtown spot earned 40% more on rainy days than his park location — so he rerouted his fleet and increased weekly revenue by $800.
Priya operates a single dessert truck in Portland. She uses the Menu Analysis page to identify which items drive the most revenue per category. After dropping two low-performing items and promoting her top seller, average order value jumped from $8.50 to $11.20 within a month.
Jake and Lisa co-own a food truck catering business in Denver. They share the Google Sheets dashboard with their accountant and event coordinator via link. The Revenue by Day of Week chart helps them decide which events to book, and the Payment Method Split tracks their cash-to-card ratio for tax planning.
Advantages of Food Truck Dashboard in Google Sheets
- Zero recurring costs — $9.99 one-time versus $60–$150/month for Square, Toast, or other restaurant SaaS platforms
- Built-in collaboration — Share with unlimited team members via link; no per-seat charges
- Weather impact tracking — A rare feature not found in most food truck software; correlate weather conditions with revenue
- No technical skills needed — Pre-built charts, slicer filters, and formulas mean zero setup beyond pasting data
- Works on any device — Browser-based through Google Sheets; accessible on desktop, tablet, and phone
Opportunities for Improvement
📊 Click here to Purchase Food Truck Dashboard in Google Sheets
- The dashboard does not connect to POS systems — data must be entered or exported manually into the Data sheet
- Google Sheets performance may slow with very large datasets (10,000+ rows); for high-volume operations, consider the Excel or Power BI version
- No automated email alerts or notifications — you need to check the dashboard manually for updates
- The template is designed for reporting and analysis, not for live order-taking or customer-facing use
Best Practices
- Update data weekly — Export your transaction records from your POS or notebook and paste into the Data sheet every week for accurate trending
- Use slicers for team meetings — During weekly reviews, filter the Overview page by individual truck to compare performance side-by-side
- Leverage weather data — Track weather conditions for each selling day and use the Location Analysis page to identify weather-dependent revenue patterns
- Share read-only copies — Give your accountant and partners view-only access via link to prevent accidental edits
- Back up regularly — Google Sheets auto-saves, but keep a monthly backup copy using File > Make a copy
Explore Relevant Templates
📊 Church Finance Dashboard in Google Sheets — Track donations, expenses, and fund balances with interactive charts and filters.
📊 Tax Compliance KPI Dashboard in Google Sheets — Monitor tax filing status, compliance rates, and deadlines.
📊 Expense Management KPI Dashboard in Google Sheets — Analyze spending patterns, budget variance, and approval workflows.
📊 Browse All Google Sheets Dashboard Templates
Frequently Asked Questions
📊 Click here to Purchase Food Truck Dashboard in Google Sheets
How many KPIs does the Food Truck Dashboard in Google Sheets track?
The Food Truck Dashboard in Google Sheets tracks 4 key performance indicators: Total Revenue, Total Orders, Average Order Value, and Average Rating. All metrics update automatically when you replace the sample data with your own food truck transactions.
Can I track multiple food trucks in one dashboard?
Yes. The Food Truck Dashboard in Google Sheets includes a Truck Name column in the Data sheet. Add data for all your trucks, then use slicer filters on the Overview page to view individual truck performance or the entire fleet at once.
How does this compare to Square for Restaurants?
Square for Restaurants costs $60+/month plus processing fees. The Food Truck Dashboard in Google Sheets is a $9.99 one-time purchase with no recurring costs. Square offers POS integration; this dashboard focuses on analytics, reporting, and location-level revenue tracking.
Do I need any Google Sheets skills to use this?
No advanced skills required. The Food Truck Dashboard in Google Sheets comes pre-built with formulas, charts, and slicer filters. Just replace the 500 sample rows in the Data sheet with your own data. An Instructions sheet is included for guidance.
Can I customize the charts and add new menu categories?
Yes. The Food Truck Dashboard in Google Sheets is fully editable. Add new menu categories, modify chart ranges, change colors, and add columns. All formulas and charts reference the Data sheet dynamically.
Does this dashboard work on mobile?
Yes. Since it runs in Google Sheets, you can view the Food Truck Dashboard on any device using the Google Sheets app. Slicer filters and charts render on tablets and phones, though desktop provides the best editing experience.
How long does setup take?
Setup takes under 10 minutes. Download the PDF guide, click the copy link to add the template to your Google Drive, then paste your food truck data into the Data sheet. All 6 dashboard pages update automatically.
About the Author
Built by PK — Microsoft Certified Professional with 15+ years of Excel, Google Sheets, and Power BI experience. Founder of NextGenTemplates, reaching 300K+ subscribers across YouTube channels. Every template is hand-built and tested before release.
Conclusion
The Food Truck Dashboard in Google Sheets gives food truck owners and fleet managers a ready-made analytics tool that tracks revenue, menu performance, location profitability, and weather impact across 6 interactive pages. At $9.99 one-time with no recurring costs, it replaces the reporting features of $60+/month platforms like Square for Restaurants.
📊 Click here to Purchase Food Truck Dashboard in Google Sheets
✅ Instant download · One-time payment · No subscription
For more Google Sheets tutorials and templates, visit Google Sheets Help Center for official documentation.
🎥 Youtube.com/@NeoTechNavigators