The average medical practice generates over 200 patient visits per week, yet most small-to-mid clinics still rely on paper registers or disconnected spreadsheets to track revenue, appointments, and patient demographics. The Medical Practice Dashboard in Google Sheets consolidates 4 KPIs, 10+ charts, and interactive slicers across 6 structured pages — giving clinic administrators a single, shareable analytics hub that updates in real time. Setup takes under 10 minutes: replace the sample data with your own records and every chart, card, and slicer refreshes automatically.
🌍 Over 8,400 teams in 40+ countries use NextGenTemplates to replace paid SaaS subscriptions with one-time-purchase Google Sheets, Excel, Power BI, and HTML templates.
✅ Instant download · One-time payment of $9.99 · No subscription · No per-user fees · Lifetime access
Key Features of the Medical Practice Dashboard in Google Sheets
👉 Click here to Purchase the Medical Practice Dashboard in Google Sheets
The Medical Practice Dashboard in Google Sheets delivers a full practice analytics suite across 6 interactive pages. Here is what each section tracks and why it matters for clinic management.
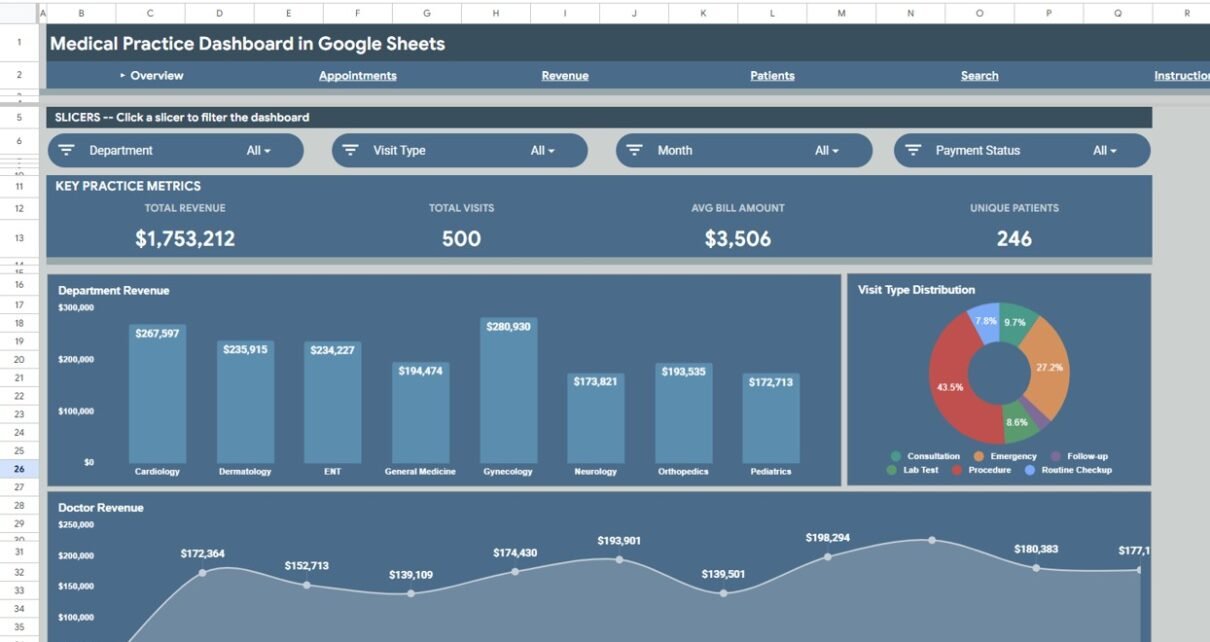
Four KPI Summary Cards — The Overview page opens with Total Revenue, Total Visits, Avg Bill Amount, and Unique Patients displayed as card-style KPIs. Practice owners get an instant performance snapshot without scrolling through rows of raw data.
Department Revenue by Department — A dedicated chart breaks down income by specialty (Cardiology, Orthopedics, Dermatology, General Medicine, etc.), letting administrators identify the most profitable departments and spot underperforming areas that need attention.
Visit Type Distribution by Visit Type — Shows the split between walk-in visits, scheduled appointments, follow-ups, and emergency consultations. Front-desk teams use this to optimize scheduling workflows and balance provider workload across visit categories.
Doctor Revenue by Doctor — Compares revenue generated by each physician in the practice. Multi-provider clinics use this to benchmark individual performance, plan bonus structures, and allocate patient assignments effectively.
Interactive Slicers — Multiple slicer controls let users filter the entire Overview dashboard by department, doctor, visit type, or time period with a single click. Every chart and KPI card responds to slicer selections in real time.
Instant Visit Lookup — The Search sheet allows you to enter any Visit ID and instantly retrieve all related details — visit date, patient name, age, gender, department, doctor, visit type, diagnosis, and treatment — without scrolling through the full data sheet.
Plug-and-Play Data Sheet — The structured Data sheet accepts your clinic records in a standardized format. Replace sample data and all 6 pages refresh automatically through pivot tables and formulas.
Dashboard Pages Explanation
1. Overview Page
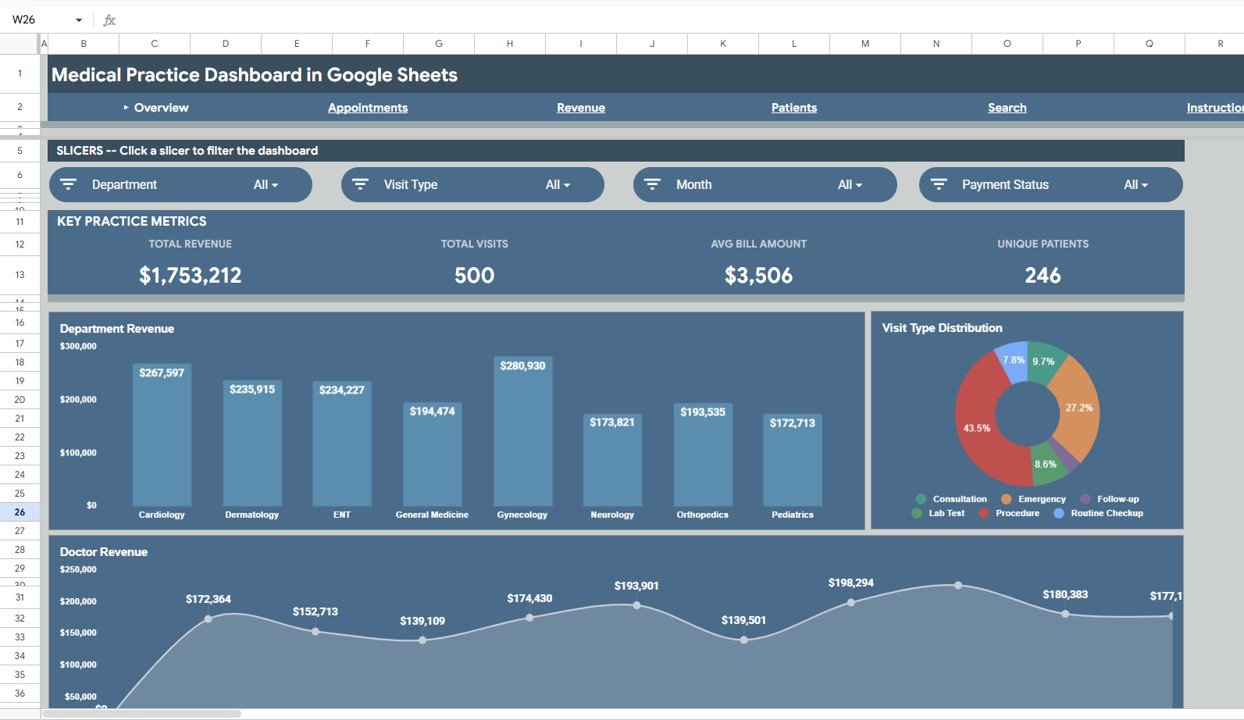
The Overview page serves as the main landing view of the Medical Practice Dashboard in Google Sheets. At the top, 4 KPI cards display Total Revenue, Total Visits, Avg Bill Amount, and Unique Patients. Below, three analysis charts provide visual breakdowns: Department Revenue by Department, Visit Type Distribution by Visit Type, and Doctor Revenue by Doctor. Multiple slicers on this page let you filter the entire view by department, doctor, visit type, or period.
Medical Practice Dashboard in Google Sheets – Overview Page
2. Appointments Page
The Appointments page dives deeper into visit-level analytics. It features Visits by Type showing both count and revenue by visit type, Monthly Visit Volume tracking trends over time, and Doctor Visit Count comparing appointment loads across physicians. Clinic managers use this page to identify seasonal patterns and balance scheduling loads.
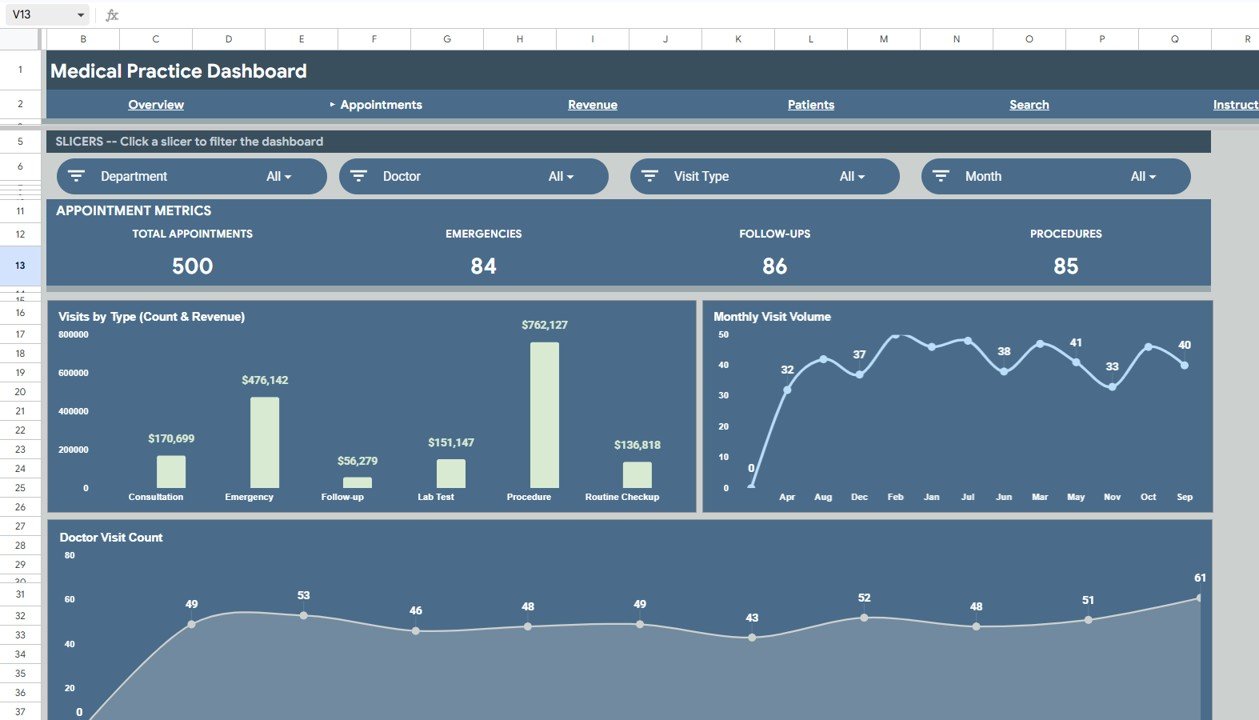
Appointments Analysis Page
3. Revenue Page
The Revenue page provides financial deep-dive analytics. It includes Payment Method Split by Payment Method, Monthly Revenue by Month, Insurance Provider Revenue by Insurance Provider, and Payment Status by Department. Finance teams use this to identify outstanding balances, track collection rates, and optimize billing processes across departments.
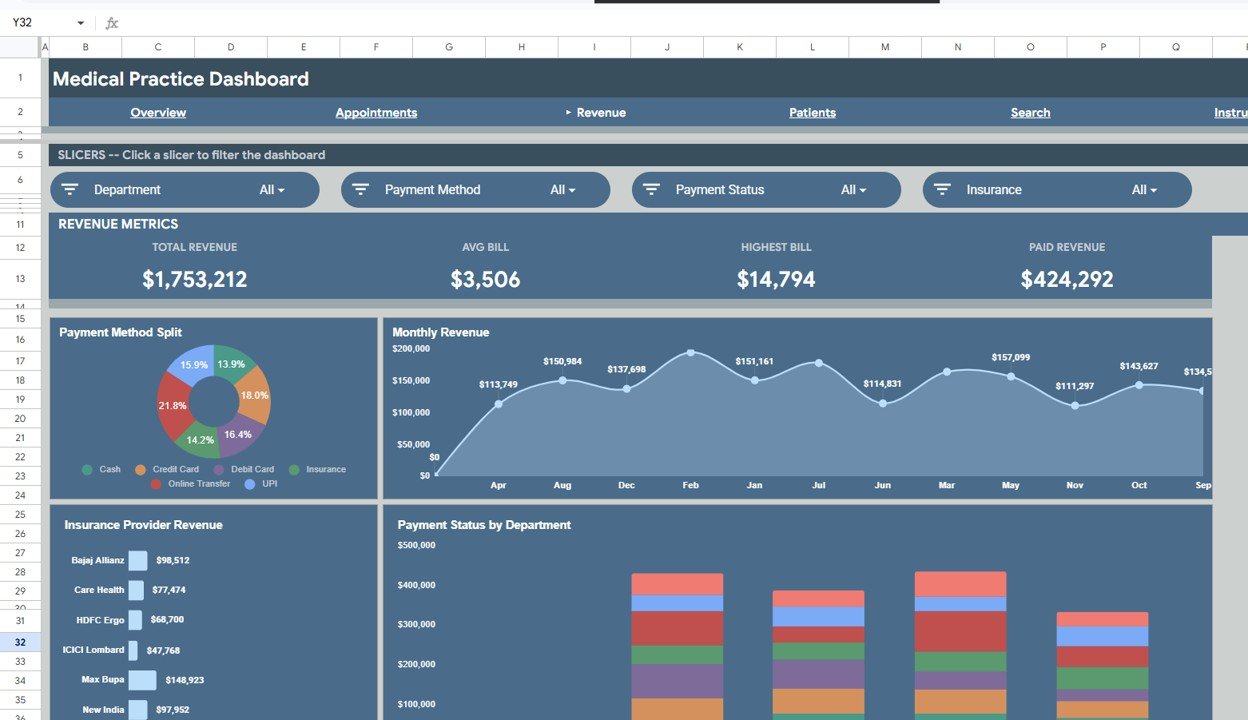
Revenue Analysis Page
4. Patients Page
The Patients page focuses on demographics and clinical patterns. It visualizes Patients by Gender, Diagnosis Frequency by Diagnosis, Treatment Distribution by Treatment, and Department by Gender cross-analysis. This page supports population health management and clinical resource planning.

Patient Demographics Page
5. Search Sheet
The Search sheet lets you enter a Visit ID and instantly view all the related visit details such as Visit Date, Patient Name, Age, Gender, Department, Doctor, Visit Type, Diagnosis, and Treatment. This makes it easy to quickly look up any patient visit without scrolling through the full data sheet.
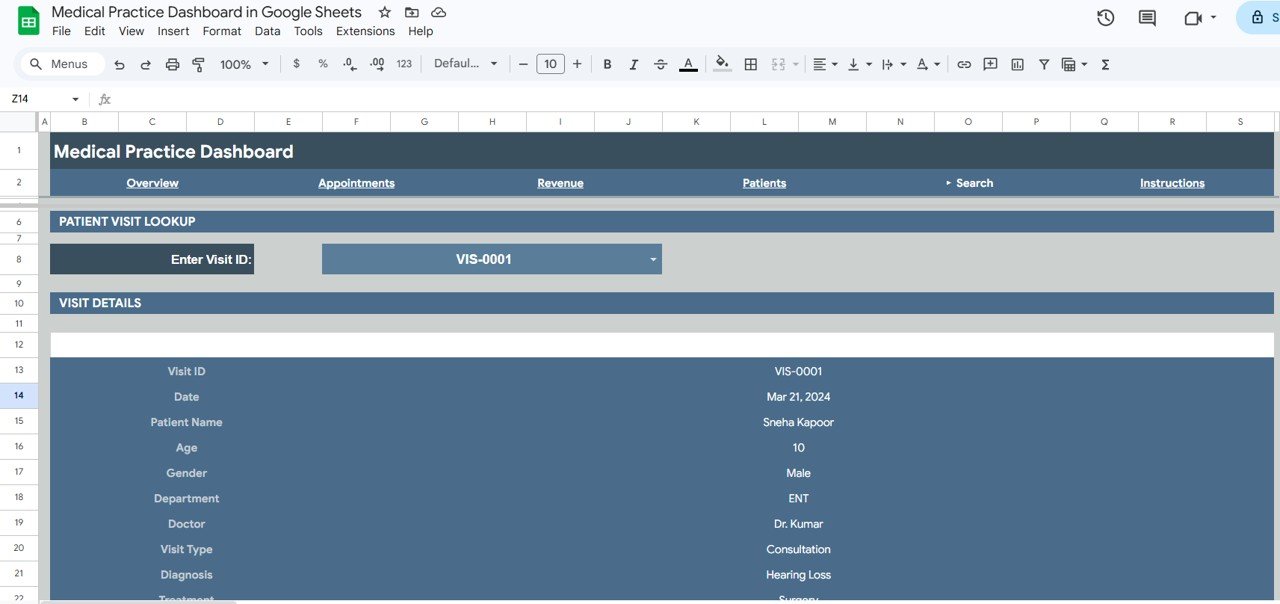
Search Sheet Tab
6. Data Sheet
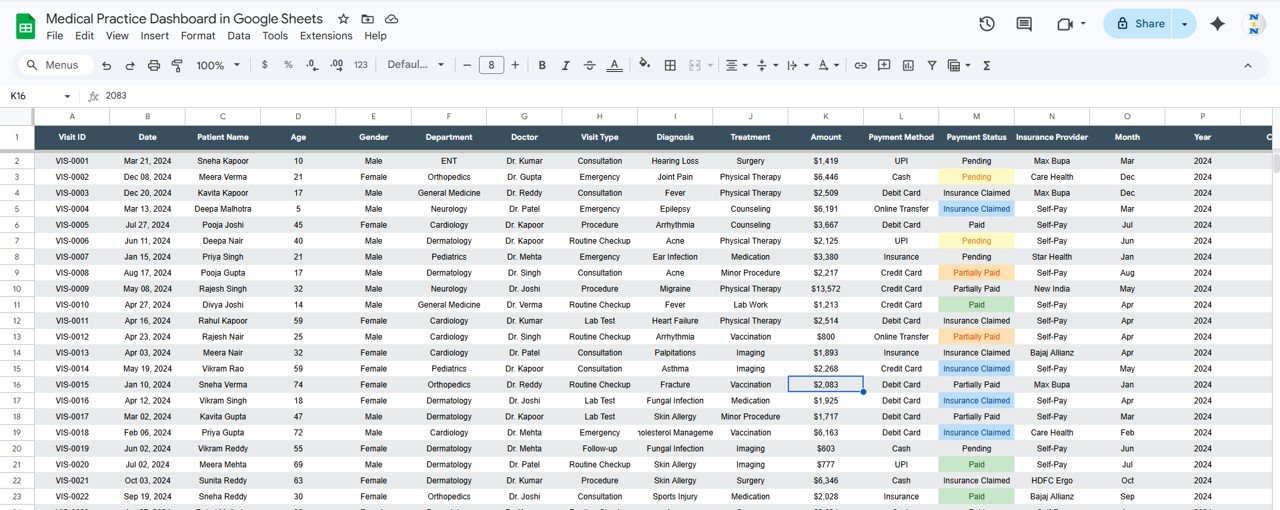
This is the Data sheet where you add your clinic records in the same format as the sample data. Columns include Visit ID, Visit Date, Patient Name, Age, Gender, Department, Doctor, Visit Type, Diagnosis, Treatment, Bill Amount, Payment Method, Insurance Provider, and Payment Status. All dashboard pages pull from this single source.
Data Sheet Tab
Medical Practice Dashboard in Google Sheets vs. Microsoft Excel Dashboard vs. Athenahealth — Feature Comparison
| Feature | Medical Practice Dashboard in Google Sheets | Microsoft Excel Dashboard | Athenahealth |
|---|---|---|---|
| Cost | $9.99 one-time | $17.99 one-time (Excel version) | $140+ / provider / month |
| Platform | Google Sheets (free, browser-based) | Requires MS Excel license | Cloud SaaS |
| Setup Time | Under 10 minutes | Under 10 minutes | 4-8 weeks onboarding |
| Real-Time Team Collaboration | ✅ Built-in (Google Sheets) | Limited (OneDrive required) | ✅ Yes |
| Mobile Access | ✅ Google Sheets app | Limited via Excel mobile | ✅ Mobile app |
| Customizable Fields | ✅ Fully editable | ✅ Fully editable | Limited to plan tier |
| Share with Link | ✅ One-click sharing | ❌ Requires file transfer | Role-based access only |
| Year-1 Cost at 5 Providers | $9.99 total | $17.99 total | $8,400+ |
| EHR Integration | ❌ Manual data entry | ❌ Manual data entry | ✅ Native EHR |
For clinics that want clear revenue, appointment, and patient analytics without paying $140+ per provider per month, the Medical Practice Dashboard in Google Sheets sits in the sweet spot.
Who Should Use This Template
👉 Click here to Purchase the Medical Practice Dashboard in Google Sheets
✅ Perfect for:
- Private practice owners and clinic administrators managing 1-10 providers
- Medical office managers tracking appointments, revenue, and patient demographics weekly
- Small multi-specialty clinics needing a visual snapshot of daily operations
- Healthcare consultants delivering practice performance reports to clients
- Medical billing teams monitoring payment status and insurance collections
❌ Not a fit if:
- You manage a hospital or large health system requiring HIPAA-compliant EHR integration
- Your practice needs automated insurance claims processing and e-prescriptions
- You need real-time patient portal or telehealth features built into the dashboard
Real-World Use Cases
Dr. Priya runs a 4-doctor family medicine clinic in Hyderabad. She uses the Medical Practice Dashboard in Google Sheets to compare monthly revenue across her physicians, track which departments generate the highest income, and present quarterly performance summaries to her partners — all without paying per-provider fees for practice management software.
James manages operations at a dental-and-dermatology group practice in Austin. He replaced a $200/month reporting add-on with this dashboard. Each Monday, he filters by department using the slicers to review the previous week’s visit volume and revenue, then shares the Google Sheets link with the practice owner for instant visibility.
Fatima is a healthcare consultant in Dubai. She downloads the template for each client engagement, populates it with the clinic’s data, and delivers a polished performance dashboard within hours. The one-time $9.99 cost makes it a negligible line item compared to her consulting fee.
Advantages of the Medical Practice Dashboard in Google Sheets
👉 Click here to Purchase the Medical Practice Dashboard in Google Sheets
Zero software cost — Google Sheets is free for anyone with a Google account. The dashboard template costs $9.99 one-time with no recurring fees, making it accessible for solo practitioners and small clinics operating on tight budgets.
Real-time collaboration — Unlike Excel files that need to be emailed back and forth, Google Sheets allows multiple team members to view and edit simultaneously. Front-desk staff can enter visit data while the practice manager reviews analytics on another device.
Mobile-ready — Access the dashboard from any smartphone or tablet through the Google Sheets app. Clinic owners can check KPIs between patient appointments without sitting at a desktop.
No technical skills needed — The template uses pivot tables and formulas that update automatically. Users only need to paste data into the Data sheet — no coding, no macros, no add-ons required.
Shareable analytics — Generate a view-only or edit link to share dashboards with partners, accountants, or consultants. Access permissions are controlled through Google’s built-in sharing settings.
Opportunities for Improvement
No EHR integration — Data must be entered manually or exported from your practice management system. Clinics with high patient volumes may find this tedious compared to fully integrated platforms like Athenahealth.
Limited to structured data — The dashboard works with the predefined column structure. Adding custom fields (e.g., lab results, imaging orders) requires modifying the Data sheet and potentially adjusting formulas.
No appointment scheduling — This is an analytics and reporting tool, not a scheduling or booking system. Practices still need a separate appointment scheduler.
Slicer limitations — Google Sheets slicers are less flexible than Power BI or Excel slicers when handling very large datasets (10,000+ rows). Performance may slow with extremely large clinics.
Best Practices
👉 Click here to Purchase the Medical Practice Dashboard in Google Sheets
Update data weekly — Export visit records from your practice management system every Friday and paste them into the Data sheet. Consistent data entry ensures accurate trend analysis on the monthly charts.
Use slicers for meetings — During weekly team huddles, use the Overview slicers to filter by each department or doctor. This keeps discussions focused and data-driven.
Archive monthly snapshots — Duplicate the sheet at month-end and rename it (e.g., “March 2026”). This preserves historical data for year-over-year comparisons.
Restrict edit access — Share the dashboard as “view only” with non-admin staff. Only grant edit access to the person responsible for data entry to prevent accidental formula changes.
Pair with the Excel or Power BI version — If your practice grows beyond 10 providers, consider upgrading to the Medical Practice Dashboard in Excel or the Medical Practice Dashboard in Power BI for more advanced filtering and larger dataset handling.
Explore Relevant Templates
🔹 Medical Practice Dashboard in Excel — Same analytics in Microsoft Excel format with pivot tables and slicers.
🔹 Medical Practice Dashboard in Power BI — Advanced interactive version with drill-through pages and DAX measures.
🔹 Hospital Patient Flow Dashboard in Google Sheets — Track admissions, discharges, bed occupancy, and wait times.
🔹 Veterinary Clinic Dashboard in Google Sheets — Tailored for animal care clinics tracking appointments and revenue.
🔹 Billing Accuracy KPI Dashboard in Google Sheets — Track billing errors, claim denials, and collection rates.
💎 Save 38% — Get all 8 Healthcare templates in the Healthcare & Hospital Management Bundle →
Also available as: Excel version | Power BI version
Browse all Google Sheets Dashboard Templates
Frequently Asked Questions
👉 Click here to Purchase the Medical Practice Dashboard in Google Sheets
What KPIs does the Medical Practice Dashboard in Google Sheets track?
The Medical Practice Dashboard in Google Sheets tracks 4 primary KPIs: Total Revenue, Total Visits, Avg Bill Amount, and Unique Patients. These cards sit on the Overview page and update automatically when you replace the sample data with your own clinic records.
Can I filter the dashboard by specific departments or doctors?
Yes. The Overview page includes interactive slicers that let you filter all charts and KPI cards by department, doctor, visit type, or time period. Each slicer applies instantly across the entire page without editing any formulas.
How does this compare to Athenahealth or Kareo?
Athenahealth starts at $140+ per provider per month and requires weeks of onboarding. The Medical Practice Dashboard in Google Sheets costs $9.99 one-time with setup under 10 minutes. It lacks EHR integration but delivers the core analytics small practices need at a fraction of the cost.
Is this template HIPAA compliant?
Google Sheets can be configured for HIPAA compliance under a Google Workspace Business or Enterprise plan with a BAA in place. The template itself does not store or transmit PHI — data security depends on your Google Workspace configuration and internal policies.
How long does setup take?
Setup takes under 10 minutes. Open the PDF guide included in your download, click the copy link to create your own editable copy in Google Drive, and replace the sample data on the Data sheet. All 6 pages refresh automatically.
Can I add more departments or doctors to the dashboard?
Yes. Simply add new rows to the Data sheet with your additional departments or doctor names. The pivot tables, slicers, and charts expand automatically to include any new entries without extra configuration.
Does this work on mobile devices?
Yes. Google Sheets runs in any browser and through the free Google Sheets mobile app on iOS and Android. Charts render and slicers function on mobile, though the desktop experience offers the best viewing layout for detailed analytics. Learn more about Google Sheets on mobile.
About the Author
Built by PK — Microsoft Certified Professional with 15+ years of Excel, Google Sheets, and Power BI experience. Founder of NextGenTemplates, reaching 300K+ subscribers across YouTube channels. Every template is hand-built and tested before release.
Conclusion
The Medical Practice Dashboard in Google Sheets gives small-to-mid clinics the revenue, appointment, patient, and doctor performance analytics they need — without enterprise pricing or weeks of onboarding. Four KPI cards, 10+ charts, interactive slicers, and a visit search sheet make it a complete practice analytics tool at $9.99.
👉 Click here to Purchase the Medical Practice Dashboard in Google Sheets
✅ Instant download · One-time payment · No subscription
🎥 Youtube.com/@NeoTechNavigators