The Wealth Management KPI Dashboard in Google Sheets tracks performance across 6 structured worksheets, covering MTD and YTD actuals, targets, previous year comparisons, and trend analysis for every KPI you define. With conditional formatting arrows, dropdown-driven month selection, and dedicated input sheets for actuals, targets, and prior year data, it replaces scattered spreadsheets with a single organized view of your wealth management performance.
Financial advisors, portfolio managers, and family offices frequently spend hours manually compiling investment performance data from multiple sources. This template eliminates that overhead by centralizing all KPI tracking in one Google Sheets file that updates automatically when you enter monthly numbers. Below is a detailed walkthrough of every feature, sheet, and use case.
Key Features of Wealth Management KPI Dashboard in Google Sheets
The Wealth Management KPI Dashboard in Google Sheets includes 6 worksheets with built-in formulas, trend charts, and conditional formatting. Here are the defining features that set it apart:
- Month-Driven Dashboard — Select any month from the dropdown on cell D3 and the entire dashboard recalculates all KPI values for MTD and YTD.
- Dual Performance Comparison — Every KPI shows Target vs Actual and Previous Year vs Actual with conditional formatting arrows indicating improvement or decline.
- KPI Trend Analysis Sheet — Pick any KPI from a dropdown on cell C3 to view its definition, formula, measurement unit, KPI type (LTB or UTB), and MTD/YTD trend charts.
- Structured 3-Sheet Data Input — Separate sheets for Actual Numbers, Target Numbers, and Previous Year Numbers prevent formula errors and keep data organized.
- KPI Definition Master Sheet — A reference sheet where you define KPI Name, Group, Unit, Formula, Definition, and KPI Type.
- Cloud-Based Collaboration — Built in Google Sheets for real-time multi-user access without version conflicts.
Dashboard Pages Explanation
The template contains 6 worksheets, each serving a specific function in the wealth management KPI tracking workflow.
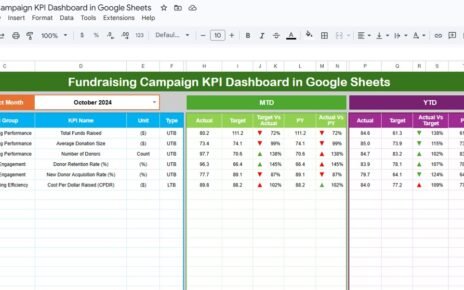
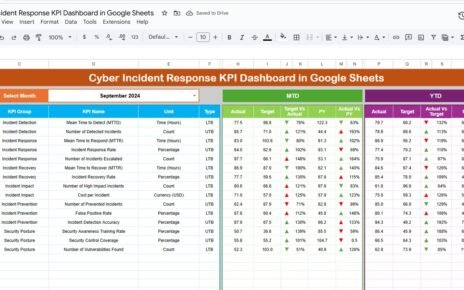
1. Dashboard Sheet
This is the main sheet tab showing all KPIs in one view. On range D3, you can select the month from the drop-down. The entire dashboard numbers change for that selected month. It displays MTD Actual, Target, and Previous Year data along with Target vs Actual and PY vs Actual variance with conditional formatting up/down arrows. The same layout applies to YTD Actual, Target, and Previous Year data with corresponding variance indicators.
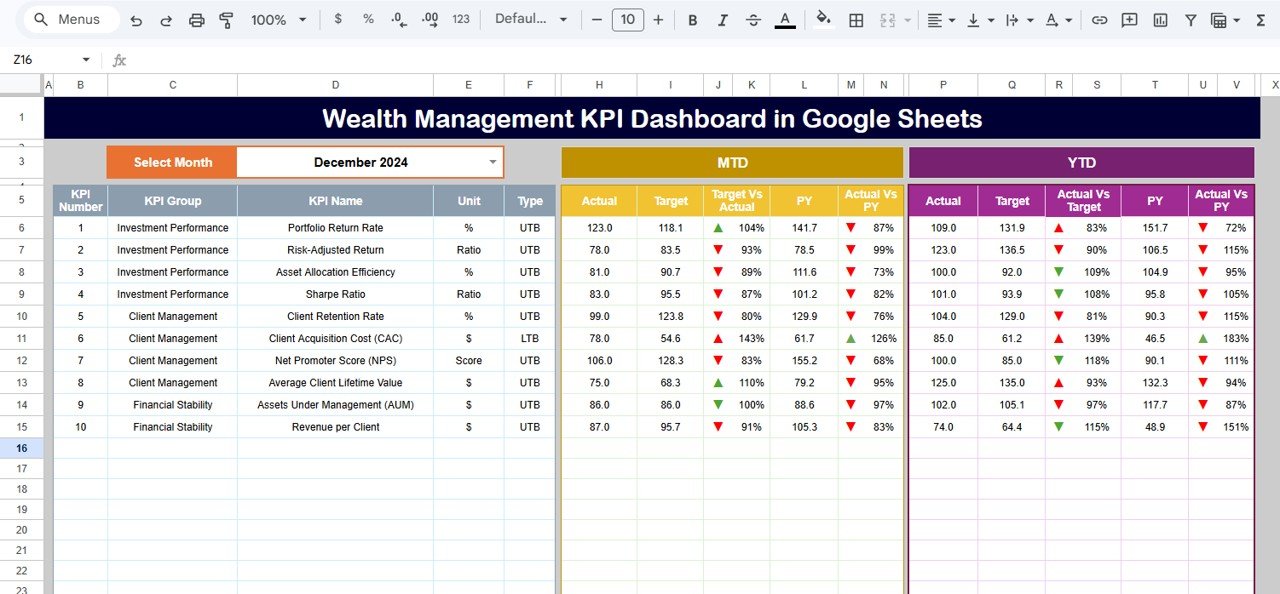 Wealth Management KPI Dashboard in Google Sheets
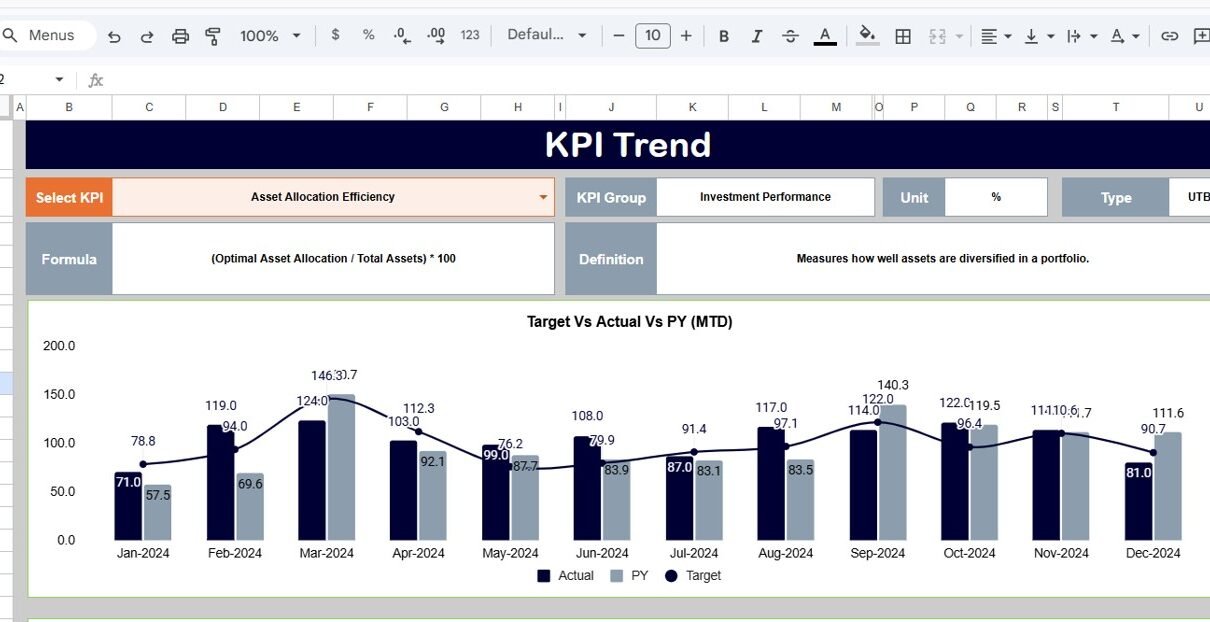
2. KPI Trend Sheet
Here you can select the KPI name from the drop down available on range C3. The sheet displays the KPI Group, Unit of KPI, Type of KPI (Lower the Better or Upper the Better), Formula of the KPI, and Definition of the KPI. It also shows MTD and YTD trend charts for Actual, Target, and PY numbers side by side.
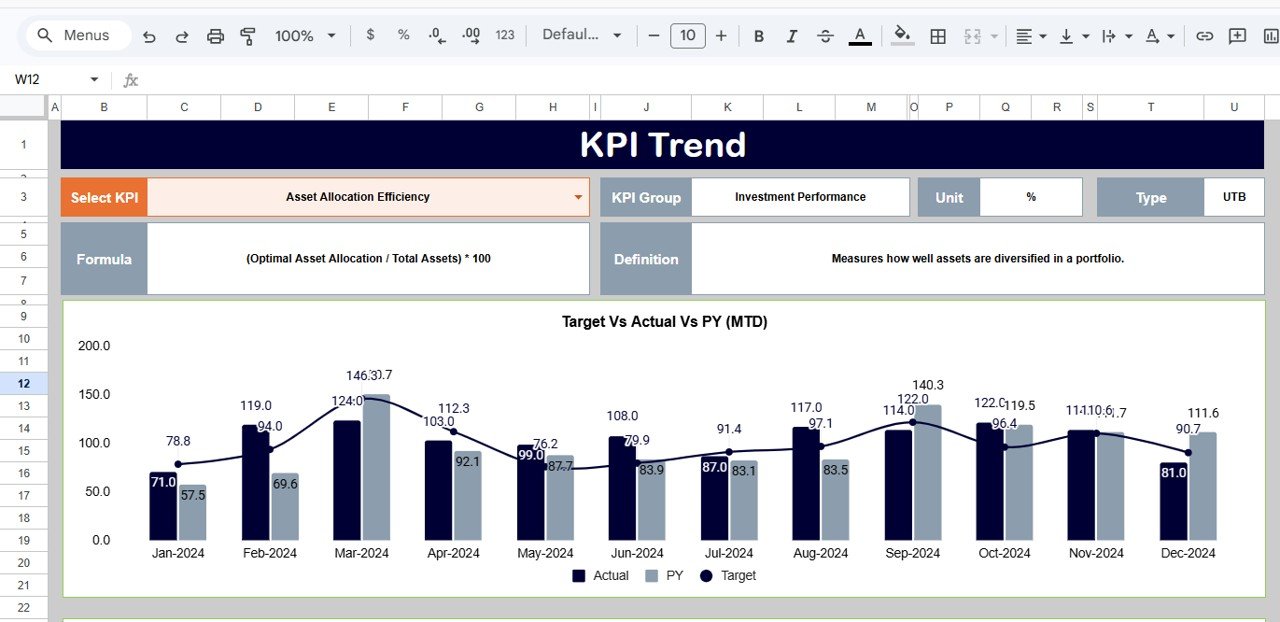 KPI Trend Sheet
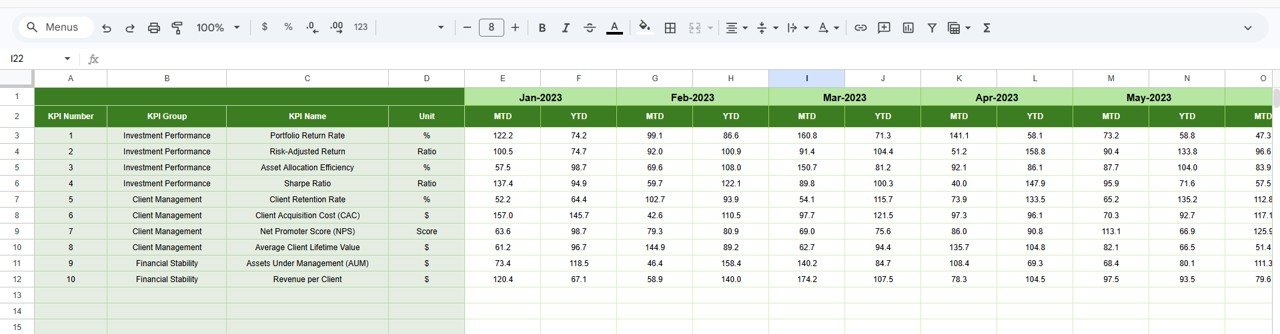
3. Actual Numbers Input Sheet
Here you enter the actual numbers for YTD and MTD for a particular month. You can change the months from range E1 — just input the first month of the year on range E1 and all month headers adjust accordingly.
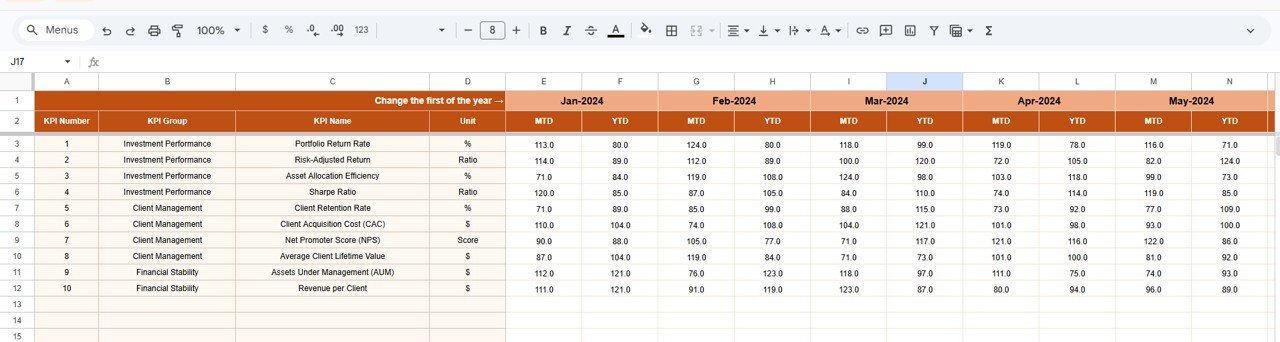 Actual Numbers Input Sheet
4. Target Number Input Sheet
In this sheet tab, you enter the Target numbers for each KPI for every month as MTD as well as YTD. The dashboard uses these values to calculate Target vs Actual variance automatically.
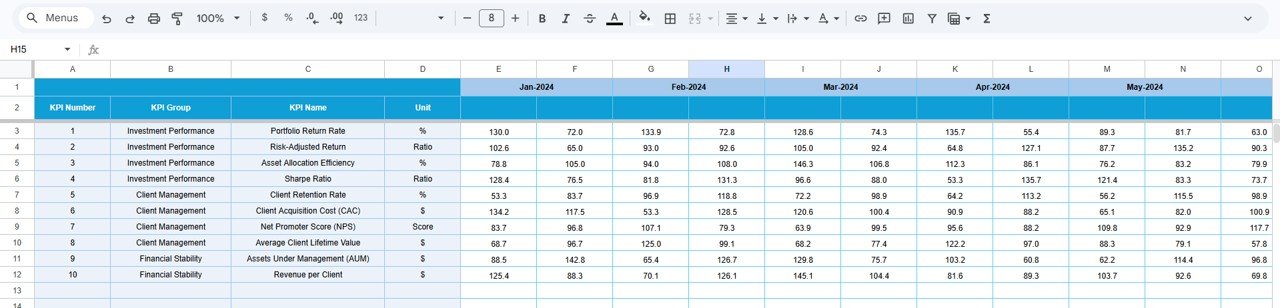 Target Number Input Sheet
5. Previous Year Number Sheet
Enter the previous year numbers in the same format as the current year data. This enables year-over-year comparison on the Dashboard sheet with PY vs Actual conditional formatting arrows.
 Previous Year Number Input Sheet
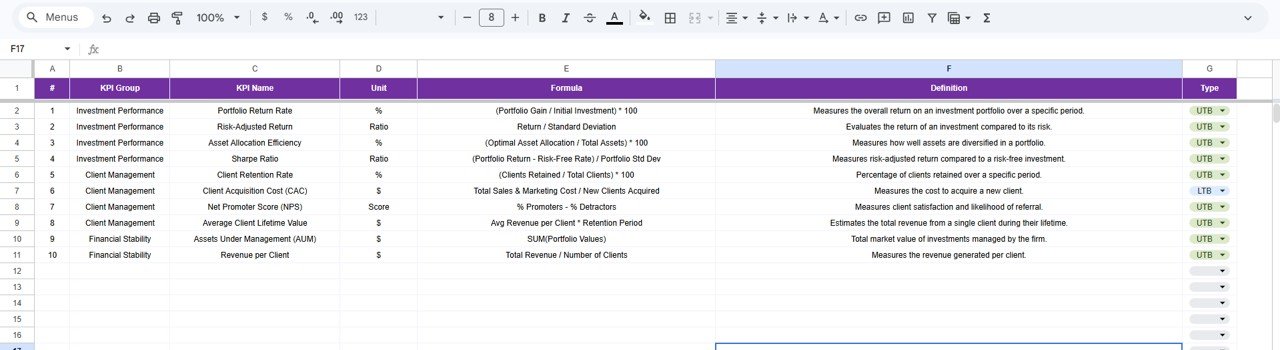
6. KPI Definition Sheet
In this sheet tab, you enter the KPI Name, KPI Group, Unit, Formula, and KPI Definition. In the last column, enter the KPI type as LTB (Lower the Better) or UTB (Upper the Better). This sheet feeds the Trend Sheet with KPI metadata and ensures standardized reporting.
 KPI Definition Sheet
Wealth Management KPI Dashboard vs. Microsoft Excel Dashboard vs. Wealthbox CRM — Feature Comparison
| Feature | Wealth Management KPI Dashboard (Google Sheets) | Microsoft Excel Dashboard | Wealthbox CRM |
|---|---|---|---|
| Cost | $8.99 one-time | Requires Microsoft 365 ($6.99/mo) | $59/user/month |
| Platform | Google Sheets (free) | Desktop Excel | Cloud SaaS |
| Setup Time | Under 10 minutes | 30-60 minutes | 2-5 days |
| Real-Time Team Collaboration | Yes — Built-in | Limited (OneDrive) | Yes |
| Mobile Access | Google Sheets app | Limited | Yes |
| Customizable KPIs | Fully editable | Manual setup required | Fixed modules |
| Share with Link | One click | File sharing only | Yes |
| Year-1 Cost at 5 Users | $8.99 total | $419.40 | $3,540 |
| MTD/YTD Trend Charts | Pre-built | Manual chart setup | Built-in |
For wealth management teams that want structured KPI tracking without paying $59/user/month for CRM software, the Wealth Management KPI Dashboard in Google Sheets sits in the sweet spot.
Who Should Use This Template
Click here to Purchase the Wealth Management KPI Dashboard in Google Sheets
Perfect for:
- Independent financial advisors tracking 10-50 client portfolio KPIs
- Wealth management firms with 2-20 team members who need a shared KPI view
- Family offices monitoring investment performance across asset classes
- Finance students and analysts learning KPI-based portfolio evaluation
Not a fit if:
- You need enterprise-grade compliance features like SOC 2 and SSO integration
- Your workflow requires real-time market data feeds or automated API connections
- You need CRM functionality (client management, email tracking) alongside portfolio KPIs
Real-World Use Cases
David runs a boutique wealth advisory firm with 8 advisors. He uses the Wealth Management KPI Dashboard to track client acquisition cost, AUM growth rate, and portfolio return across the team. Each month, his operations manager inputs actual numbers, and David reviews the dashboard in their Monday meeting — replacing a $59/user/month CRM with an $8.99 spreadsheet.
Priya manages a family office overseeing $12M in assets. She tracks 15 KPIs including Sharpe ratio, asset allocation drift, and fee-to-revenue ratio using this dashboard. The YTD trend charts help her present quarterly performance reports to the family — without hiring an analyst or buying financial software.
Marco is a finance student building his portfolio analysis skills. He uses the KPI Definition sheet to learn how wealth management metrics are calculated and tracks simulated portfolio data across all 12 months. The structured layout teaches him exactly how financial professionals evaluate investment performance.
Advantages of Wealth Management KPI Dashboard in Google Sheets
Click here to Purchase the Wealth Management KPI Dashboard in Google Sheets
- Centralized KPI Monitoring — All wealth management KPIs in one dashboard instead of scattered across multiple files.
- Automatic Calculations — MTD, YTD, variance, and trend calculations are formula-driven. No manual math required.
- Year-Over-Year Comparison — The Previous Year sheet enables instant PY vs Actual analysis with visual indicators.
- Team Collaboration — Multiple users can access and update the dashboard simultaneously via Google Sheets.
- Cost Savings — At $8.99 one-time, it costs 99.7% less than Wealthbox CRM over a 12-month period for a 5-person team.
- No Learning Curve — If your team knows Google Sheets, they can use this dashboard immediately.
Opportunities for Improvement
Click here to Purchase the Wealth Management KPI Dashboard in Google Sheets
- The dashboard does not connect to live market data feeds — KPI values must be entered manually each month.
- There is no built-in client management or CRM functionality — it focuses exclusively on KPI tracking.
- For teams with 50+ KPIs, the single-page dashboard layout may benefit from splitting into category-specific sub-dashboards.
- The template does not include automated email alerts when KPIs fall below target thresholds.
Best Practices
- Define all KPIs in the KPI Definition sheet before entering any numbers — this ensures the dashboard displays meaningful data from the start.
- Update actual numbers within the first 5 business days of each month to maintain reporting consistency.
- Use the KPI Type column (LTB/UTB) correctly — this controls how conditional formatting arrows interpret performance direction.
- Share the dashboard with view-only access for stakeholders and edit access only for data input team members.
- Review the KPI Trend sheet monthly to identify patterns before they become problems.
Explore Relevant Templates
If you found this Wealth Management KPI Dashboard useful, explore these related templates on NextGenTemplates.com:
- Investment Management KPI Scorecard in Google Sheets — Track portfolio return, Sharpe ratio, and investment cost ratios with traffic light indicators.
- Net Worth Tracker in Google Sheets — Monitor assets, liabilities, and net worth growth month-over-month.
- Investment Portfolio Checklist in Google Sheets — Manage investment tasks with progress tracking and deadlines.
Browse all Google Sheets KPI Dashboards for more industry-specific templates.
Frequently Asked Questions
Click here to Purchase the Wealth Management KPI Dashboard in Google Sheets
What KPIs does the Wealth Management KPI Dashboard track?
The Wealth Management KPI Dashboard in Google Sheets tracks any KPI you define — including Assets Under Management growth, portfolio return, client acquisition cost, fee revenue, Sharpe ratio, and asset allocation efficiency. All KPIs update automatically when you enter monthly data.
How long does it take to set up this dashboard?
Setup takes under 10 minutes. Copy the template to your Google Drive, define your KPIs in the KPI Definition sheet, enter target and actual numbers, and the dashboard calculates everything automatically. No formulas or coding needed.
Can I customize the KPIs for my specific wealth management practice?
Yes. The KPI Definition sheet lets you add, remove, or modify any KPI. You control the KPI name, group, unit, formula, definition, and whether it is Lower-the-Better or Upper-the-Better. The dashboard adapts to your definitions.
How does this compare to Wealthbox CRM or Salesforce Financial Cloud?
The Wealth Management KPI Dashboard costs $8.99 one-time versus $59/user/month for Wealthbox or $300+/user/month for Salesforce Financial Cloud. It focuses on KPI tracking and trend analysis rather than full CRM functionality — ideal for teams that need performance monitoring without enterprise software costs.
Can multiple team members access the dashboard simultaneously?
Yes. Built in Google Sheets, the dashboard supports real-time multi-user collaboration. Share it via link or email, and multiple team members can view or edit the data simultaneously without version conflicts.
Does the dashboard support year-over-year comparison?
Yes. The Previous Year Number sheet stores last year’s KPI values. The Dashboard sheet automatically calculates PY vs Actual variance with conditional formatting arrows, giving you instant year-over-year performance visibility.
Is this template suitable for regulatory reporting?
The dashboard is designed for internal KPI monitoring and performance tracking. While it provides structured data for compliance discussions, it is not a regulatory filing tool. You can export data from the sheets to supplement formal regulatory reports.
About the Author
Built by PK — Microsoft Certified Professional with 15+ years of Excel, Google Sheets, and Power BI experience. Founder of NextGenTemplates, reaching 300K+ subscribers across YouTube channels. Every template is hand-built and tested before release.
Conclusion
The Wealth Management KPI Dashboard in Google Sheets delivers structured KPI monitoring for financial advisors, wealth management firms, and family offices at a fraction of the cost of enterprise CRM software. With 6 worksheets covering dashboard views, trend analysis, data input, and KPI definitions, it provides everything needed to track wealth management performance month over month.
Click here to Purchase the Wealth Management KPI Dashboard in Google Sheets
Instant download · One-time payment · No subscription
Visit our YouTube channel for step-by-step tutorials: Youtube.com/@NeoTechNavigators
For more Google Sheets templates and tutorials, visit Google Sheets documentation to learn about advanced features like conditional formatting and data validation.