Warehouse operations account for 20-30% of total supply chain costs for most organizations, yet many warehouse managers still track performance using disconnected spreadsheets and manual reports. The Warehouse Management KPI Scorecard in Google Sheets is a ready-to-use scorecard template that tracks 10+ warehouse KPIs across 4 structured worksheets, with MTD and YTD toggle, Actual vs Target comparison, Previous Year benchmarking, and color-coded visual indicators. Setup takes under 10 minutes — copy the template to Google Drive, replace the sample data, and every scorecard metric updates automatically.Warehouse Management KPI Scorecard in Google Sheets
🌍 Join 8,400+ teams in 40+ countries using NextGenTemplates to replace paid SaaS tools with one-time-purchase Excel, Google Sheets, Power BI, and HTML templates.Warehouse Management KPI Scorecard in Google Sheets
✅ Instant download · One-time payment · No subscription · No per-user fees · Lifetime access
Key Features of Warehouse Management KPI Scorecard in Google Sheets
🛒 Click here to Purchase Warehouse Management KPI Scorecard in Google Sheets
The Warehouse Management KPI Scorecard in Google Sheets includes 4 structured worksheets: a Scorecard sheet serving as the main dashboard, a KPI Trend sheet for 12-month deep-dive analysis, an Input Data sheet for centralized monthly data entry, and a KPI Definition sheet documenting every metric’s formula, unit, and classification (Upper the Better or Lower the Better).
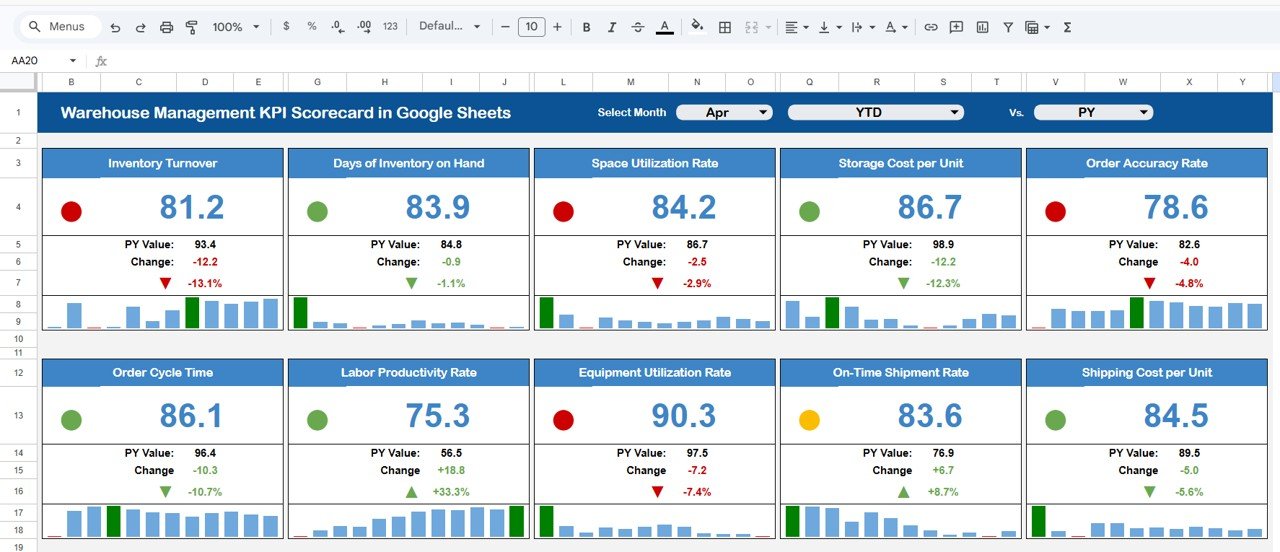
The Scorecard sheet displays all warehouse KPIs in a single view with dropdown menus for month selection, MTD/YTD toggle, and Actual vs Target or Actual vs Previous Year comparison modes. Each KPI row shows the actual value, target value, variance percentage, and a color-coded status indicator — green for on-track, red for below-target.Warehouse Management KPI Scorecard in Google Sheets
The KPI Trend sheet lets you select any KPI from a dropdown in cell C3 and instantly see its group, unit, type, formula, and definition alongside two 12-month trend charts comparing Actual, Target, and Previous Year for both MTD and YTD views. The Input Data sheet keeps all monthly data entry in one clean location, and every change propagates to the Scorecard and Trend sheets automatically. For teams already using Google Sheets Dashboard Templates from NextGenTemplates, this scorecard fits naturally into the existing workflow.
Scorecard Pages Explanation
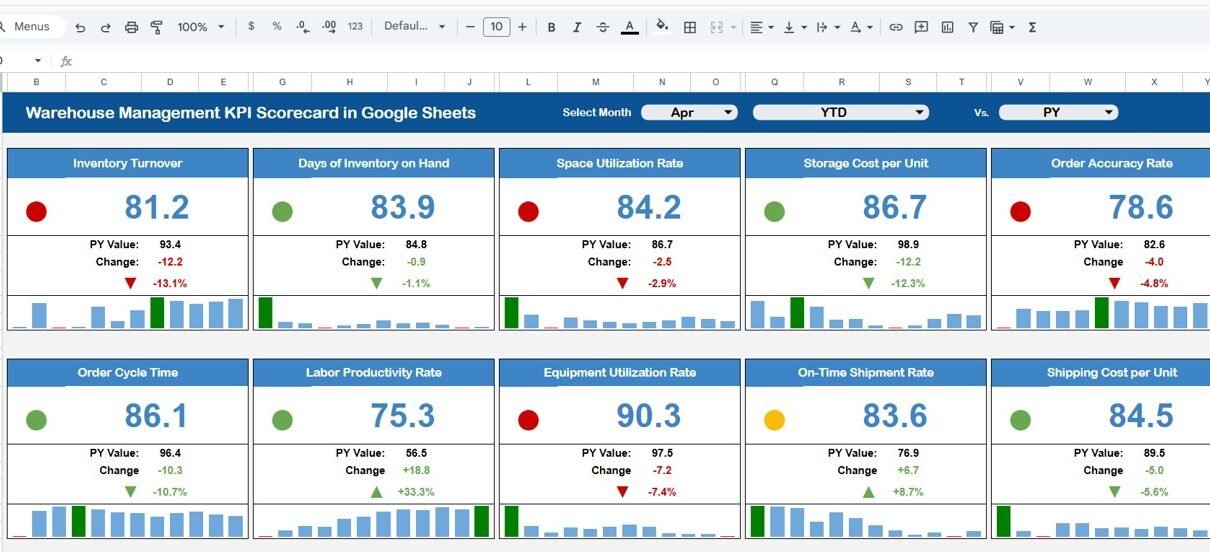
1. Scorecard Sheet
Warehouse Management KPI Scorecard in Google Sheets
The Scorecard sheet is the main interface where you can view KPI performance. Key features include dropdown menus to select the month, MTD (Month-to-Date), or YTD (Year-to-Date) for performance analysis. You can compare Actual vs Target values for each KPI, see performance status through color-coded visual indicators and conditional formatting, and get a full KPI overview including MTD and YTD comparisons in a single view.
2. KPI Trend Sheet
KPI Trend Sheet
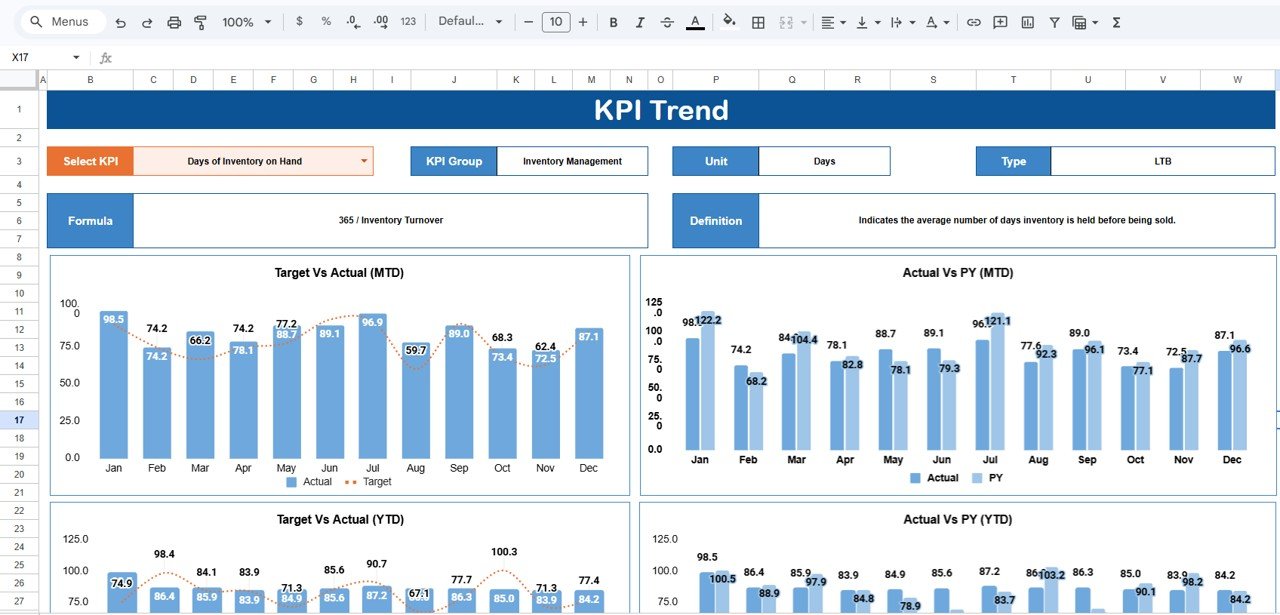
Select any KPI name from the dropdown available in cell C3. The sheet displays the KPI Group, Unit of KPI, Type of KPI (Lower the Better or Upper the Better), Formula of the KPI, and Definition of the KPI. Below the metadata, two trend charts show the MTD and YTD trend for Actual, Target, and Previous Year numbers across 12 months — helping warehouse managers identify seasonal patterns and performance shifts over time.
3. Input Data Sheet
Input Data Sheet
The Input Data sheet is where you enter all KPI data. Record actual values, targets, and previous year metrics for each KPI on a monthly basis. The template is designed for flexibility — update data as new results become available, and the scorecard remains current automatically. No formula editing is required.
4. KPI Definition Sheet
KPI Definition Sheet
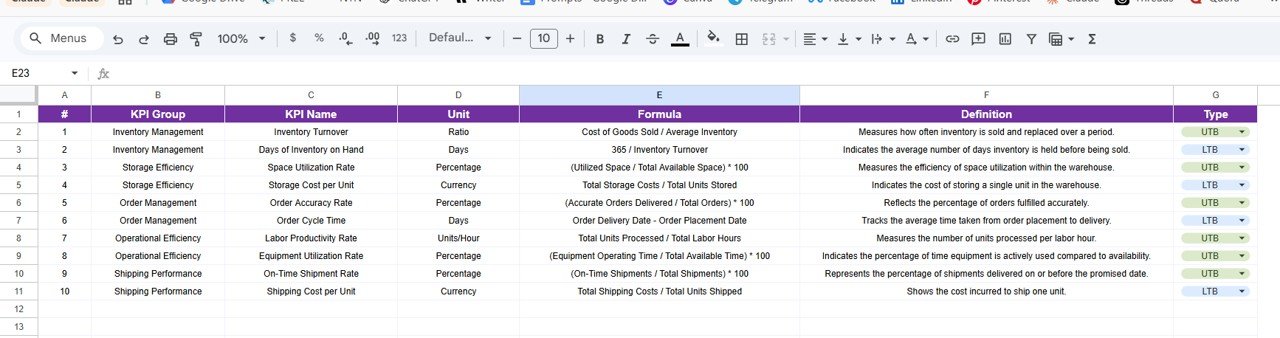
In this sheet, you enter the KPI Name, KPI Group, Unit, Formula, and KPI Definition. This reference sheet ensures consistent measurement and interpretation of warehouse performance metrics across your team. Each KPI is classified as UTB (Upper the Better) or LTB (Lower the Better) so performance direction is always clear.
Warehouse Management KPI Scorecard in Google Sheets vs. Microsoft Excel Scorecard vs. Zoho Inventory / NetSuite ERP — Feature Comparison
| Feature | Warehouse KPI Scorecard (Google Sheets) | Microsoft Excel Scorecard | Zoho Inventory / NetSuite ERP |
|---|---|---|---|
| Cost | $9.99 one-time | $14.99 one-time | $59–$999 / user / month |
| Platform | Google Sheets (free) | Microsoft Excel (license required) | Cloud SaaS (browser) |
| Setup Time | Under 10 minutes | Under 15 minutes | Weeks to months |
| Real-Time Collaboration | ✅ Built-in (Google Sheets) | Requires OneDrive/SharePoint | ✅ Yes |
| Mobile Access | ✅ Google Sheets app | Limited on mobile | ✅ Yes |
| MTD/YTD Toggle | ✅ Built-in dropdowns | ✅ Built-in dropdowns | Report module only |
| Customizable KPIs | ✅ Fully editable | ✅ Fully editable | Limited without admin plan |
| Year-1 Cost at 5 Users | $9.99 total | $14.99 + Excel licenses | $3,540–$59,940 |
| KPI Trend Charts | ✅ 12-month trends | ✅ 12-month trends | Varies by plan |
For warehouse teams that want structured KPI tracking with MTD/YTD analysis and real-time collaboration without paying $59–$999 per user per month, the Warehouse Management KPI Scorecard in Google Sheets sits in the sweet spot.
Who Should Use This Template
🛒 Click here to Purchase Warehouse Management KPI Scorecard in Google Sheets
✅ Perfect for:
- Warehouse managers at companies with 1–20 warehouse locations tracking order accuracy, pick efficiency, inventory turnover, and storage utilization
- Operations directors who need a shared, browser-based KPI scorecard for weekly or monthly warehouse performance reviews
- Supply chain analysts monitoring warehouse metrics against targets and previous year benchmarks across multiple facilities
- Small business owners managing warehouse operations without dedicated WMS software and needing a structured tracking system
❌ Not a fit if:
- Enterprise warehouse operations needing real-time IoT sensor integration, barcode scanning, and automated putaway workflows — consider Google AppSheet or a full WMS platform
- Organizations requiring SOC 2 compliance, audit trails, and role-based access control for warehouse data
- Teams processing 50,000+ SKUs needing automated PO creation and 3PL shipping integrations
Real-World Use Cases
Vikram manages a 3-warehouse distribution operation in Mumbai. He uses the Warehouse Management KPI Scorecard in Google Sheets every Monday to review order accuracy rate, pick efficiency, and inventory turnover across all three locations. The MTD vs Target view helped him spot that Warehouse 2’s pick accuracy dropped below 94% in March — leading to a process audit that identified a labeling issue on the receiving dock. The team fixed it in one shift, and pick accuracy returned to 98.5% by April.
Lisa runs warehouse operations for a mid-size e-commerce brand in Dallas. She replaced a $150/month WMS reporting add-on with this Google Sheets scorecard. Her 4-person warehouse team accesses the same scorecard from their browsers during daily standups. The YTD trend charts showed that shipping cost per order increased 18% year-over-year — prompting a carrier renegotiation that saved roughly $12,000 annually.
Carlos is a supply chain consultant serving manufacturers in Mexico City. He duplicates this scorecard for each client, customizes the KPI Definition sheet with their specific warehouse metrics, and delivers a branded performance review in a single 3-day engagement. The Vs Previous Year comparison is especially useful during quarterly business reviews with plant managers.
Advantages of Warehouse Management KPI Scorecard in Google Sheets
🛒 Click here to Purchase Warehouse Management KPI Scorecard in Google Sheets
The Google Sheets platform gives this scorecard two advantages that Excel-based alternatives cannot match: real-time multi-user collaboration and zero-install access from any device. Five team members can view the same scorecard simultaneously during a warehouse standup without file-sharing conflicts or version control issues.
The 4-sheet structure (Scorecard, KPI Trend, Input Data, KPI Definition) separates concerns cleanly. Data entry happens in one place, definitions live in another, and the visual outputs (scorecard cards and trend charts) stay uncluttered. Updates propagate instantly — change a number in the Input Data sheet and the Scorecard and Trend sheets reflect the new value without clicking Refresh. The template also costs $9.99 one-time compared to $59–$999/user/month for Zoho Inventory or NetSuite ERP, making it accessible for small and mid-size warehouse operations that need KPI visibility without enterprise software budgets.
Opportunities for Improvement
The scorecard tracks KPIs at the overall warehouse level rather than at the zone, shift, or SKU level. Teams managing 20+ warehouse locations with zone-level granularity may need to extend the Input Data sheet structure or consider the Warehouse Efficiency Dashboard in Power BI for multi-dimensional slicing. Additionally, the template does not include automated data import from WMS systems — monthly data entry is manual, which works well for monthly or weekly reviews but may not suit teams that need daily automated refreshes from their ERP.
Best Practices
Start by reviewing the KPI Definition sheet and aligning the default KPIs with your specific warehouse operation. Remove any KPIs that don’t apply (not every warehouse tracks dock-to-stock time or cycle count accuracy) and add any that are missing for your operation. Set realistic monthly targets based on historical data rather than aspirational goals — the scorecard’s value comes from surfacing real gaps, not painting a picture that’s always red. Update the Input Data sheet on the same day each month (or week) to keep trend charts meaningful. Share the Google Sheets link with your warehouse team leads so they can check performance independently without waiting for a report email. Finally, use the YTD vs Previous Year view during quarterly business reviews — it gives leadership the year-over-year context they need to approve budget or headcount requests.
Explore Relevant Templates
📊 Also available as: Warehouse Management KPI Scorecard in Excel
📊 Warehouse Efficiency Dashboard in Power BI — 5-page dashboard tracking shipments, fulfillment, pick time, and shift productivity
📊 Procurement Management Dashboard in Google Sheets — Track procurement spend, PO analysis, and supplier performance
📊 Logistics Efficiency KPI Scorecard in Excel — Logistics-focused KPI tracking with trend analysis
📊 Distribution KPI Scorecard in Excel — Distribution and logistics KPI monitoring with MTD/YTD views
💎 Save 36% — Get all 8 warehouse & inventory templates in the Inventory & Warehouse Master Kit Bundle for $69.99 →
Browse all Google Sheets Dashboard Templates
Frequently Asked Questions
🛒 Click here to Purchase Warehouse Management KPI Scorecard in Google Sheets
What KPIs does the Warehouse Management KPI Scorecard track?
The Warehouse Management KPI Scorecard in Google Sheets tracks 10+ warehouse KPIs including order accuracy rate, pick efficiency, inventory turnover, storage utilization, shipping cost per order, on-time shipment rate, and receiving accuracy. Each KPI is displayed with Actual, Target, and Previous Year values plus MTD and YTD comparisons.
How long does setup take?
Setup takes under 10 minutes. Copy the template to your Google Drive using the link in the PDF guide, replace the sample data in the Input Data sheet with your own warehouse metrics, and every scorecard view and trend chart refreshes automatically.
Can I customize the KPIs for my warehouse?
Yes. The KPI Definition sheet lets you rename, add, or remove KPIs. Update the KPI name, group, unit, formula, and definition — the Scorecard and Trend sheets dynamically pick up any changes from the Input Data sheet.
How does this compare to Zoho Inventory or NetSuite ERP?
Zoho Inventory charges $59–$249 per user per month, and NetSuite ERP starts at roughly $999 per month. The Warehouse Management KPI Scorecard in Google Sheets costs $9.99 one-time with no recurring fees. For teams under 20 warehouse locations that need KPI visibility and trend analysis, this scorecard delivers the same performance insights at a fraction of the cost.
Does this scorecard work on mobile devices?
Yes. Since it runs on Google Sheets, you can access the scorecard from any device using the Google Sheets app. Review warehouse KPIs, check performance status, and share the scorecard with team members during warehouse walks or meetings.
Can multiple team members use this scorecard simultaneously?
Yes. Google Sheets supports real-time collaboration. Multiple warehouse team members can view the scorecard, enter data in the Input Data sheet, and review KPI trends simultaneously — no file-sharing conflicts or version control issues.
Is there an Excel version of this scorecard?
Yes. The Warehouse Management KPI Scorecard is also available as an Excel scorecard on NextGenTemplates — pick the format that matches your team’s tooling.
About the Author
Built by PK — Microsoft Certified Professional with 15+ years of Excel, Google Sheets, and Power BI experience. Founder of NextGenTemplates, reaching 300K+ subscribers across YouTube channels. Every template is hand-built and tested before release.
Conclusion
The Warehouse Management KPI Scorecard in Google Sheets gives warehouse managers, operations leads, and supply chain analysts a structured, cloud-based scorecard to track performance against targets and previous year benchmarks — with MTD/YTD toggle, 12-month trend charts, and color-coded visual indicators across 4 organized worksheets.
🛒 Click here to Purchase Warehouse Management KPI Scorecard in Google Sheets
✅ Instant download · One-time payment · No subscription
🎥 Visit our YouTube channel for step-by-step video tutorials
👉 Youtube.com/@NeoTechNavigators