Billing errors cost organizations an average of 3-5% of total revenue annually, yet most finance teams still lack a structured system to track billing accuracy metrics over time. The Billing Accuracy KPI Dashboard in Google Sheets addresses this gap by consolidating billing KPIs across 6 worksheets with MTD and YTD comparisons, 12-month trend charts, and conditional formatting indicators that flag underperforming metrics instantly. Whether your billing team tracks invoice accuracy, claim denial rates, or payment collection efficiency, this ready-to-use Google Sheets template turns scattered billing data into clear, actionable performance insights.Billing Accuracy KPI Dashboard in Google Sheets
Built entirely in Google Sheets, this dashboard requires no additional software, licenses, or technical skills. Enter your billing data, select a month from the dropdown, and every KPI updates automatically with Actual vs Target and Current Year vs Previous Year comparisons. Setup takes under 10 minutes.
Key Features of Billing Accuracy KPI Dashboard in Google Sheets
Click here to Purchase the Billing Accuracy KPI Dashboard in Google Sheets
The Billing Accuracy KPI Dashboard in Google Sheets includes 6 structured worksheets designed for monthly billing performance tracking. The Dashboard sheet displays all KPIs with MTD Actual, Target, and Previous Year values alongside YTD equivalents, with conditional formatting arrows (green up, red down) highlighting performance status for each metric.
The KPI Trend sheet lets you select any individual metric from a dropdown on cell C3 and instantly view its 12-month history with MTD and YTD trend charts comparing Actual, Target, and Prior Year numbers. The template also includes a KPI Definition sheet where you document every metric’s name, group, unit, formula, and LTB/UTB classification — ensuring consistent understanding across your billing team.Billing Accuracy KPI Dashboard in Google Sheets
This template supports unlimited KPI customization. Whether your billing department tracks 8 metrics or 40, the structure scales without modifications. For accounts receivable-specific tracking, also explore the Accounts Receivable KPI Dashboard in Google Sheets.
Dashboard Pages Explanation
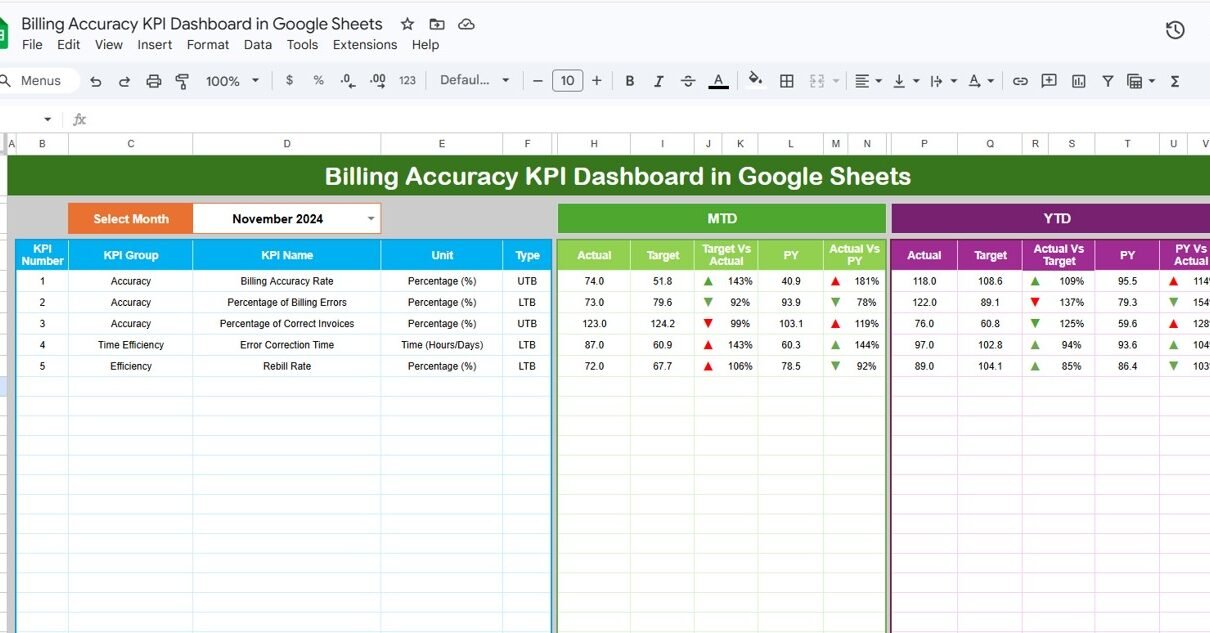
1. Dashboard Sheet
This is the main performance view of the Billing Accuracy KPI Dashboard in Google Sheets. On cell D3, select any month from the dropdown and the entire dashboard refreshes with updated numbers. For each KPI, you see MTD Actual, Target, Previous Year data along with Target vs Actual and PY vs Actual percentages. Conditional formatting arrows instantly show whether each billing metric is on track or needs attention. The same structure repeats for YTD metrics, giving you both monthly and cumulative performance visibility.
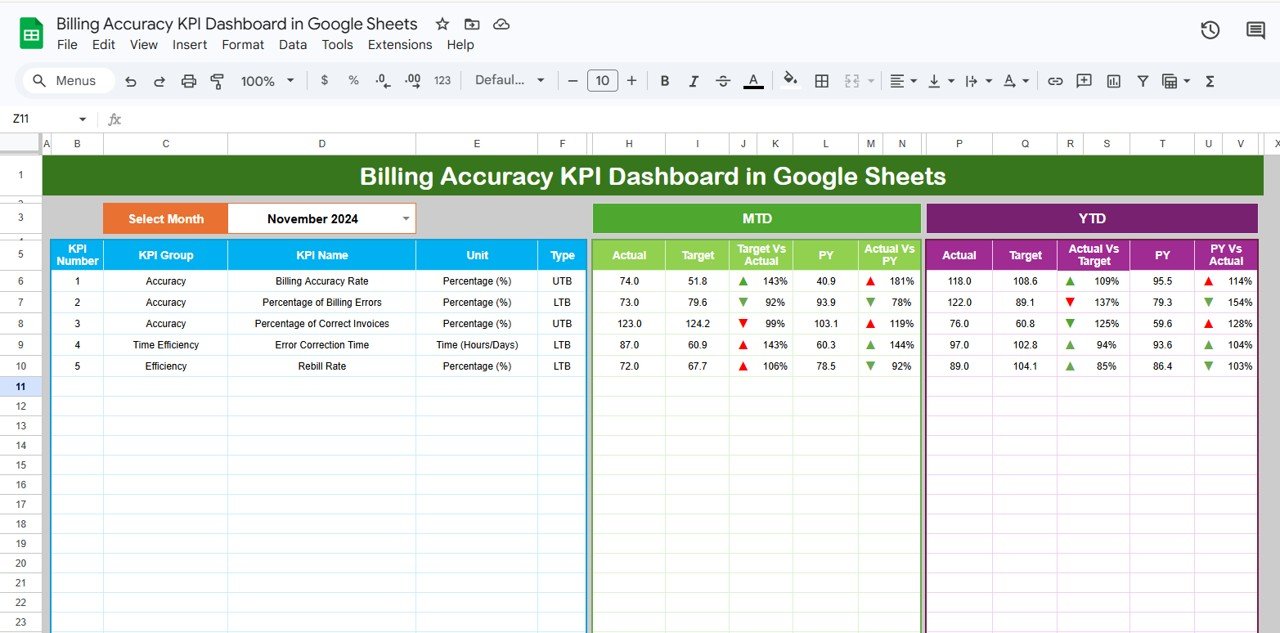
Billing Accuracy KPI Dashboard in Google Sheets
2. KPI Trend Sheet
Select any KPI name from the dropdown on cell C3. The sheet displays the KPI Group, Unit, Type (Lower the Better or Upper the Better), Formula, and Definition. Below this metadata, two trend charts show MTD and YTD performance comparing Actual, Target, and Previous Year numbers across all 12 months. This view helps billing managers spot seasonal patterns, identify persistent underperformance, and prepare data-backed commentary for financial reviews.Billing Accuracy KPI Dashboard in Google Sheets
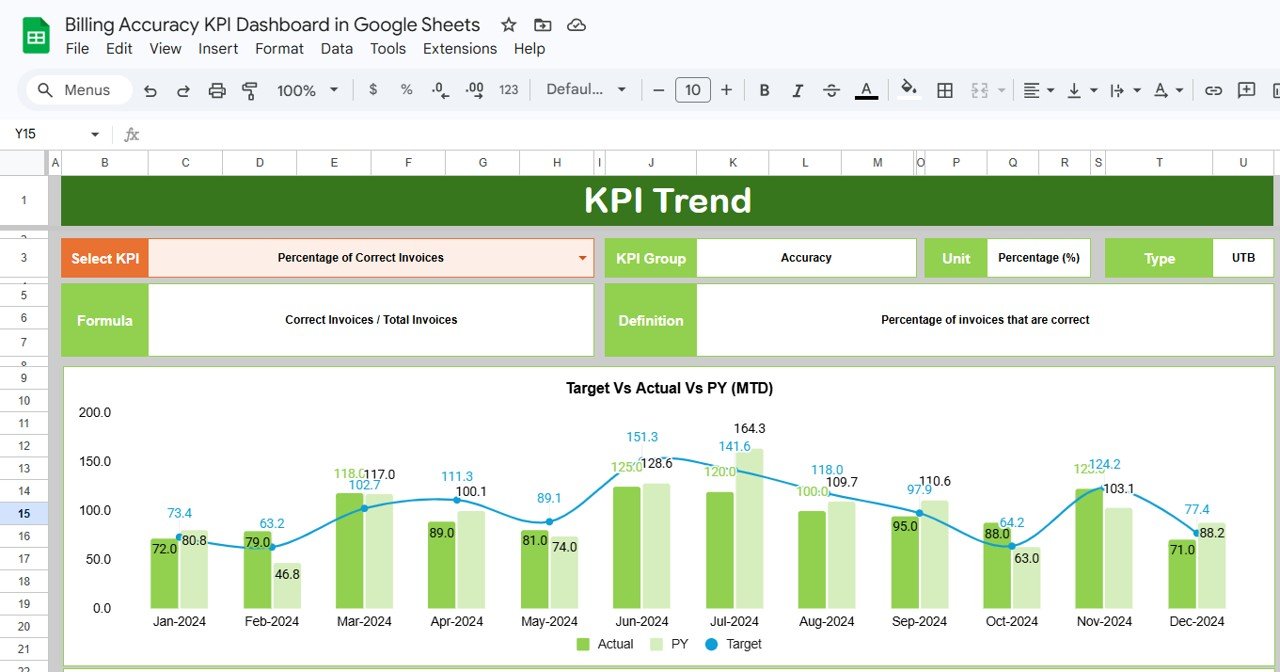
KPI Trend Sheet
3. Actual Numbers Input Sheet
Enter actual MTD and YTD billing performance numbers for each KPI by month. You can change the starting month of your fiscal year on cell E1. This sheet feeds directly into the Dashboard and Trend sheets — as new monthly results become available, enter them here and the entire scorecard refreshes automatically.
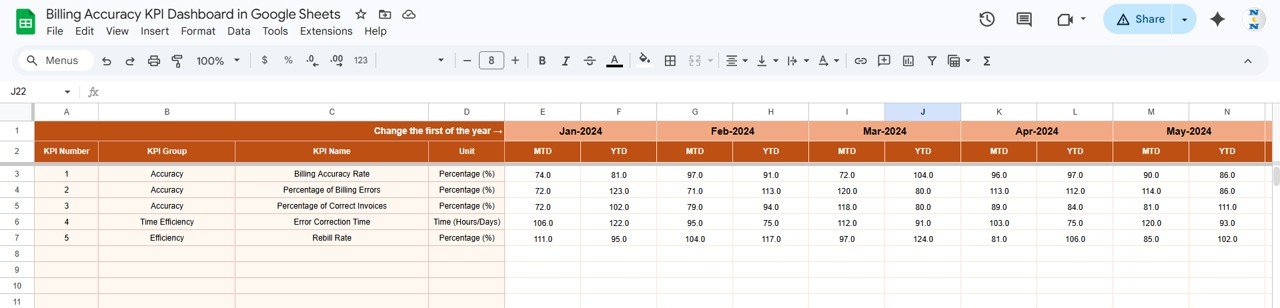
Actual Numbers Input Sheet
4. Target Number Input Sheet
Enter target MTD and YTD values for each billing KPI by month. The Dashboard automatically calculates Target vs Actual percentages from this data and applies the appropriate conditional formatting indicators.
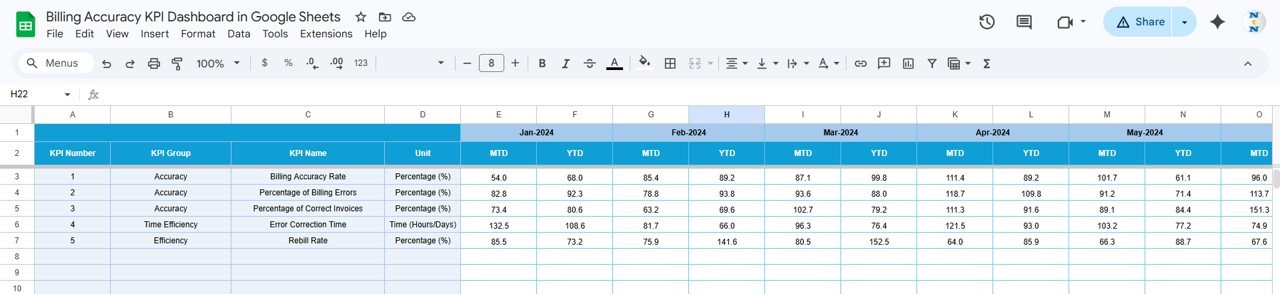
Target Number Input Sheet
5. Previous Year Number Sheet
Enter prior year MTD and YTD values in the same structure as current year data. This enables year-over-year comparisons on both the Dashboard and KPI Trend sheets, helping your billing team measure improvement against historical baselines.Billing Accuracy KPI Dashboard in Google Sheets
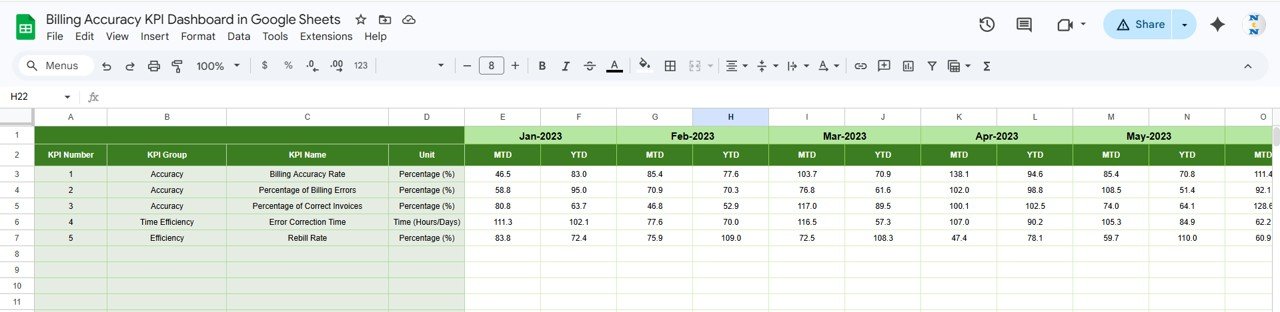
Previous Year Number Input Sheet
6. KPI Definition Sheet
Define each KPI’s Name, Group, Unit, Formula, Definition, and Type (LTB — Lower the Better or UTB — Upper the Better). In the last column, enter LTB or UTB to tell the dashboard how to interpret performance direction. This sheet ensures all stakeholders share a consistent understanding of each billing metric. For a similar structure applied to shared services operations, see the Shared Services KPI Scorecard in Google Sheets.
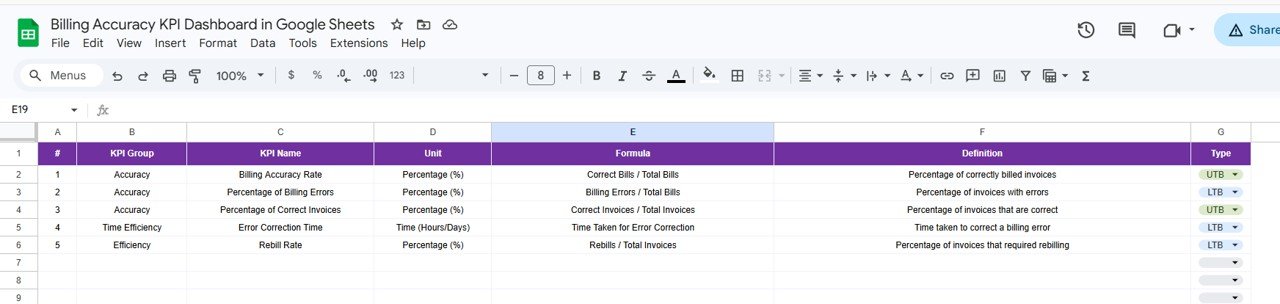
KPI Definition Sheet
Billing Accuracy KPI Dashboard vs. Microsoft Excel Dashboard vs. QuickBooks Advanced — Feature Comparison
| Feature | Billing Accuracy KPI Dashboard (Google Sheets) | Microsoft Excel Dashboard | QuickBooks Advanced |
|---|---|---|---|
| Cost | $8.99 one-time | $14.99+ one-time | $100-200/month |
| Platform | Google Sheets (free) | Microsoft Excel (license required) | Cloud SaaS (browser) |
| Setup Time | Under 10 minutes | 15-30 minutes | Weeks to months |
| Real-Time Collaboration | ✅ Built-in (Google Sheets) | Requires OneDrive/SharePoint | ✅ Yes |
| Mobile Access | ✅ Google Sheets app | Limited on mobile | ✅ Yes |
| Custom KPI Definitions | ✅ Dedicated sheet | Manual setup | Limited customization |
| Trend Charts | ✅ MTD + YTD built-in | Manual chart creation | ✅ Built-in reports |
| Year-1 Cost at 5 Users | $8.99 total | $14.99 + Excel licenses | $1,200-2,400 |
| No IT Department Needed | ✅ Self-service | ✅ Self-service | ❌ Admin setup required |
For teams that want structured billing KPI tracking without enterprise accounting software costs, the Billing Accuracy KPI Dashboard in Google Sheets sits in the sweet spot.
Who Should Use This Template
Click here to Purchase the Billing Accuracy KPI Dashboard in Google Sheets
Perfect for:
- Finance and billing managers at organizations with 10-500 employees tracking invoice accuracy, payment timeliness, and billing error rates
- Accounts receivable teams monitoring collection efficiency, dispute resolution, and aging metrics
- Healthcare billing departments tracking claim accuracy, denial rates, and resubmission turnaround
- Operations directors who need a monthly billing performance review without enterprise ERP systems
Not a fit if:
- You operate an enterprise billing center with 100,000+ monthly invoices requiring API integrations to SAP, Oracle, or NetSuite
- Your team needs SOC 2 compliance, audit trails, and role-based access control for billing data changes
- You require automated real-time data feeds from accounting software into the KPI dashboard
Real-World Use Cases
Priya manages billing operations at a 150-bed hospital in Hyderabad. Her team tracks 15 billing KPIs including claim accuracy rate, first-pass resolution, and denial turnaround time. Before this dashboard, monthly reporting meant consolidating data from 4 different spreadsheets. Now she enters numbers into the Actual Input sheet, and the Dashboard generates a presentation-ready view with MTD/YTD comparisons that leadership reviews in their monthly revenue cycle meeting.
David runs accounts receivable at a mid-size logistics company in Texas. He uses the KPI Trend sheet to identify which billing metrics have been declining for 3+ consecutive months — like invoice dispute rate climbing from 2.1% to 3.8% — and brings data-backed improvement plans to his CFO. The Billing Accuracy KPI Dashboard in Google Sheets replaced a $200/month analytics add-on with a one-time $8.99 investment.
Anita is a freelance finance consultant helping small businesses in Dubai set up billing performance tracking for the first time. She uses the KPI Definition sheet as a collaborative framework during client workshops, defining metrics before any data enters the system. Within a single week, each client has a functioning billing scorecard they maintain independently.
Advantages of Billing Accuracy KPI Dashboard in Google Sheets
Click here to Purchase the Billing Accuracy KPI Dashboard in Google Sheets
- Zero software cost — Google Sheets is free for any Google account holder. The template costs $8.99 one-time with no recurring fees, compared to $1,200-2,400 per year for enterprise billing analytics tools at 5 users.
- Built-in collaboration — Unlike Excel, Google Sheets allows multiple billing team members to view and edit simultaneously. Share a single link with your finance leadership and eliminate version-control headaches.
- Customizable to any billing operation — The KPI Definition sheet lets you define metrics specific to your billing workflow. Track 10 KPIs or 50 — the structure adapts without modifications.
- Instant visual reporting — Conditional formatting, trend charts, and MTD/YTD dropdowns turn raw billing numbers into presentation-ready performance views within seconds of data entry.
- Works on any device — Access your billing scorecard from desktop, tablet, or phone via the Google Sheets app. Review billing KPI performance from anywhere.
Opportunities for Improvement
- The template does not pull data automatically from accounting software — you need to enter monthly actuals manually or use Google Sheets add-ons for data imports from systems like Google Sheets connected sources.
- For organizations tracking 100+ billing KPIs across 10+ departments, the single-sheet Dashboard view may become dense. Consider creating department-specific copies linked to a master summary.
- No built-in role-based access control — all collaborators with edit access can modify any cell. Use Google Sheets protected ranges to limit input areas for different team members.
- Trend charts display monthly granularity only — weekly or daily billing tracking would require structural modifications to the Input Data sheet.
Best Practices
Click here to Purchase the Billing Accuracy KPI Dashboard in Google Sheets
- Start by completing the KPI Definition sheet first — clearly defined billing metrics prevent confusion when multiple departments contribute data later.
- Assign a data steward in your billing department to enter monthly actuals by a fixed deadline (e.g., 5th of each month) to maintain reporting consistency.
- Use the KPI Trend sheet during quarterly reviews to identify metrics that have been underperforming for 3+ consecutive months — these warrant root-cause analysis.
- Set the KPI Type (LTB vs UTB) accurately in the Definition sheet — this determines how the dashboard interprets performance against targets.
- Share the dashboard as view-only with executives and edit-access with data stewards to maintain data integrity.
Explore Relevant Templates
📊 Accounts Receivable KPI Dashboard in Google Sheets — Track receivables aging, collection rates, and payment trends
📊 Shared Services KPI Scorecard in Google Sheets — Monitor shared services performance across IT, HR, finance, and procurement
📊 Customer Engagement KPI Scorecard in Google Sheets — Track customer satisfaction, retention, and engagement metrics
📊 SaaS Customer Success Dashboard in Google Sheets — Monitor SaaS customer health scores and churn risk
📊 Browse all Google Sheets KPI Dashboards
Frequently Asked Questions
Click here to Purchase the Billing Accuracy KPI Dashboard in Google Sheets
What KPIs does the Billing Accuracy KPI Dashboard track?
The Billing Accuracy KPI Dashboard in Google Sheets tracks billing-related metrics you define in the KPI Definition sheet — including invoice accuracy rate, billing error percentage, collection efficiency, payment timeliness, and dispute resolution rate. You can add up to 50+ custom KPIs.
How long does setup take?
Setup takes under 10 minutes. Copy the template to your Google Drive, enter your KPI definitions, input your first month of actual and target data, and the Dashboard sheet populates automatically with MTD and YTD performance metrics.
Can I customize the KPIs for my industry?
Yes. The KPI Definition sheet lets you define any billing metric — name, group, unit, formula, and type (LTB or UTB). Healthcare billing teams, logistics companies, SaaS businesses, and professional services firms all use different KPIs, and this template adapts to all of them.
How does this compare to QuickBooks Advanced?
QuickBooks Advanced costs $100-200 per month and requires implementation time. The Billing Accuracy KPI Dashboard costs $8.99 one-time with no recurring fees. For teams that need structured KPI tracking without full accounting software overhead, this template delivers the same performance visibility at a fraction of the cost.
Does this template work on mobile devices?
Yes. Since it runs on Google Sheets, you can access the dashboard from any device using the Google Sheets app. Review billing KPI performance from your phone or tablet during meetings or while traveling.
Can multiple team members use this dashboard simultaneously?
Yes. Google Sheets supports real-time collaboration. Multiple billing team members can view the dashboard, enter data, and review trends at the same time without file-sharing conflicts or version control issues.
What is the difference between LTB and UTB KPIs?
LTB (Lower the Better) applies to metrics like billing error rate or invoice dispute percentage where lower numbers indicate better performance. UTB (Upper the Better) applies to metrics like collection efficiency or first-pass accuracy where higher numbers are the goal. The dashboard uses this classification to correctly color-code performance arrows.
About the Author
Built by PK — Microsoft Certified Professional with 15+ years of Excel, Google Sheets, and Power BI experience. Founder of NextGenTemplates, reaching 300K+ subscribers across YouTube channels. Every template is hand-built and tested before release.
Conclusion
The Billing Accuracy KPI Dashboard in Google Sheets gives billing teams, finance managers, and operations directors a structured, visual, and collaborative way to track monthly billing performance. With 6 worksheets covering Dashboard, KPI Trends, Actual Input, Target Input, Previous Year Data, and KPI Definitions, this template replaces manual reporting with automated MTD/YTD tracking and year-over-year comparisons.
Click here to Purchase the Billing Accuracy KPI Dashboard in Google Sheets
✅ Instant download · One-time payment · No subscription
🎥 Visit our YouTube channel for step-by-step tutorials: Youtube.com/@NeoTechNavigators