The Content Creator Revenue Dashboard in Google Sheets tracks 4 KPIs, 8 charts, and 500+ content records across 6 interactive sheets — covering revenue by source, platform, content category, and month. For YouTubers, podcasters, bloggers, and multi-platform creators earning from ads, sponsorships, courses, and affiliate links, this $9.99 one-time Google Sheets template replaces the scattered spreadsheets and $24–$149/month SaaS tools most creators use to track income.
Whether you publish on YouTube, TikTok, Instagram, a podcast feed, or a blog, the Content Creator Revenue Dashboard in Google Sheets consolidates every revenue stream, engagement metric, and subscriber growth number into a single file you can share with sponsors, accountants, or your team in Google Drive.
Click here to Purchase the Content Creator Revenue Dashboard in Google Sheets
Key Features of Content Creator Revenue Dashboard in Google Sheets
The Content Creator Revenue Dashboard in Google Sheets is built around 6 purpose-specific sheet tabs — Overview, Revenue, Content, Audience, Search, and Data — each designed to answer a different set of creator business questions without cluttering a single view.
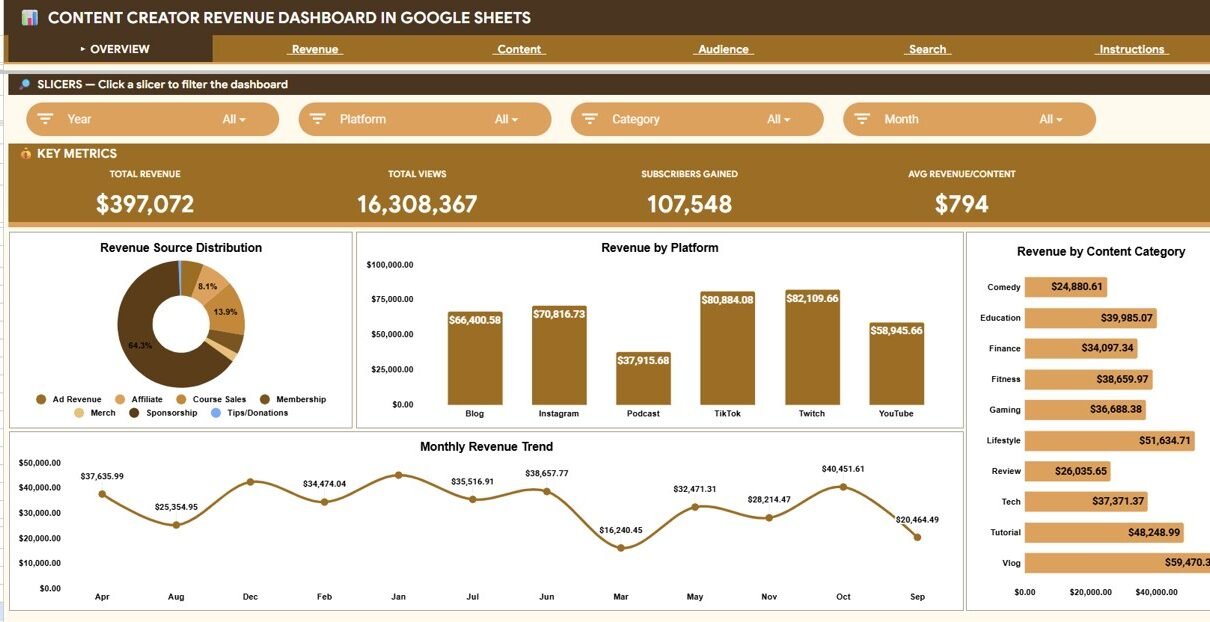
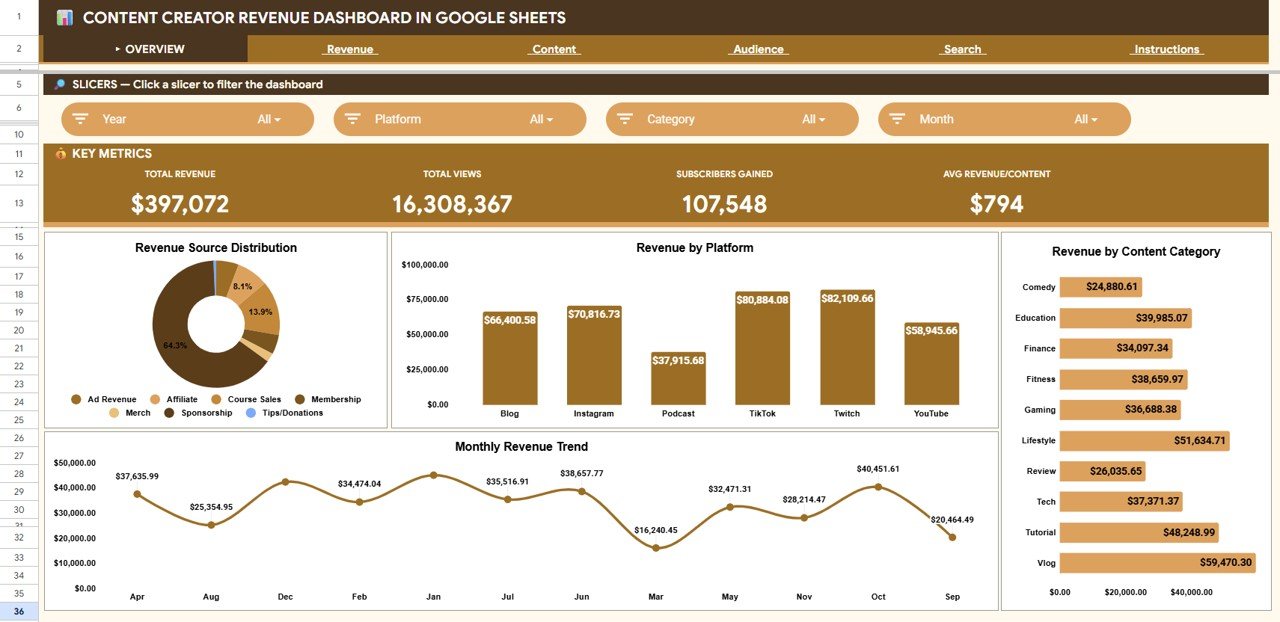
The Overview page displays 4 KPI cards (Total Revenue, Total Views, Subscribers Gained, Avg Revenue per Content) with slicers that filter the entire page by platform, revenue source, content category, or month. Four charts on this page cover Revenue by Source, Revenue by Platform, Revenue by Content Category, and Revenue by Month — providing a complete financial snapshot in under 10 seconds.
The Revenue page breaks monetization into 8 detailed analyses: Highest Earning content piece, Sponsorship Revenue, Ad Revenue, Course Sales, Revenue by Month and Platform, Avg Revenue per Content by Platform, Revenue by Content Type, and Revenue and Count by Revenue Source. This answers the single most important creator question — where the money actually comes from.
The Content page tracks engagement with 4 KPI cards (Total Views, Total Likes, Total Comments, Content Pieces) and 4 charts covering Views by Content Type, Views and Likes by Platform, Likes and Comments by Category, and Views by Month.
The Audience page monitors subscriber growth with charts for Subscribers Gained by Month, Subscribers by Platform, Subscribers by Category, and Subscribers by Month and Platform — plus cards for Total Subs Gained, Avg Subs per Content, Best Single Piece, and YouTube Subs Gained.
The Search sheet lets you select any Content ID from a dropdown and instantly see every detail — date, platform, content type, category, title, views, revenue, likes, comments, subscribers gained, and revenue source — without scrolling through the dataset.
Dashboard Sheets Explanation
Click here to Purchase the Content Creator Revenue Dashboard in Google Sheets
Overview Page
The Overview sheet is the landing page. Four KPI cards sit at the top — Total Revenue, Total Views, Subscribers Gained, and Avg Revenue per Content. Below the cards, four charts visualize Revenue by Source, Revenue by Platform, Revenue by Content Category, and Revenue by Month. Multiple slicers let you filter the entire view by any dimension.
Overview Page
Revenue Page
The Revenue sheet dives into monetization across 8 analyses. Cards show Highest Earning, Sponsorship Revenue, Ad Revenue, and Course Sales. Charts break down Revenue by Month and Platform, Avg Revenue per Content by Platform, Revenue by Content Type, and Revenue and Count by Revenue Source.
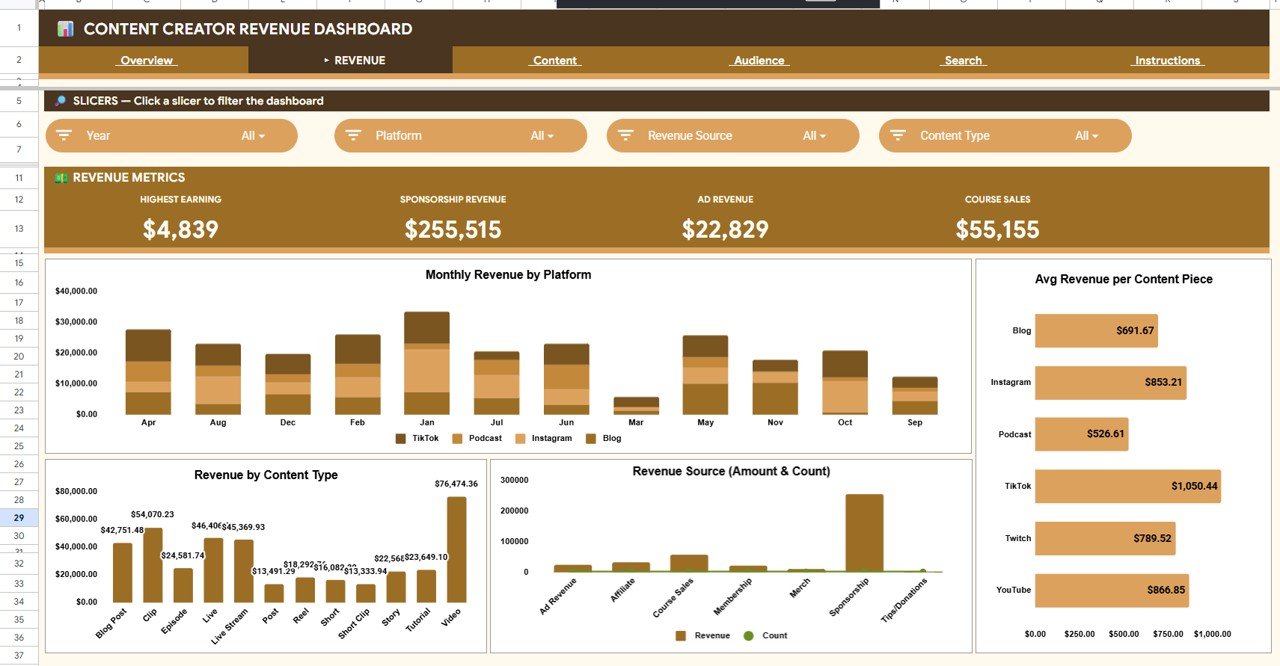
Revenue Page
Content Page
The Content sheet tracks engagement metrics. Four KPI cards display Total Views, Total Likes, Total Comments, and Content Pieces. Four charts show Views by Content Type, Views and Likes by Platform, Likes and Comments by Category, and Views by Month.
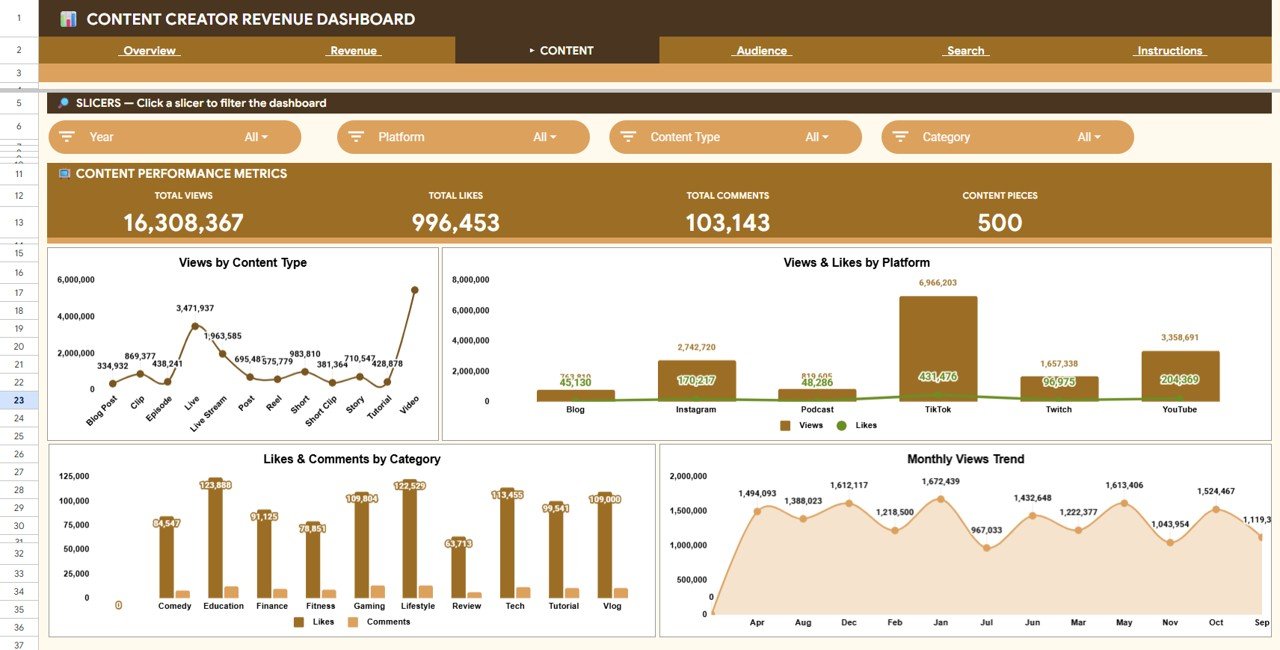
Content Page
Audience Page
The Audience sheet monitors subscriber acquisition. Cards show Total Subs Gained, Avg Subs per Content, Best Single Piece, and YouTube Subs Gained. Charts display Subscribers Gained by Month, Subscribers by Platform, Subscribers by Category, and Subscribers by Month and Platform.
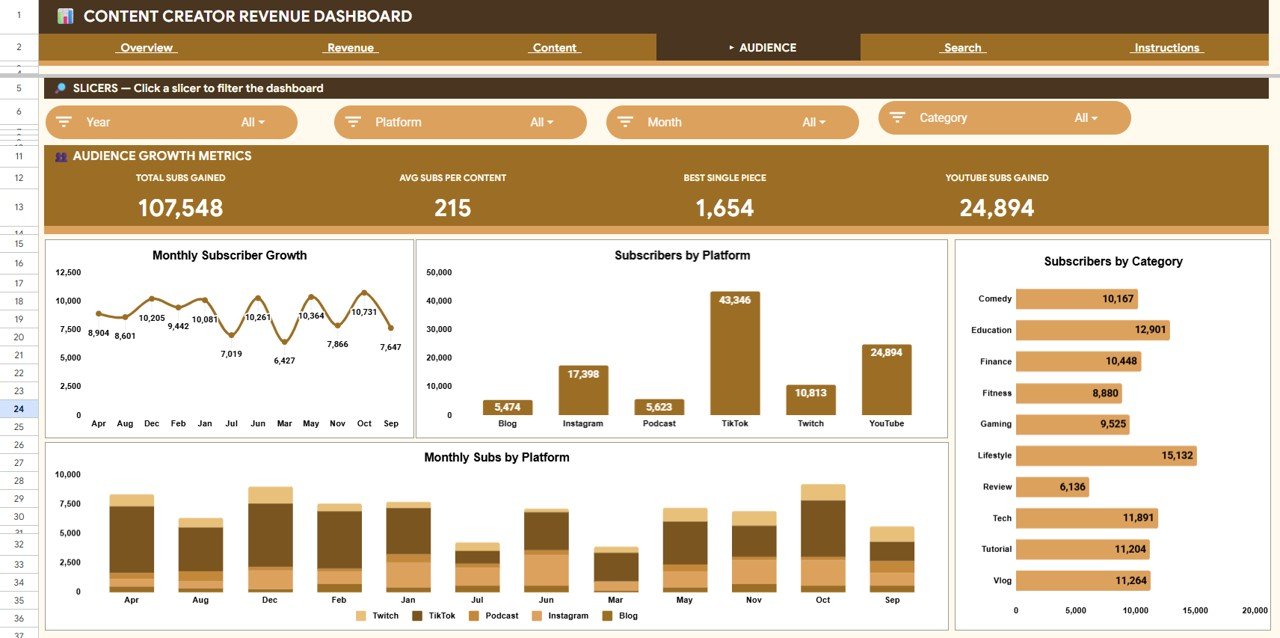
Audience Page
Search Sheet
Select any Content ID from the dropdown and the lookup automatically displays the date, platform, content type, category, title, views, revenue, likes, comments, subscribers gained, and revenue source for that specific piece.
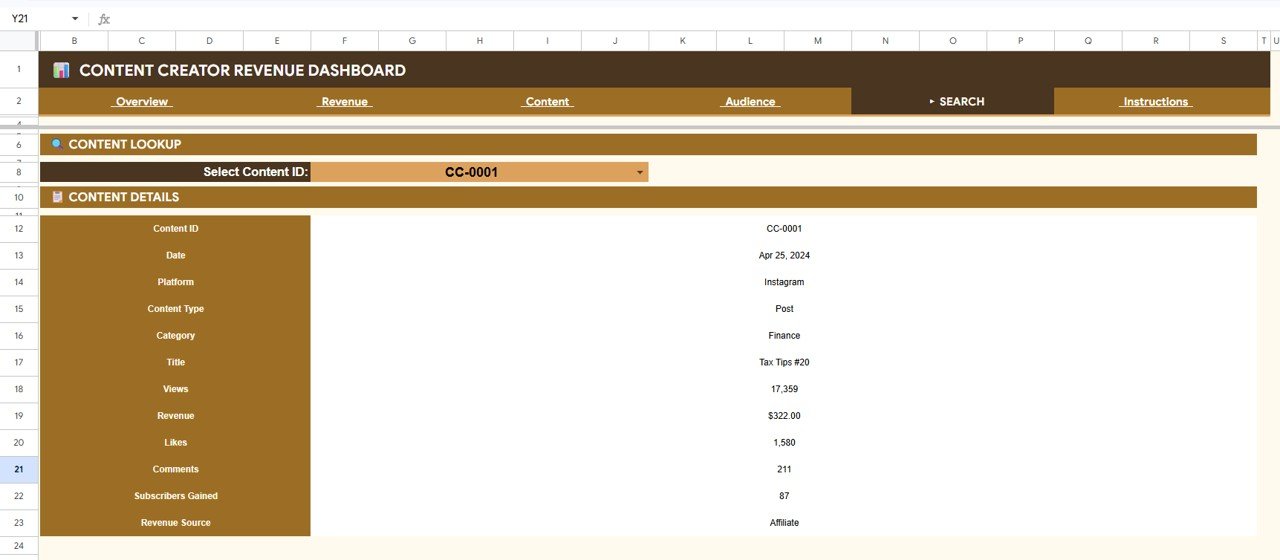
Search Sheet
Data Sheet
This is where you enter your content performance data. Paste records in the same column structure and every other sheet refreshes from this single source.
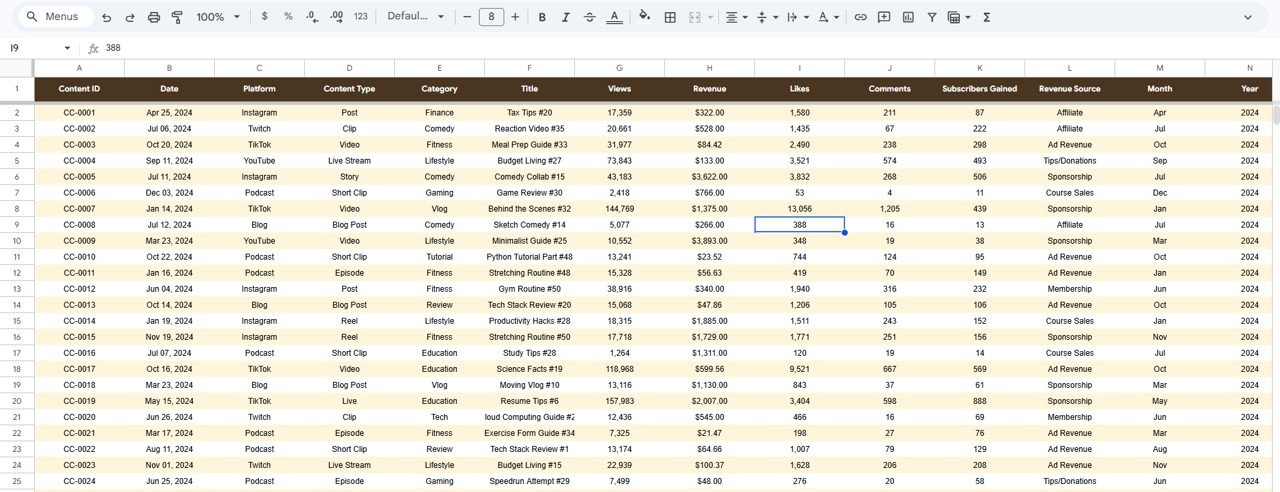
Data Sheet
Content Creator Revenue Dashboard in Google Sheets vs. Excel vs. Kajabi / Linktree Pro — Feature Comparison
| Feature | Content Creator Revenue Dashboard (Google Sheets) | Microsoft Excel Dashboard | Kajabi / Linktree Pro / Stan Store |
|---|---|---|---|
| Cost | $9.99 one-time | $9.99–$17.99 one-time | $24–$149 / month |
| Platform | Google Sheets (browser) | Microsoft Excel (desktop) | Proprietary cloud SaaS |
| Setup time | Under 10 minutes | Under 10 minutes | 1–3 hours onboarding |
| Real-time collaboration | Built-in | Via OneDrive only | Limited |
| Mobile access | Google Sheets app | Excel mobile (limited) | Yes |
| Multi-platform tracking | All platforms | Same | Own platform only |
| Content-level lookup | Search sheet with dropdown | VBA search (Windows only) | Limited |
| Year-1 cost at 1 user | $9.99 total | $9.99–$17.99 total | $288–$1,788 |
| Data ownership | 100% in Google Drive | 100% local file | Vendor-hosted |
For content creators who want a multi-platform revenue dashboard without a monthly SaaS bill, the Content Creator Revenue Dashboard in Google Sheets sits in the sweet spot.
Who Should Use This Template
Perfect for:
- YouTubers, podcasters, and bloggers tracking revenue from ads, sponsorships, courses, and affiliates across 2–5 platforms
- Solo creators and small teams (1–5 people) who want one Google Sheets file consolidating all income and engagement data
- Creators earning $500–$50,000/month who need reporting for taxes, sponsors, or brand partnerships
- Google Sheets users who prefer browser-based dashboards with real-time sharing
Not a fit if:
- You’re a large media company or MCN needing real-time API integrations with YouTube Analytics or TikTok Creator Fund
- You only monetize through one platform and one revenue source — a simpler tracker would work
- You need automated data ingestion from APIs — this template uses manual data entry
Real-World Use Cases
Click here to Purchase the Content Creator Revenue Dashboard in Google Sheets
Anika is a YouTube creator with 85K subscribers in personal finance. She earns from AdSense, course launches, and brand sponsorships. The Content Creator Revenue Dashboard in Google Sheets helped her discover that investing tutorials earn 2.4x more per video than budgeting tips — shifting her entire content calendar.
Marcus runs a podcast and blog in the tech review space. He uses the Revenue page to compare sponsorship vs ad vs affiliate income monthly, and the Audience page to confirm his podcast drives 3x more subscribers per piece than the blog. The data helped him pitch a $2,000/episode sponsorship deal.
Priya manages content for a 3-person creator agency in Bangalore. She copies the dashboard per client, updates Data weekly, and uses the Overview page as the monthly reporting deck — replacing a $49/month SaaS subscription per client.
Advantages of Content Creator Revenue Dashboard in Google Sheets
- Multi-platform in one file — YouTube, TikTok, Instagram, podcast, and blog revenue tracked side by side without switching between platform dashboards
- Real-time collaboration — share the Google Sheet with your accountant, manager, or sponsor with view or edit permissions
- $9.99 one-time vs $288–$1,788/year for Kajabi or Linktree Pro — saves most solo creators $200+ annually
- Search sheet eliminates scrolling — look up any content piece by ID instantly
- Mobile-ready — review your revenue dashboard on the Google Sheets app during commutes or between shoots
Opportunities for Improvement
Click here to Purchase the Content Creator Revenue Dashboard in Google Sheets
- No automated API connection to YouTube Analytics, TikTok, or Spotify — data entry is manual (paste from exports)
- Google Sheets slicers are less interactive than Power BI or Excel slicers — filtering is functional but not as fluid
- No built-in currency conversion — creators earning in multiple currencies will need to normalize before pasting data
Best Practices
- Update the Data sheet weekly or monthly with exports from each platform to keep trends current
- Use consistent platform and category names — spelling variations break slicer filtering
- Share the dashboard as “Viewer” with sponsors so they can see reach data without editing your numbers
- Duplicate the file quarterly to archive historical snapshots before overwriting data
- Use the Search sheet when sponsors or partners ask for stats on a specific piece of content
Explore Relevant Templates
Content Creator Revenue Dashboard in Power BI — same analytics in a DAX-powered Power BI report for teams on Microsoft BI.
YouTube Channel Analytics Dashboard in Google Sheets — YouTube-focused analytics with deeper channel metrics.
Digital Marketing Campaign Dashboard in Google Sheets — campaign performance tracking across paid and organic channels.
Podcast Analytics Dashboard in Power BI — podcast-specific KPI tracking for networks and indie podcasters.
Browse all Google Sheets Dashboard Templates on NextGenTemplates.
Frequently Asked Questions
Click here to Purchase the Content Creator Revenue Dashboard in Google Sheets
What KPIs does the Content Creator Revenue Dashboard in Google Sheets track?
The Content Creator Revenue Dashboard in Google Sheets tracks 4 headline KPIs — Total Revenue, Total Views, Subscribers Gained, and Avg Revenue per Content — plus 8 supporting charts across revenue source, platform, content category, and monthly trends. Deeper pages cover sponsorship revenue, ad revenue, course sales, engagement, and subscriber growth.
How long does setup take?
Setup takes under 10 minutes. Open the Google Sheets link from the PDF guide, make a copy, paste your content data into the Data sheet, and every chart and KPI card updates automatically across all analysis pages.
Can I track revenue from YouTube, TikTok, Instagram, and podcasts in one dashboard?
Yes. The Data sheet has a Platform column that accepts any value — YouTube, TikTok, Instagram, Podcast, Blog, Twitter, LinkedIn, or custom entries. Slicers and charts break down all metrics by platform automatically.
How does this compare to Kajabi or Linktree Pro analytics?
Kajabi costs $24–$149 per month and Linktree Pro charges $24 per month. Both only track activity on their own platform. The Content Creator Revenue Dashboard in Google Sheets costs $9.99 one-time, tracks all platforms in one place, and gives you 100% data ownership in Google Drive.
Does this work on mobile?
Yes. The Content Creator Revenue Dashboard in Google Sheets opens in the Google Sheets mobile app on iOS and Android. Charts display in read-only mode, while data entry works on both phone and tablet.
Can I share this dashboard with sponsors or brand partners?
Yes. Share the Google Sheets link with anyone using a Google account. Set permissions to Viewer for read-only sponsor access or Editor for collaborative teams. Ideal for monthly performance reports.
Can I add more revenue sources or content platforms?
Yes. Add new values directly to the Data sheet. All slicers and charts across Overview, Revenue, Content, and Audience pages pick up new entries automatically without formula edits.
About the Author
Built by PK — Microsoft Certified Professional with 15+ years of Excel, Google Sheets, and Power BI experience. Founder of NextGenTemplates, reaching 300K+ subscribers across YouTube channels. Every template is hand-built and tested before release.
Conclusion
The Content Creator Revenue Dashboard in Google Sheets gives YouTubers, podcasters, bloggers, and multi-platform creators a single dashboard to track revenue, engagement, and subscriber growth across every channel — for a one-time $9.99 payment instead of $24–$149 per month in SaaS fees.
Click here to Purchase the Content Creator Revenue Dashboard in Google Sheets
Instant download · One-time payment · No subscription
👉 Youtube.com/@NeoTechNavigators