In the construction industry, managing multiple projects efficiently requires real-time tracking of budgets, tasks, timelines, and contractor performance. The Construction Project Task Performance Dashboard in Google Sheets provides a powerful, ready-to-use solution for monitoring every key aspect of your construction projects.
This dashboard simplifies project analysis and empowers managers to make data-driven decisions. In this article, we’ll explore its features, benefits, and best practices.
What Is a Construction Project Task Performance Dashboard?
Click to Buy Construction Project Task Performance Dashboard in Google Sheets
A Construction Project Task Performance Dashboard is a digital project management tool that allows teams to visualize ongoing project data — including cost, progress, and efficiency metrics — in a clear, interactive format.
It helps stakeholders answer critical questions such as:
-
How are current tasks progressing?
-
Are we staying within budget?
-
Which departments or contractors are performing well?
-
Where are delays or overruns occurring?
By consolidating this information in Google Sheets, the dashboard offers flexibility, collaboration, and transparency across departments and teams.
Key Features of the Construction Project Task Performance Dashboard
This dashboard includes multiple interactive sheets, designed to offer a complete overview of construction operations:
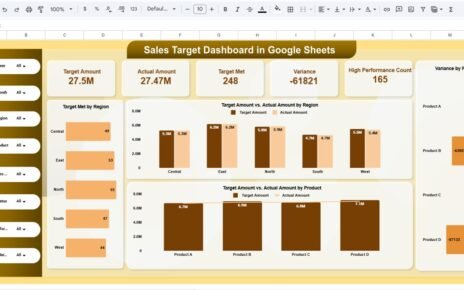
1. Overview Sheet
The Overview Sheet provides a snapshot of your project’s financial and operational performance.
Cards:
-
Total Tasks: Total number of tasks in the project
-
Budget (USD): Total allocated budget
-
Actual Cost (USD): Actual cost incurred to date
-
Cost Variance: Difference between planned and actual cost
-
Progress (%): Overall task completion percentage
Charts:
-
Total Tasks by Department
-
Budget (USD) vs. Actual Cost (USD) by Month
-
Budget (USD) vs. Actual Cost (USD) by Status
-
Total Tasks by Department
These visuals offer immediate insight into financial performance and task distribution.

Click to Buy Construction Project Task Performance Dashboard in Google Sheets
2. Department Summary
This sheet gives department-wise breakdowns for performance and cost management.
Charts:
-
Progress (%) by Department
-
Cost Variance by Department
-
Budget (USD) vs. Actual Cost (USD) by Department
-
On-Time vs. Delayed Tasks by Department
This section highlights which departments are meeting their goals and which need attention.

Click to Buy Construction Project Task Performance Dashboard in Google Sheets
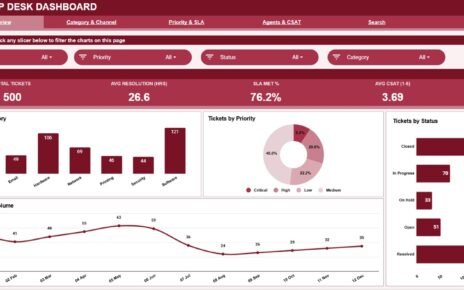
3. Contractor Performance
Monitor the productivity and efficiency of your contractors.
Charts:
-
Progress (%) by Contractor
-
Budget (USD) vs. Actual Cost (USD) by Contractor
-
On-Time vs. Delayed Tasks by Contractor
-
Cost Variance by Contractor
This helps identify top-performing contractors and areas where delays or cost overruns are common.

Click to Buy Construction Project Task Performance Dashboard in Google Sheets
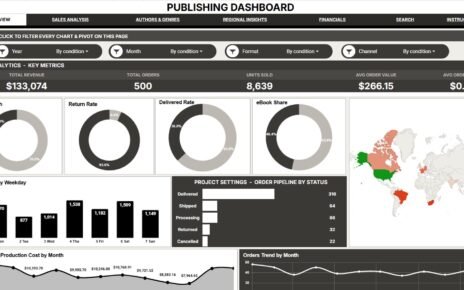
4. Location Analysis
Evaluate project progress by location to ensure even distribution of resources and productivity.
Charts:
-
Progress (%) by Location
-
Budget (USD) vs. Actual Cost (USD) by Location
-
On-Time vs. Delayed Tasks by Location
-
Cost Variance by Location
Location-level insights are especially valuable for large or multi-site construction projects.

Click to Buy Construction Project Task Performance Dashboard in Google Sheets
5. Search Sheet Tab
Use the Search Sheet to filter data by keyword or field name — such as contractor name, department, or task — for quick access to specific information.

Click to Buy Construction Project Task Performance Dashboard in Google Sheets
6. Data Sheet Tab
This is the foundation of the dashboard where all project data is entered and maintained.
Include key fields such as:
-
Task Name
-
Department
-
Contractor
-
Start and End Dates
-
Status
-
Budget, Actual Cost, and Progress
All visuals and calculations in the dashboard update automatically based on this data.

Click to Buy Construction Project Task Performance Dashboard in Google Sheets
Advantages of Using the Construction Project Task Performance Dashboard
-
📊 Real-Time Insights: Monitor all project activities, costs, and progress instantly.
-
💡 Data-Driven Decisions: Identify inefficiencies early using clear visual trends.
-
💰 Cost Control: Track budgets and actual costs to prevent overruns.
-
🏗️ Contractor Accountability: Compare performance metrics across contractors.
-
📅 Schedule Optimization: Easily detect and address delayed tasks.
-
🌐 Cloud Collaboration: Accessible to all stakeholders via Google Sheets.
Best Practices for Using the Dashboard
-
Update Data Weekly: Ensure all budget, cost, and progress fields are current.
-
Use Conditional Formatting: Highlight delays or cost overruns automatically.
-
Set Clear Department Targets: Define goals for cost variance and progress rates.
-
Leverage Charts for Meetings: Use visual reports for stakeholder updates.
-
Track Historical Data: Compare current and past months for performance trends.
-
Automate Data Entry: Use Google Forms or scripts to feed task data directly.
How This Dashboard Benefits Construction Managers
Click to Buy Construction Project Task Performance Dashboard in Google Sheets
-
Improved Cost Efficiency: Detect and manage overruns early.
-
Enhanced Project Visibility: One central view for all departments and contractors.
-
Time Savings: Automates reporting and eliminates manual calculations.
-
Accountability: Encourages transparency across teams.
-
Data-Driven Strategy: Use insights to plan future projects effectively.
Frequently Asked Questions (FAQs)
Click to Buy Construction Project Task Performance Dashboard in Google Sheets
Q1: Can I use this dashboard for multiple projects?
Yes, you can duplicate sheets for each project or add a project name filter to manage multiple projects simultaneously.
Q2: Does this dashboard calculate progress automatically?
Yes, progress percentages and variances are auto-calculated based on data in the Data Sheet.
Q3: How do I compare contractors or locations?
Use the Contractor and Location Analysis sections for side-by-side visual comparisons.
Q4: Is this dashboard suitable for small projects?
Yes, it’s scalable — ideal for both small teams and large construction firms.
Q5: Can I share this dashboard with other stakeholders?
Absolutely. Since it’s built in Google Sheets, you can share it securely with role-based permissions.
Conclusion
The Construction Project Task Performance Dashboard in Google Sheets is a must-have tool for project managers aiming to streamline operations, control budgets, and boost productivity. With automated metrics, clear visuals, and detailed department- and contractor-level tracking, this dashboard transforms complex project data into actionable insights.
Visit our YouTube channel to learn step-by-step video tutorials
Youtube.com/@NeotechNavigators
Watch the step-by-step video Demo:
Click to Buy Construction Project Task Performance Dashboard in Google Sheets