The Association of American Publishers reported that U.S. publishing revenue reached $32.5 billion in 2024, a 4.1% increase from 2023. For publishers, author-service teams, book marketers, and finance leads, that scale makes clean reporting important. Orders, formats, authors, genres, regions, royalties, returns, and production costs often sit in separate exports or manual trackers. The Publishing Dashboard in Google Sheets brings those records into one editable dashboard workbook.
This template is built for teams that want clear publishing analytics without paying for a full publishing management platform. Because it runs in Google Sheets, users can work in the browser, update source rows, and share a live copy with the right people. Google also provides official guidance for collaborating in Sheets, which makes this kind of template useful for lightweight team reporting.
Get the Publishing Dashboard in Google Sheets
Key Features of Publishing Dashboard in Google Sheets
- Seven working tabs: Overview, Sales Analysis, Authors & Genres, Regional Insights, Financials, Search Sheet, and Data Sheet.
- High-level overview cards: Track Total Revenue, Total Orders, Units Sold, and Average Order Value from the top of the dashboard.
- Order status dashboard: Review sell-through, return rate, delivered rate, and order pipeline by status.
- Sales channel reporting: Compare revenue by sales channel, month, and book format.
- Author and genre analysis: Review author revenue, genre share, units sold by genre, and royalty movement.
- Regional performance: Analyze revenue, orders, and units by country and region.
- Financial review: Compare revenue, production cost, royalties paid, and genre-level royalty impact.
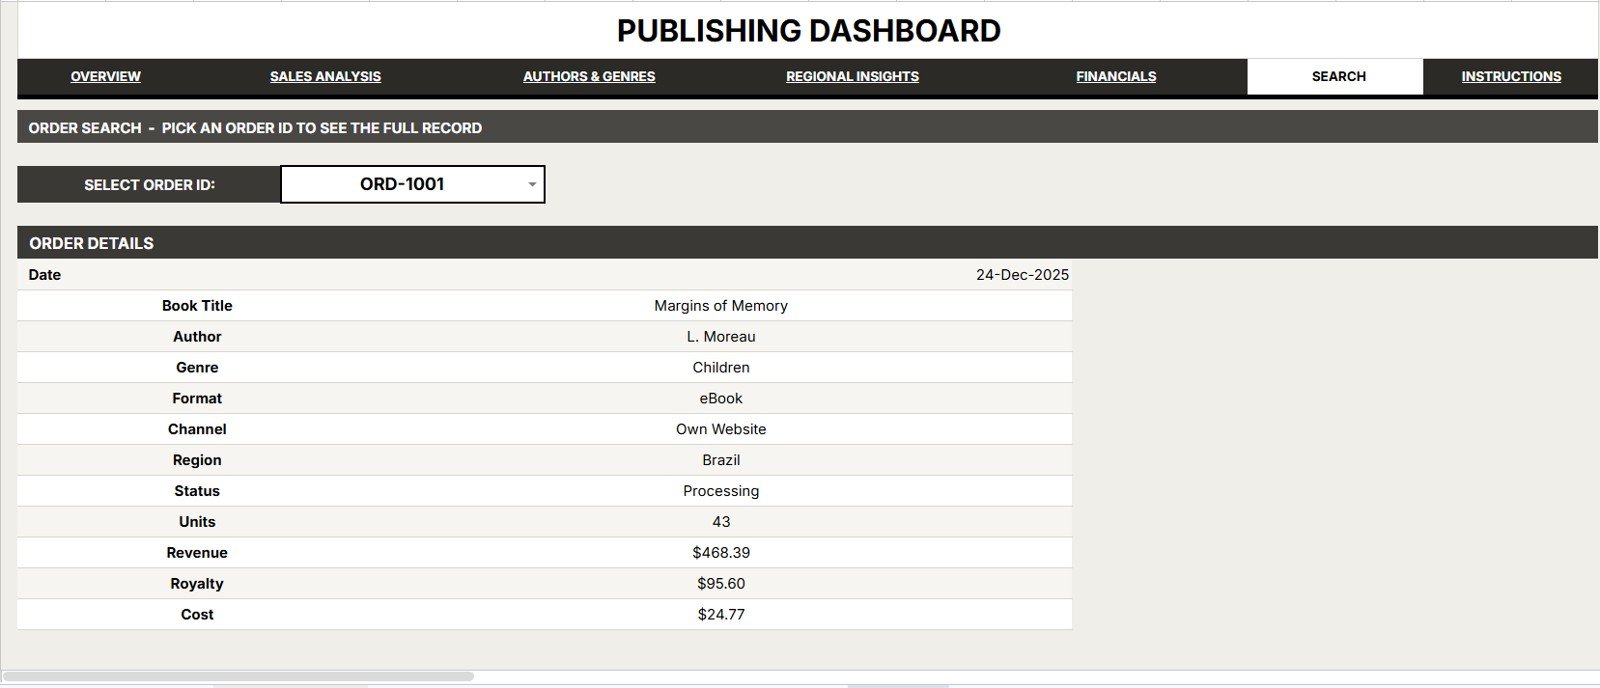
- Search sheet workflow: Select one Order ID and view the full order record without scanning the raw data table.
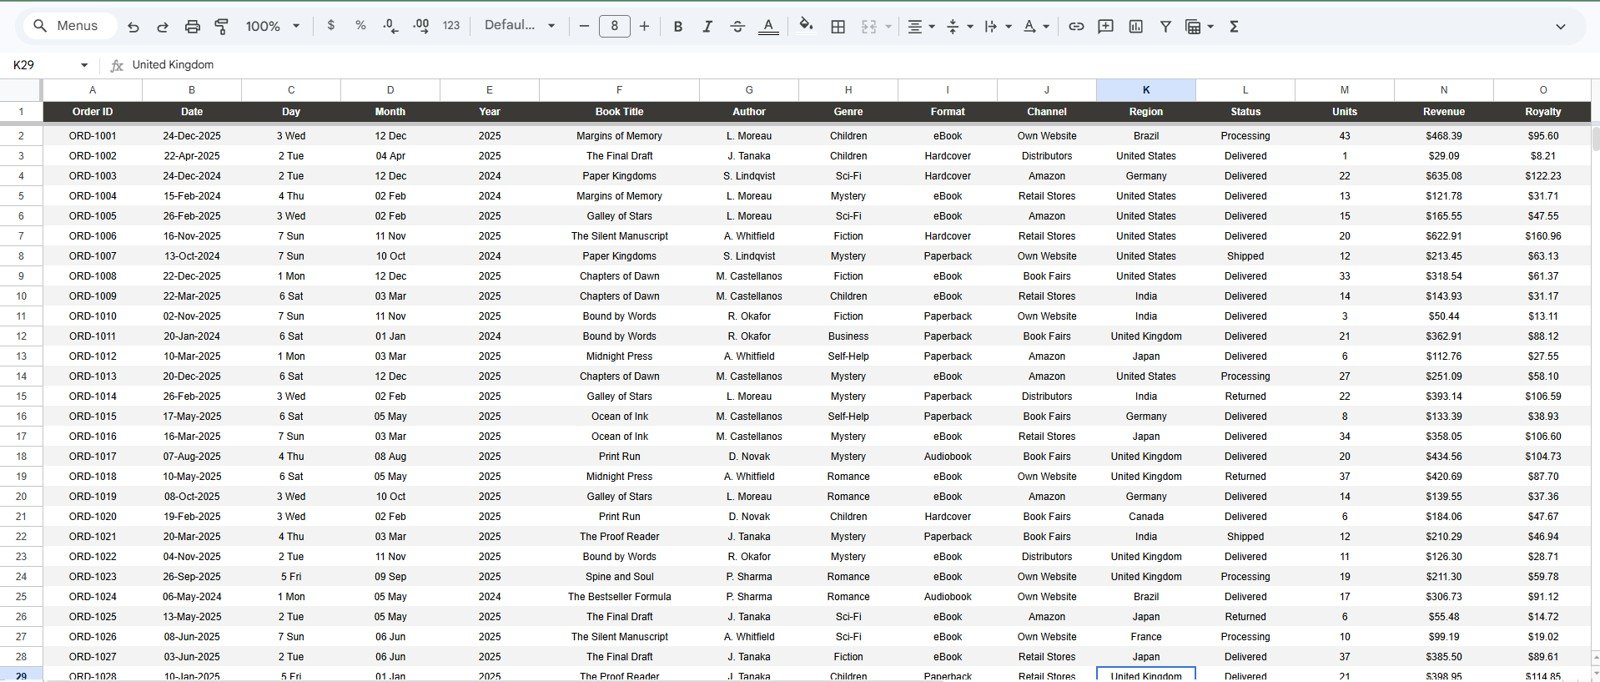
- Editable source sheet: Replace the sample publishing data in the same column format and keep the dashboard working.
- Google Drive sharing: Copy the workbook to your own Google Drive and manage access from your account.
Dashboard Pages Explanation
1. Overview Page
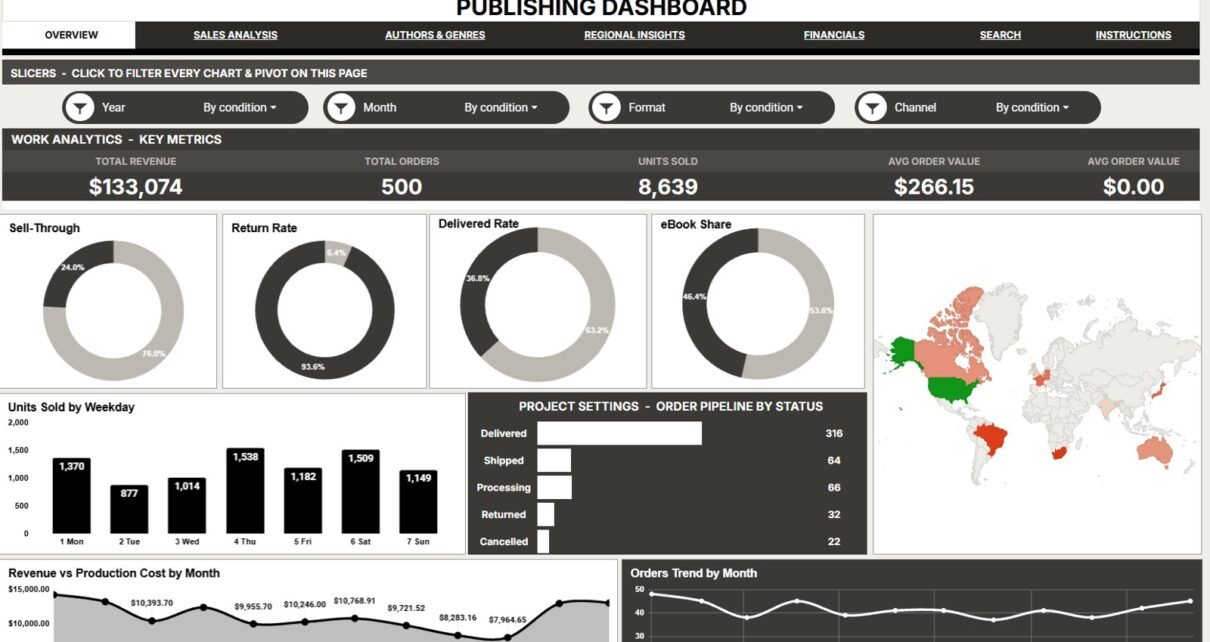
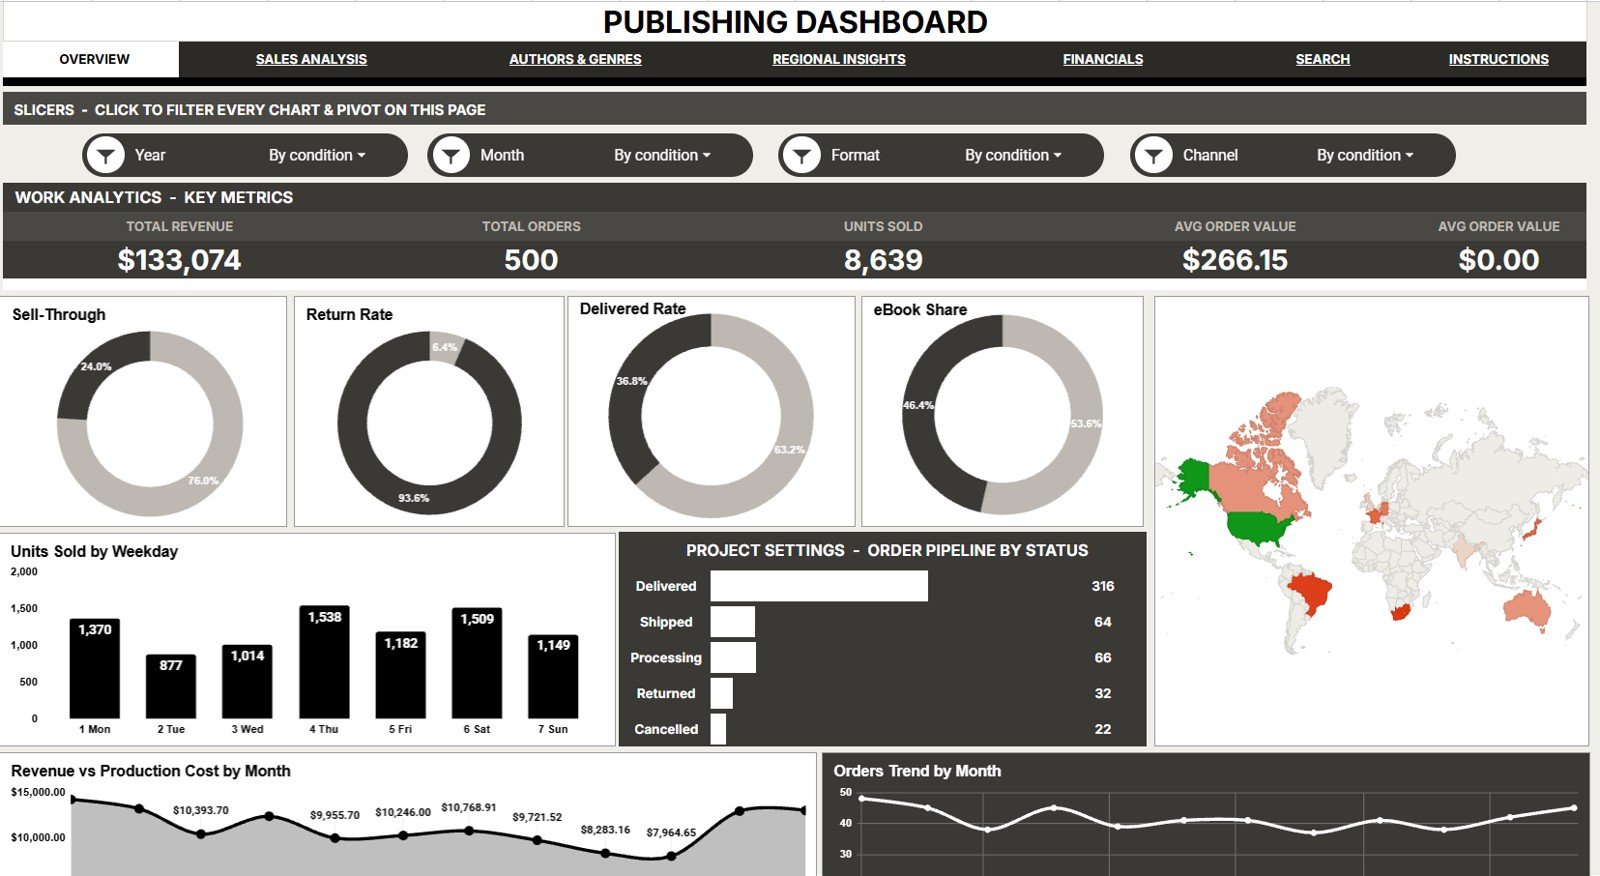
The Overview Page is the main reporting page for leadership and daily publishing review. It includes top cards for Total Revenue, Total Orders, Units Sold, and Average Order Value, plus slicers for quick filtering.
Sell-Through by Order Status: This chart shows how orders move through the available status groups. It helps users understand which statuses are converting into actual sold units.
Return Rate by Order Status: This chart compares return behavior across statuses. It helps teams identify whether returns are tied to fulfillment, format, customer segment, or order handling issues.
Delivered Rate by Order Status: This view highlights the share of orders that reach delivered status. It is useful for checking whether pending or in-progress orders are moving through the pipeline correctly.
eBook Share by Format: This chart shows the contribution of eBooks within the available book format mix. It helps publishers compare digital demand against print, audiobook, or other format categories.
Units Sold by Weekday: This chart compares unit sales across the week. It can help marketing and operations teams spot weekday patterns before planning promotions or release activity.
Order Pipeline by Status: This view shows how many orders sit in each stage of the order process. It helps managers locate backlog, delayed delivery, and follow-up priorities.
Revenue and Production Cost by Month: This chart compares monthly revenue against production cost. It helps finance teams see whether higher revenue is also producing healthier operating results.
Orders Trend by Month: This trend shows whether order volume is increasing, slowing, or seasonal. It supports campaign review, launch planning, and monthly performance discussions.
Revenue by Country: This chart ranks revenue by country. It helps publishing teams identify stronger markets and countries that may need pricing, campaign, or distribution attention.
2. Sales Analysis
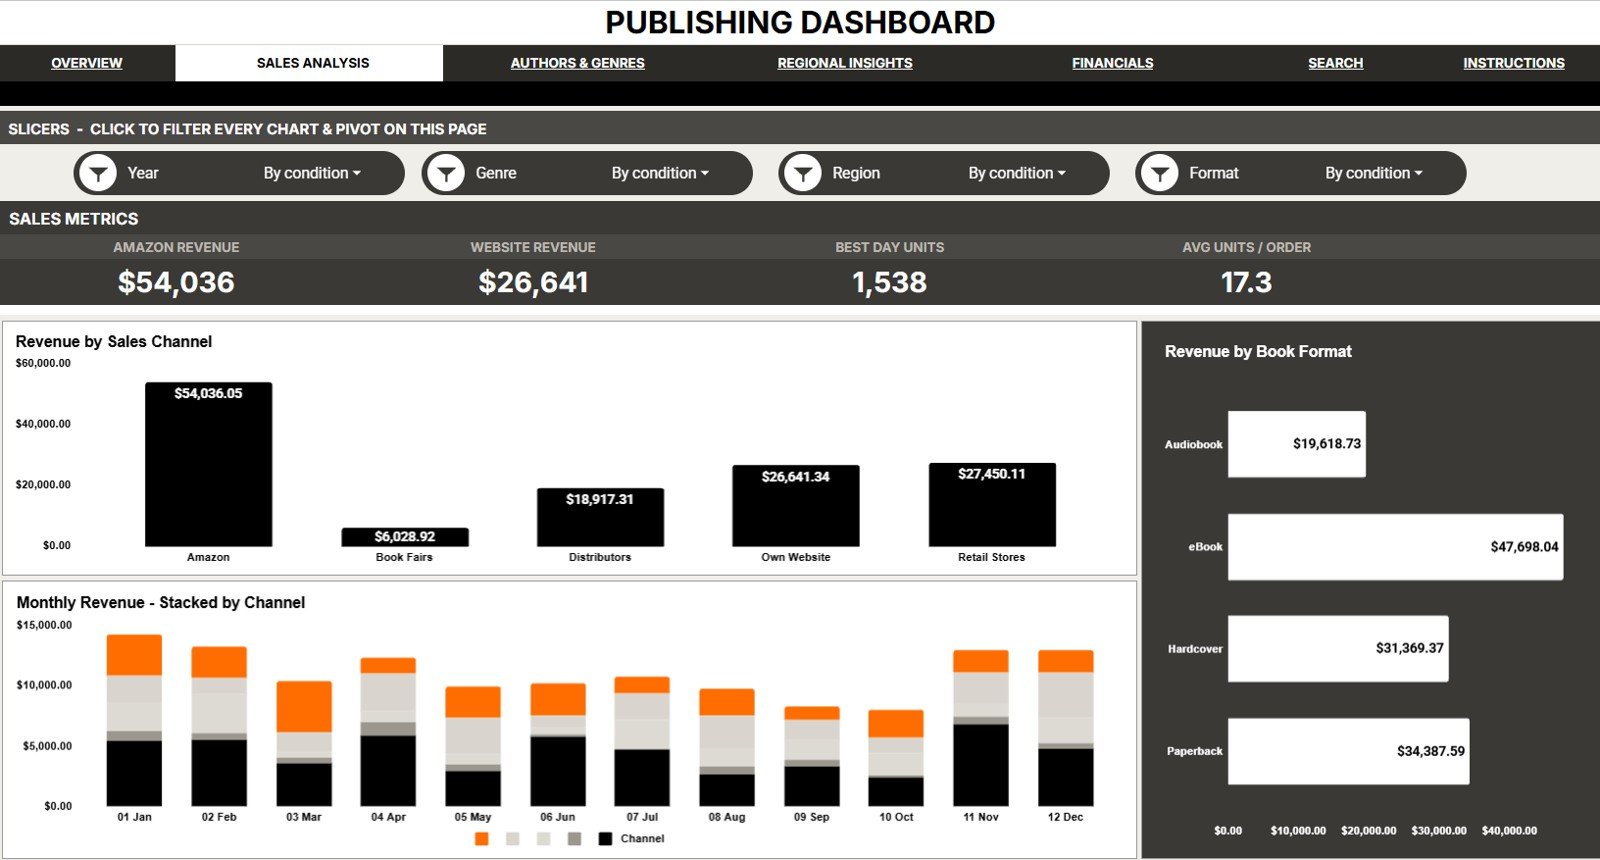
The Sales Analysis tab focuses on how revenue is generated across channels, months, and formats. It is useful for sales managers, marketers, and founders who want a clearer view of which routes to market are performing best.
Revenue by Sales Channel: This chart compares revenue contribution by channel. It helps users see whether direct sales, marketplaces, retailers, subscriptions, or other channels are driving the business.
Monthly Revenue by Channel: This chart shows how channel revenue changes over time. It helps teams identify whether a channel is growing, declining, or responding to a campaign period.
Revenue by Book Format: This chart compares revenue across format types. It helps publishers see whether print, eBook, audiobook, or other formats are carrying the strongest sales value.
3. Authors & Genres
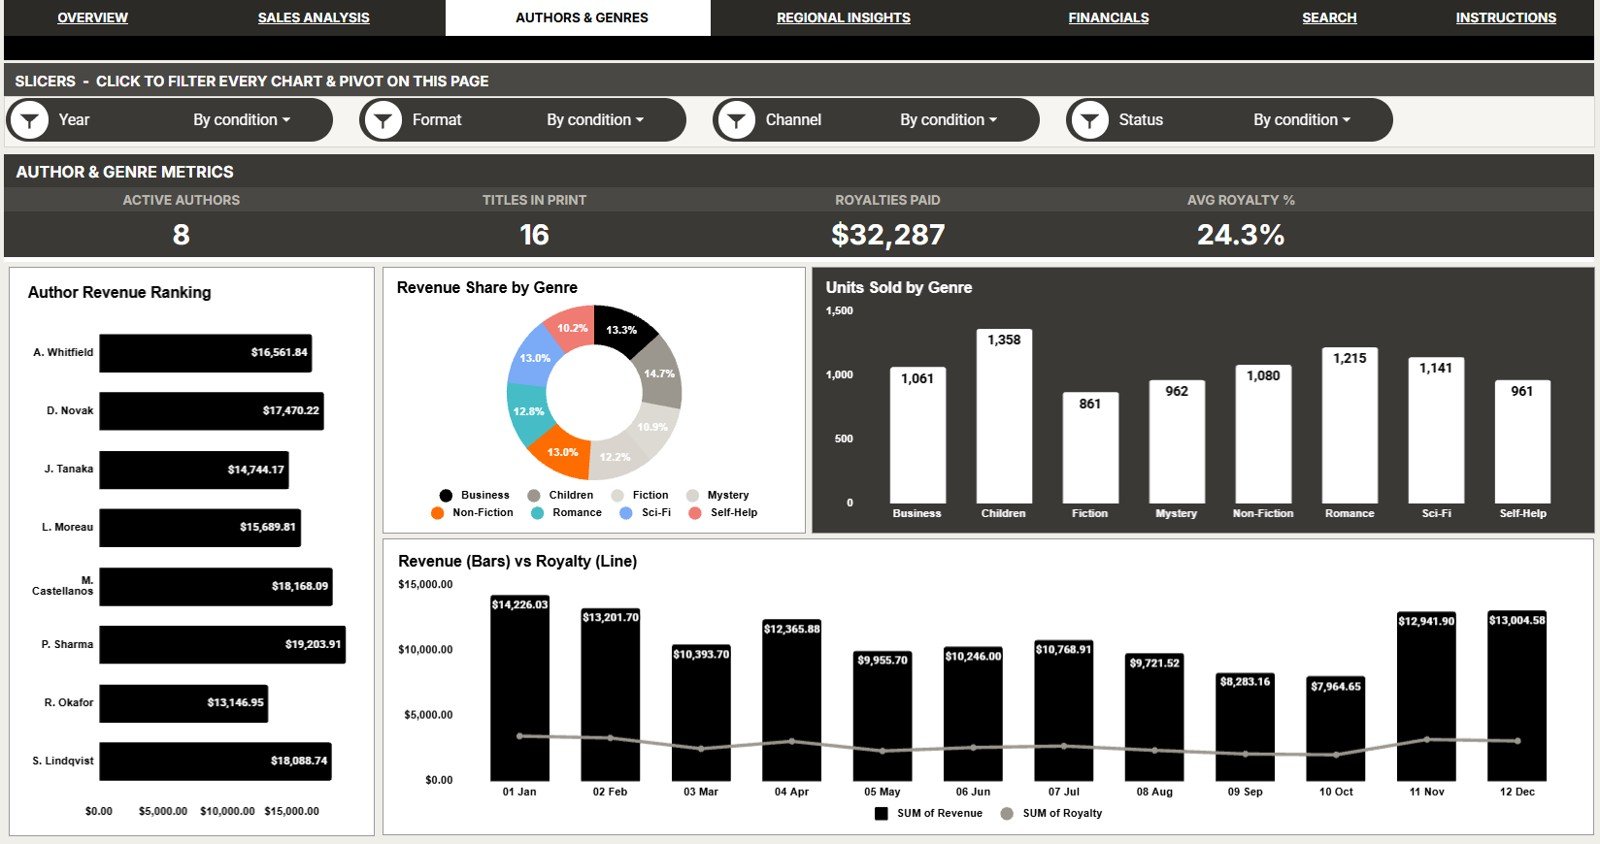
The Authors & Genres tab connects catalog performance to author and genre dimensions. This makes it easier to review creative portfolio performance rather than only total revenue.
Author Revenue by Author: This chart ranks revenue by author. It helps identify top contributors, emerging authors, and accounts that may need deeper follow-up.
Revenue Share by Genre: This chart shows how revenue is split by genre. It helps publishers review whether their catalog is balanced or concentrated in a few categories.
Units Sold by Genre: This chart compares demand volume by genre. It helps teams separate high-unit genres from high-revenue genres and plan catalog decisions with more context.
Revenue and Royalty by Month: This chart compares sales value with royalty payout timing. It supports author reporting, finance review, and month-end royalty checks.
4. Regional Insights
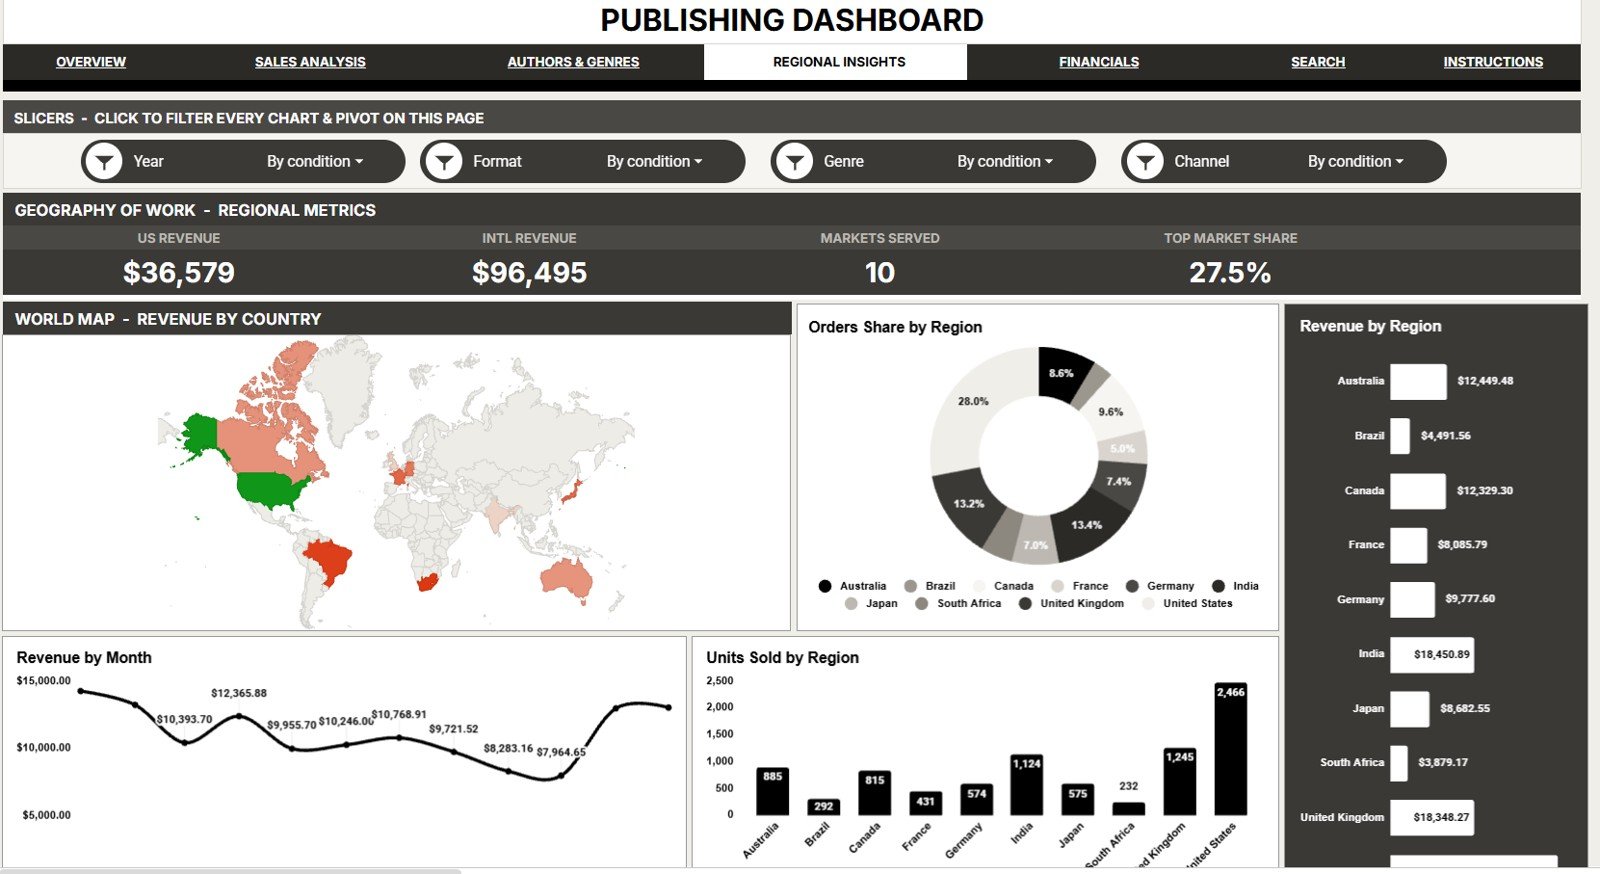
The Regional Insights tab helps publishing teams understand where orders and revenue come from. It is useful for regional sales review, translation planning, market targeting, and distributor conversations.
Revenue by Country: This chart highlights country-level revenue. It helps teams identify the countries contributing the most sales value.
Orders Share by Region: This chart shows order share across regions. It helps compare order concentration even when revenue per order differs by geography.
Revenue by Region: This chart compares revenue across regional groups. It helps leadership see which territories carry the strongest commercial weight.
Revenue by Month: This trend shows monthly revenue movement within the regional view. It helps users connect seasonality, campaigns, and geography to revenue changes.
Units Sold by Region: This chart compares unit demand by region. It helps publishers see where volume is coming from, even when average order value varies.
5. Financials
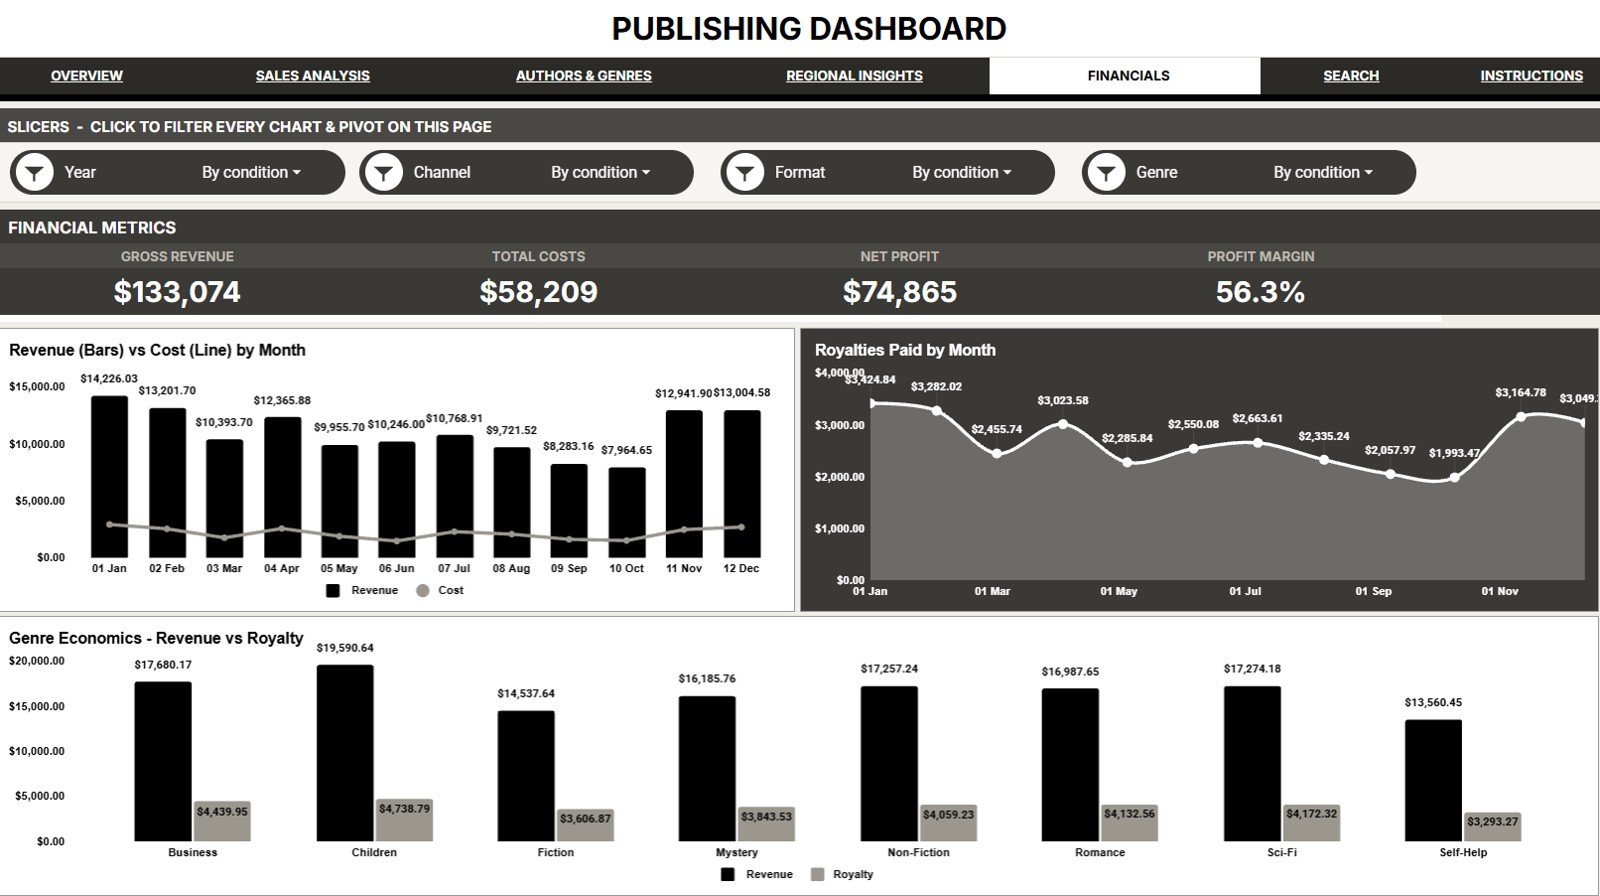
The Financials tab brings revenue, production cost, and royalties into one focused review. It helps finance and publishing managers watch the relationship between sales growth and cost pressure.
Revenue and Cost by Month: This chart compares monthly revenue with production cost. It helps users see whether each month is improving or compressing the financial picture.
Royalties Paid by Month: This chart shows royalty payout movement over time. It helps teams prepare author payments, reconcile reporting, and watch payout spikes.
Revenue and Royalty by Genre: This chart connects genre revenue with royalty amounts. It helps publishers understand which genres create the largest author-payout impact.
6. Search Sheet Tab
The Search Sheet is designed for quick order lookup. Select an Order ID to see the full order record, including date, book title, author, genre, format, channel, region, status, units, revenue, royalty, and cost.
7. Data Sheet Tab
The Data Sheet is the source table. Add or replace publishing order records in the same format so cards, charts, slicers, and search formulas continue to calculate correctly.
Publishing Dashboard in Google Sheets vs. Excel Dashboard vs. Paid CRM/SaaS – Feature Comparison
| Feature | This Google Sheets Template | Excel Dashboard | Paid Publishing SaaS |
|---|---|---|---|
| Cost | $9.99 one-time sale price | Template cost plus Excel access where needed | Monthly or annual subscription |
| Platform | Google Sheets in browser | Excel desktop or web | Vendor cloud platform |
| Setup time | Copy the workbook and replace sample data | Open workbook and replace data | Implementation, imports, and training vary |
| Real-time team collaboration | Native Google Drive sharing | Available with Microsoft cloud sharing | Usually available by plan |
| Mobile access | Google Sheets app or browser | Excel app or browser | Vendor app or browser |
| Customizable fields | Editable sheet structure | Editable workbook structure | Limited by settings and plan |
| Share with link | Yes, with owner-controlled permissions | Yes, with compatible cloud storage | Usually login controlled |
| Year-1 cost at 5 users | $9.99 template price | Depends on existing licenses | Often hundreds or thousands per year |
| Publishing analysis | Orders, revenue, status, formats, authors, genres, regions, royalties, cost, and search | Possible with custom setup | Varies by vendor module |
Who Should Use This Template
- Independent publishers tracking order exports and monthly catalog performance.
- Small publishing houses that need a shared dashboard without a larger software rollout.
- Author service businesses preparing revenue, format, and royalty summaries.
- Marketing teams comparing country, channel, genre, and weekday performance.
- Finance teams reviewing production cost, royalties paid, and month-to-month margin patterns.
Real-World Use Cases
Nadia, indie publisher: updates the Data Sheet after importing monthly order records, then uses Overview and Sales Analysis to decide which channels deserve more campaign budget.
Owen, finance lead: reviews Revenue and Production Cost by Month, Royalties Paid by Month, and Revenue and Royalty by Genre before closing the month.
Meera, author relations manager: uses Author Revenue by Author and the Search Sheet to answer author questions with the relevant order details already in one place.
Advantages of Publishing Dashboard in Google Sheets
- Lower cost: The template is a one-time purchase, so smaller teams can get structured reporting before investing in a full platform.
- Fast setup: Copy the workbook, keep the data format, and replace the sample records with your own publishing order data.
- Team-friendly sharing: Google Sheets lets the owner control who can view, comment, or edit the dashboard.
- Clear page structure: Separate tabs keep sales, author, regional, financial, search, and raw data views easier to navigate.
- Editable logic: Spreadsheet users can customize formulas, labels, chart colors, and fields when their reporting needs change.
Opportunities for Improvement
This template is intentionally spreadsheet-based, so there are a few limits to understand before purchase. It does not include automatic API connectors for marketplaces, ecommerce tools, print-on-demand systems, or royalty platforms. It also does not replace a full rights-management, contract-management, warehouse, or accounting system.
The dashboard works best when source data is clean. If order status names, author names, genres, formats, or country labels are inconsistent, the charts may split the same item into multiple categories. A quick data cleanup step before reporting will make the dashboard more reliable.
Best Practices
- Keep the Data Sheet column format unchanged: The dashboard depends on the supplied structure for formulas, charts, slicers, and search results.
- Standardize labels: Use one spelling for each author, genre, format, channel, country, region, and order status.
- Refresh after every data update: After replacing records, confirm the Overview cards and each analysis tab are calculating as expected.
- Use slicers during reviews: Filter by status, region, format, channel, or month before sharing screenshots or decisions.
- Protect formulas: Give editor access only to users who understand the workbook structure, and use viewer/commenter access for broader audiences.
Explore Relevant Templates
- Publishing KPI Dashboard in Google Sheets
- Printing & Publishing KPI Dashboard in Google Sheets
- Film and Television Dashboard in Google Sheets
- Arts and Culture Dashboard in Google Sheets
- Advertising Dashboard in Google Sheets
- Browse the full Google Sheets dashboard templates collection.
To go deeper on the reporting techniques used in dashboards like this, try the Excel Pivot Tables & Dashboards course on NextGenTemplates Academy, which includes practice files.
Get the Publishing Dashboard in Google Sheets
Frequently Asked Questions
What does the Publishing Dashboard in Google Sheets track?
It tracks revenue, orders, units sold, average order value, order status, returns, delivery, formats, weekdays, months, countries, regions, authors, genres, royalties, and production cost.
Is this template built in Google Sheets?
Yes. The dashboard is built for Google Sheets and is used from your own editable Google Drive copy.
Can I add my own order records?
Yes. Replace the sample rows in the Data Sheet tab while keeping the same column format so dashboard formulas and charts continue to work.
Does it automatically connect to Amazon KDP, Shopify, or WooCommerce?
No. This version is a spreadsheet dashboard template. You can paste or import exported records, but live API connectors are not included.
Can I share it with my team?
Yes. You can share the copied file through Google Drive and choose viewer, commenter, or editor permissions.
Can I customize charts and fields?
Yes. You can customize the workbook, but preserve the data structure unless you are comfortable updating formulas, ranges, and slicers.
About the Author
Built by PK – Microsoft Certified Professional with 15+ years of Excel, Google Sheets, and Power BI experience. Founder of NextGenTemplates, reaching 300K+ subscribers across YouTube channels. Every template is hand-built and tested before release.
Conclusion
The Publishing Dashboard in Google Sheets gives publishing teams a practical way to review orders, sales channels, book formats, authors, genres, regions, royalties, production cost, and order-level records from one editable dashboard. It is best for teams that want a clean spreadsheet reporting system before moving into a larger publishing platform.
Last updated: July 29, 2026.