The Pension Fund KPI Dashboard in Google Sheets tracks pension fund performance across 6 structured worksheets, covering MTD and YTD comparisons, target vs actual analysis, trend charts, and a built-in KPI definition sheet. With 6 pre-built pages and automated conditional formatting, this template turns pension reporting from a monthly headache into a 10-minute task. Over 42% of mid-size pension fund teams still rely on manually formatted spreadsheets for KPI reporting, according to industry surveys — this template eliminates that inefficiency.
Whether you manage a single pension plan or oversee multiple fund structures, tracking KPIs like funded status, contribution rates, expense ratios, and investment returns requires a structured system. The Pension Fund KPI Dashboard in Google Sheets brings MTD Actual, Target, Previous Year, and YTD Actual, Target, Previous Year data into one interactive view with drop-down month selection and conditional formatting arrows that highlight performance gaps instantly.
Key Features of Pension Fund KPI Dashboard in Google Sheets
👉 Click here to Purchase Pension Fund KPI Dashboard in Google Sheets
This ready-to-use Google Sheets template includes 6 worksheets designed specifically for pension fund KPI monitoring. The Dashboard sheet displays all KPI data for any selected month with MTD and YTD columns showing Actual, Target, and Previous Year values. Conditional formatting arrows (green up, red down) instantly show whether each KPI is meeting its target or falling behind.
The KPI Trend sheet lets you select any individual KPI from a drop-down and view MTD and YTD trend charts comparing Actual, Target, and Previous Year performance over 12 months. It also shows the KPI Group, Unit, Type (Lower the Better or Upper the Better), Formula, and Definition for the selected metric.
Three dedicated input sheets (Actual Numbers, Target Numbers, Previous Year Numbers) keep your data organized. The KPI Definition sheet documents every KPI with its Name, Group, Unit, Formula, Definition, and Type — ensuring consistent understanding across your pension fund team and supporting audit readiness.
Dashboard Pages Explanation
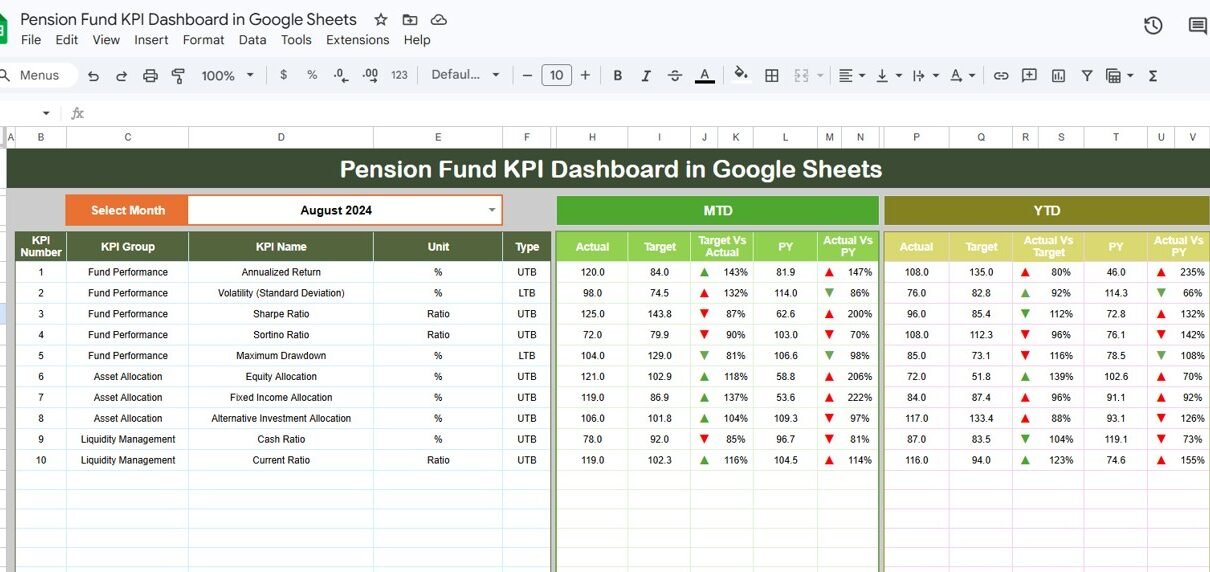
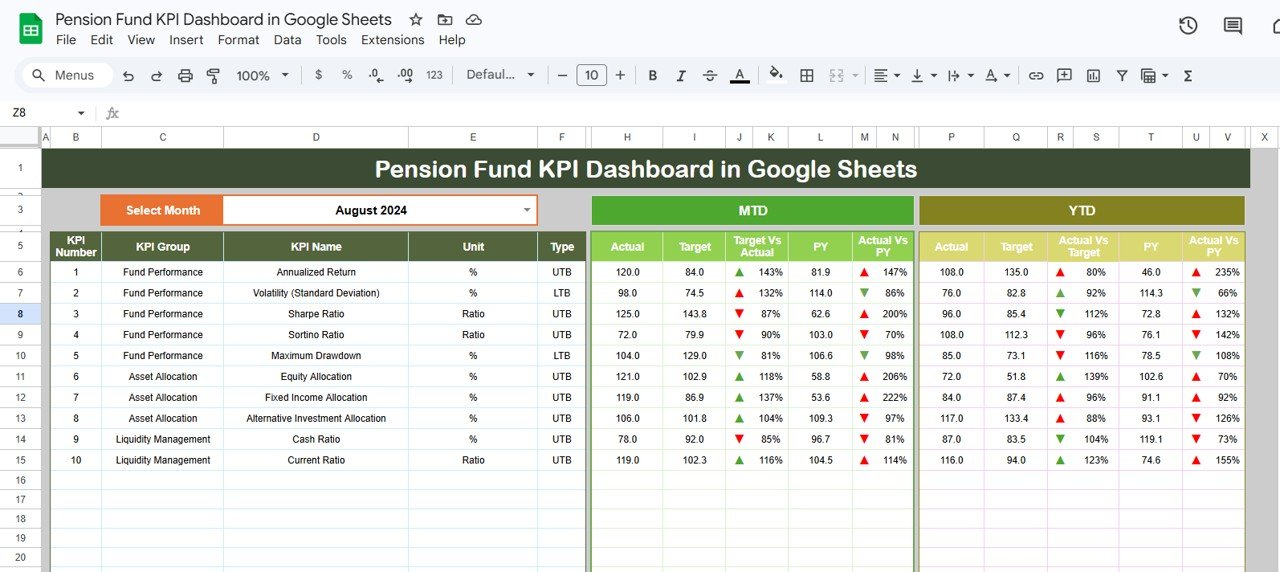
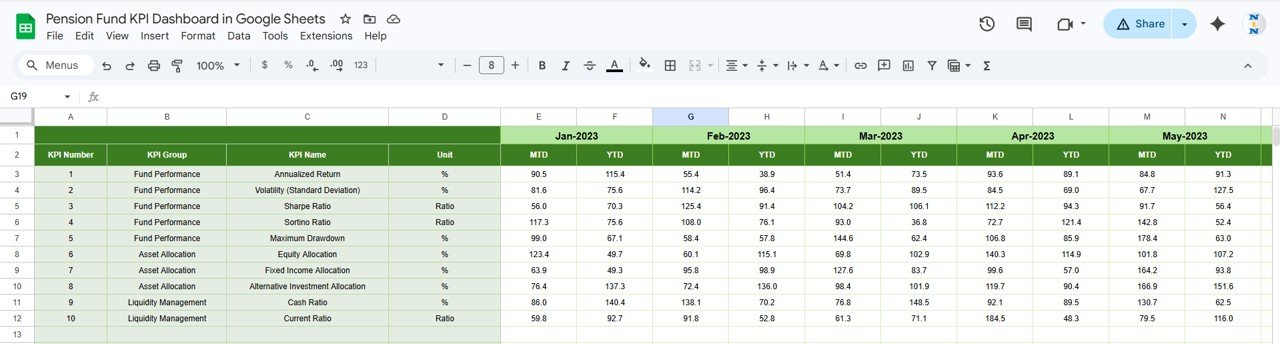
1. Dashboard Sheet
This is the main sheet tab where all KPI information is displayed. On range D3, you can select the Month from the drop-down, and the entire dashboard updates for that month. The sheet shows MTD Actual, Target, Previous Year data along with Target vs Actual and PY vs Actual with conditional formatting up/down arrows. It also shows YTD Actual, Target, Previous Year data with the same performance indicators.
 Pension Fund KPI Dashboard in Google Sheets
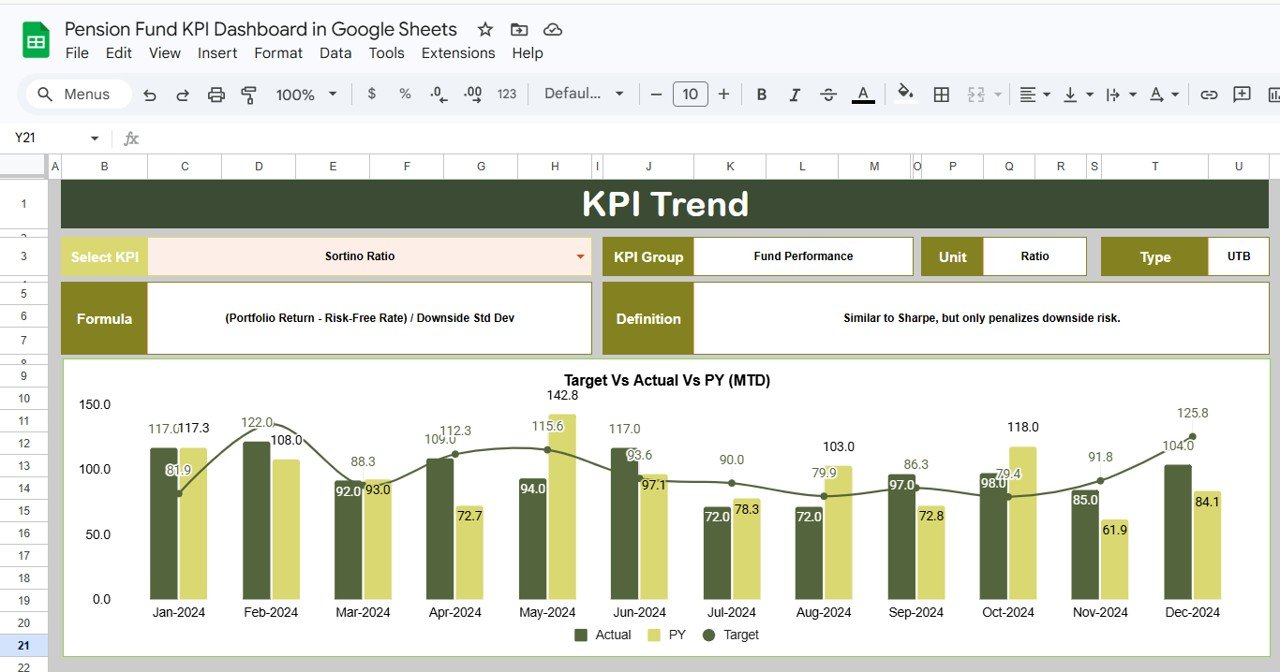
2. KPI Trend Sheet
Here you can select the KPI name from the drop-down available on range C3. The sheet displays the KPI Group, Unit of KPI, Type of KPI (Lower the Better or Upper the Better), Formula of the KPI, and Definition of the KPI. It also shows MTD and YTD trend charts for Actual, Target, and PY numbers.
 KPI Trend Sheet
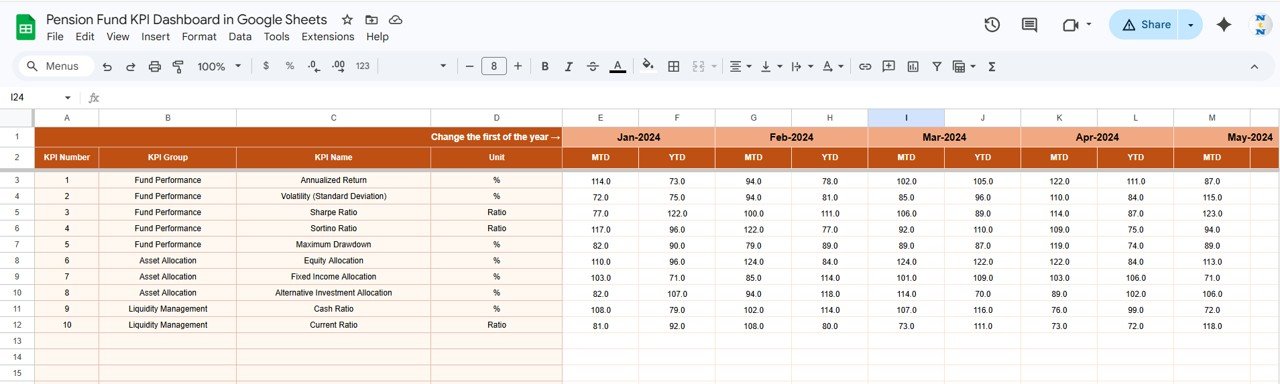
3. Actual Numbers Input Sheet
Here you enter the actual numbers for YTD and MTD for a particular month. You can change the months from range E1 — just input the first month of the year on range E1.
 Actual Numbers Input Sheet
4. Target Number Input Sheet
In this sheet tab, you enter the Target numbers for each KPI for the particular month as MTD as well as YTD.
 Target Number Input Sheet
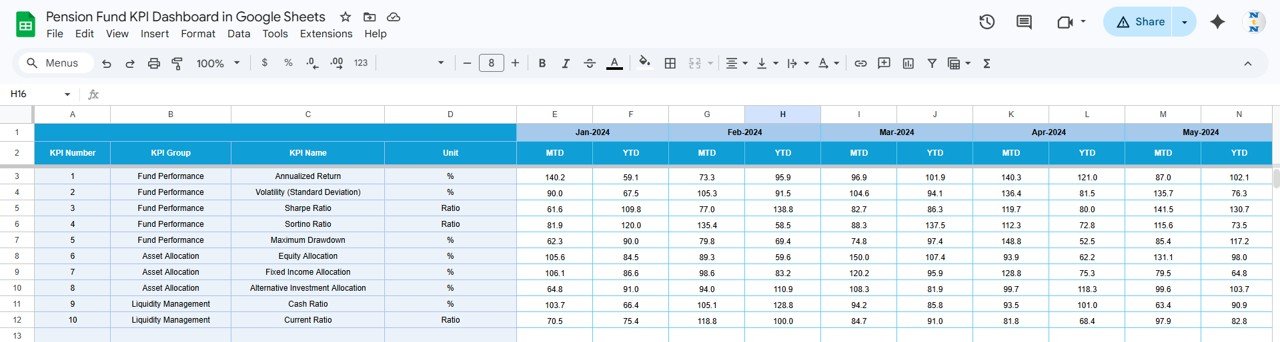
5. Previous Year Number Sheet
Enter the numbers for the previous year in the same format as you have entered for the current year data.
 Previous Year Number Input Sheet
6. KPI Definition Sheet
In this sheet tab, you enter the KPI Name, KPI Group, Unit, Formula, and KPI Definition. In the last column, enter the KPI type as LTB (Lower the Better) or UTB (Upper the Better).
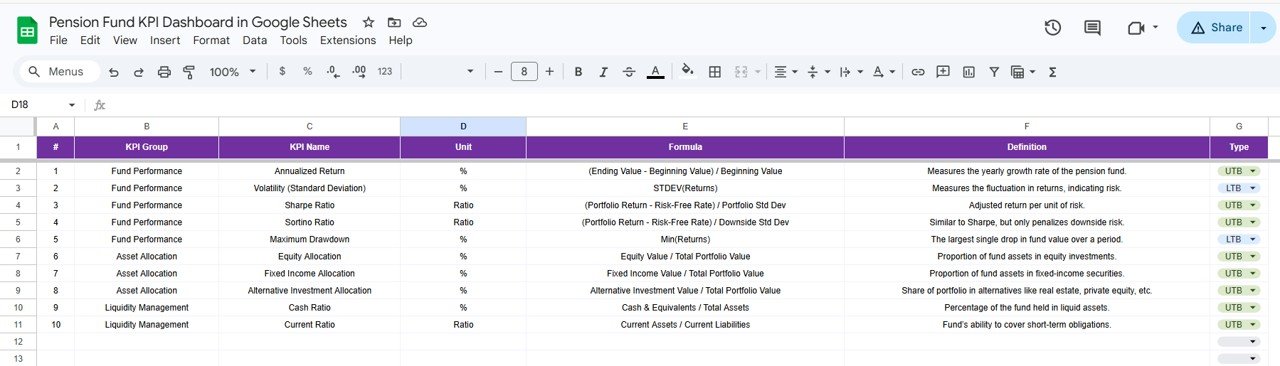 KPI Definition Sheet
Pension Fund KPI Dashboard in Google Sheets vs. Excel KPI Dashboard vs. Paid Pension SaaS — Feature Comparison
| Feature | Pension Fund KPI Dashboard in Google Sheets | Microsoft Excel KPI Dashboard | Paid Pension SaaS (e.g., PensionPro) |
|---|---|---|---|
| Cost | $8.99 one-time | $14.99 one-time | $50-200 / user / month |
| Platform | Google Sheets (browser-based) | Desktop Excel required | Web-based SaaS |
| Setup Time | Under 10 minutes | 15-30 minutes | Days to weeks |
| Real-time Collaboration | ✅ Built-in (Google Drive) | ❌ Manual file sharing | ✅ Yes |
| Mobile Access | ✅ Google Sheets app | ❌ Limited | ✅ Yes |
| Customizable KPIs | ✅ Add/edit freely | ✅ Yes | ⚠️ Limited by plan |
| MTD & YTD Tracking | ✅ Automated | ✅ Automated | ✅ Yes |
| Year-1 Cost at 5 Users | $8.99 total | $14.99 total | $3,000-12,000 |
| No Subscription | ✅ | ✅ | ❌ |
For pension fund teams that want structured KPI tracking with real-time collaboration at a fraction of SaaS costs, this Google Sheets template sits in the sweet spot.
Who Should Use This Template
Perfect for:
- Pension fund managers at organizations with 50-500+ employees tracking 10-50 KPIs monthly
- Finance and accounting teams preparing monthly and quarterly pension performance reports
- HR departments that need to present pension fund health to leadership and trustees
- Actuarial and advisory firms creating standardized KPI reports for multiple pension fund clients
Not a fit if:
- You need direct API integration with custodian or record-keeping systems
- Your organization requires SOC 2 or HIPAA-level data security for pension data
- You need real-time market data feeds for investment performance tracking
Real-World Use Cases
👉 Click here to Purchase Pension Fund KPI Dashboard in Google Sheets
Rajesh manages pension operations at a 200-person manufacturing company. He uses the Pension Fund KPI Dashboard in Google Sheets to track 15 fund performance KPIs monthly, comparing MTD actuals against targets and previous year data. The conditional formatting arrows help him identify underperforming KPIs before quarterly board meetings — saving 4 hours of manual report preparation each month.
Maria works as a pension analyst at a financial advisory firm. She uses the KPI Trend sheet to prepare client-facing performance reports showing how each pension KPI evolved over 12 months. The KPI definition sheet ensures her team uses consistent metric definitions across all client engagements.
David is the CFO at a regional healthcare organization. He shares the Google Sheets dashboard with his finance team and HR department simultaneously. Everyone accesses the same live data — no version control issues, no email attachments, and no waiting for updated spreadsheets.
Advantages of Pension Fund KPI Dashboard in Google Sheets
This template saves pension fund teams 3-5 hours per month by eliminating manual report formatting. The drop-down month selection on the Dashboard sheet means you never rebuild a report from scratch — just pick the month and every number updates. Real-time Google Sheets collaboration means your finance team, HR department, and fund administrators can all work in the same file simultaneously without version conflicts.
At $8.99 one-time, this template costs less than one hour of an analyst’s time. Compared to pension management SaaS platforms charging $50-200 per user per month, the cost savings over 12 months for a 5-person team range from $2,991 to $11,991. The KPI Definition sheet adds governance value by documenting every metric’s formula, unit, and interpretation — a feature that auditors and compliance teams appreciate.
Opportunities for Improvement
👉 Click here to Purchase Pension Fund KPI Dashboard in Google Sheets
This template does not include automated data imports from external pension administration systems. Users need to manually enter or paste data into the input sheets each month. It does not connect to live market data feeds for investment returns. The template works best for structured, periodic KPI reporting rather than real-time monitoring. Organizations with 100+ KPIs may need to extend the template’s row capacity, which requires basic Google Sheets knowledge.
Best Practices
Start by setting up the KPI Definition sheet first — define all your pension KPIs with their names, groups, units, formulas, definitions, and types (LTB/UTB) before entering any data. Enter the first month of your financial year in cell E1 of the Actual Numbers Input sheet so all monthly columns align correctly. Update data consistently — enter MTD and YTD numbers by the 5th business day of each month for timely reporting. Use the KPI Trend sheet during quarterly reviews to identify long-term patterns rather than reacting to single-month variations. Share the Google Sheet with view-only access for stakeholders who need to see results but should not edit data. For more guidance on Google Sheets collaboration features, refer to Google’s official documentation.
Explore Relevant Templates
📊 Pension Fund KPI Dashboard in Google Sheets — The template featured in this article. $8.99 one-time.
📊 Pension Fund KPI Dashboard in Power BI — The same KPI structure built for Power BI Desktop with interactive slicers and drill-through pages. $11.99.
📊 Pension Funds KPI Dashboard in Excel — 7-sheet Excel version with automated MTD/YTD insights, trend charts, and conditional formatting. $14.99.
📊 Pension Funds Dashboard in Power BI — 5-page interactive Power BI dashboard tracking contributions, fund values, risk scores, and withdrawal eligibility. $17.99.
📊 Pension Funds Dashboard in Excel — 5-page Excel dashboard for pension fund analysis with investment, plan, and monthly trend views. $17.99.
Browse all Google Sheets Dashboard Templates | KPI Dashboard Templates
Frequently Asked Questions
👉 Click here to Purchase Pension Fund KPI Dashboard in Google Sheets
What KPIs does the Pension Fund KPI Dashboard track?
The Pension Fund KPI Dashboard in Google Sheets tracks any pension-related KPI you define — fund returns, contribution rates, expense ratios, funded status, participant counts, and more. You define KPIs in the KPI Definition sheet, and all 6 worksheets reference them automatically.
How long does it take to set up this dashboard?
Setup takes under 10 minutes. Copy the Google Sheet to your Drive, enter your KPI definitions and data, and the dashboard starts working immediately. No formulas to build — everything is pre-configured.
Can I add more KPIs beyond what’s included?
Yes. The Pension Fund KPI Dashboard in Google Sheets is fully customizable. Add new KPI rows in the KPI Definition sheet and corresponding data rows in the input sheets. The dashboard and trend charts update automatically.
Does this work on mobile devices?
Yes. Since it runs in Google Sheets, you can view and edit the dashboard from the Google Sheets mobile app on iOS or Android. Real-time collaboration works across all devices.
How does this compare to paid pension management software?
The Pension Fund KPI Dashboard in Google Sheets costs $8.99 one-time versus $50-200 per user per month for SaaS alternatives like PensionPro. It covers MTD/YTD tracking, target vs actual comparison, trend analysis, and KPI documentation — the core reporting needs of most pension fund teams.
Can multiple team members work on this simultaneously?
Yes. Google Sheets supports real-time collaboration. Multiple team members can enter data, review KPIs, and analyze trends at the same time without version conflicts or file-locking issues.
Is there a video tutorial for this dashboard?
Visit our YouTube channel at YouTube.com/@NeoTechNavigators for step-by-step video tutorials covering setup, data entry, and analysis workflows for Google Sheets templates.
About the Author
Built by PK — Microsoft Certified Professional with 15+ years of Excel, Google Sheets, and Power BI experience. Founder of NextGenTemplates, reaching 300K+ subscribers across YouTube channels. Every template is hand-built and tested before release.
Conclusion
The Pension Fund KPI Dashboard in Google Sheets gives pension fund managers, finance teams, and HR departments a structured, automated way to track MTD and YTD performance against targets and previous year data. With 6 worksheets, conditional formatting indicators, KPI trend charts, and a built-in definition sheet, it replaces hours of manual reporting with a 10-minute monthly update process.
👉 Click here to Purchase Pension Fund KPI Dashboard in Google Sheets
✅ Instant download · One-time payment · No subscription
🎥 Visit our YouTube channel: Youtube.com/@NeoTechNavigators