The Fitness Performance and Revenue Dashboard in Google Sheets tracks 5 KPIs (Total Members, Total Revenue, Avg Monthly Fee, Avg Visits/Month, Active Rate) across 6 interactive pages with 16+ charts, slicer-driven filters, and a built-in member search tool. Setup takes under 10 minutes — no macros, no add-ons, no coding. Just paste your gym’s membership data and every chart updates automatically.Fitness Performance and Revenue Dashboard in Google Sheets
Most gym owners spend hours each month assembling reports from scattered spreadsheets, or pay $139–$699/month for Mindbody or Gymdesk only to discover the analytics module doesn’t actually surface the retention and class-level data they need. This Fitness Performance and Revenue Dashboard in Google Sheets solves that problem for a one-time $9.99 — delivering revenue tracking, membership demographics, class attendance analytics, and branch-level comparisons inside a tool every team member already knows how to use.
Key Features of Fitness Performance and Revenue Dashboard in Google Sheets
The Fitness Performance and Revenue Dashboard in Google Sheets includes 5 KPI cards on the Overview page, 16 analytical charts split across 4 dedicated analysis pages (Overview, Membership, Revenue, Classes), a member search page with dropdown lookup, and a structured data sheet. Multiple slicers on the Overview page let you filter every visual by branch, membership type, status, and more in real time.
- 5 KPI Cards — Total Members, Total Revenue, Avg Monthly Fee, Avg Visits/Month, and Active Rate update dynamically as you filter with slicers.
- 16 Charts Across 4 Pages — Revenue by Branch, Members by Status, Revenue Actual vs Target, Cumulative Revenue by Month, Attendance by Class, Members by Trainer, and more.
- Slicer-Driven Filtering — Filter all charts simultaneously by branch, membership type, status, or age group without editing formulas.
- Member Search Tool — Select any Member ID from a dropdown to instantly display the full profile: name, gender, age, membership type, branch, trainer, class, fees, visits, and status.
- 100% Native Google Sheets — No macros, Apps Script, or add-ons. Works on desktop, tablet, and mobile with any free Google account.
Dashboard Pages Explanation
👉 Click here to Purchase the Fitness Performance and Revenue Dashboard in Google Sheets
1 — Overview Page
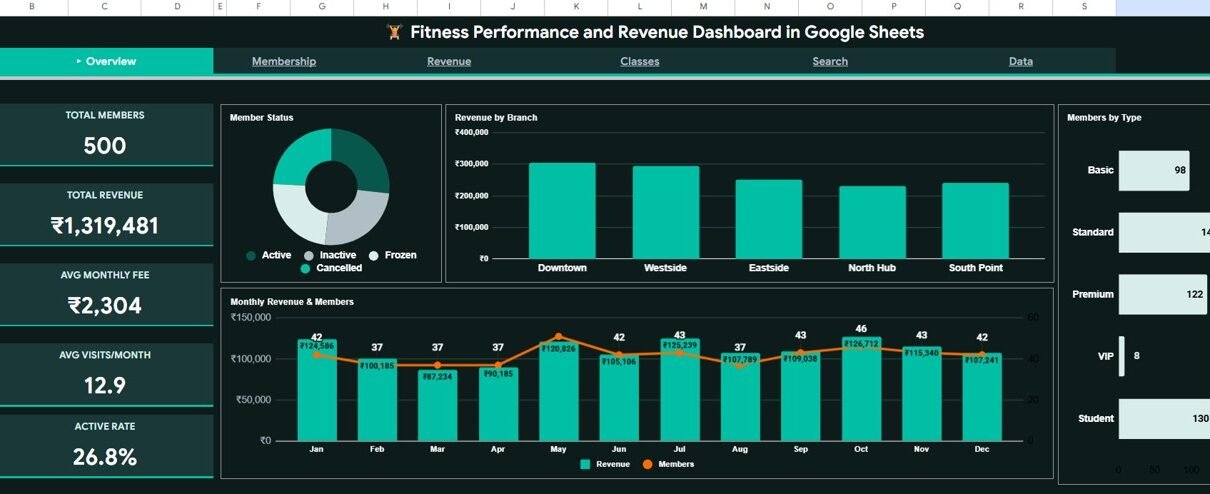
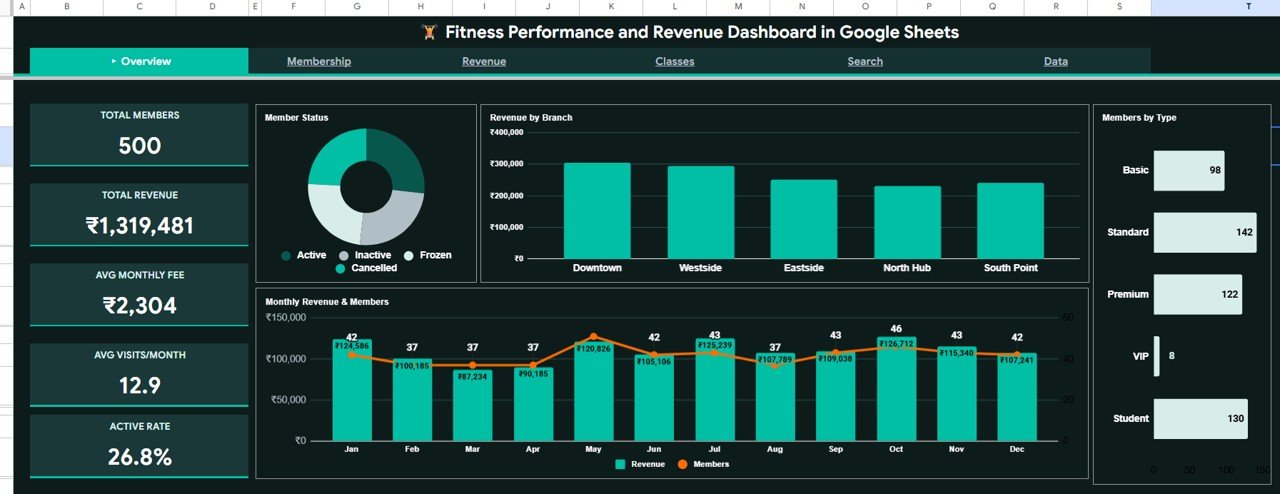
The main landing page displays 5 KPI cards at the top — Total Members, Total Revenue, Avg Monthly Fee, Avg Visits/Month, and Active Rate. Below the cards, 4 charts provide a high-level picture: Members by Status shows the active/inactive/paused breakdown, Revenue by Branch compares earnings across gym locations, Monthly Revenue and Members by Month reveals seasonal patterns, and Members by Type segments your base by plan. Slicers at the top filter all visuals simultaneously.
Overview Page
2 — Membership Page
This page focuses on member demographics and engagement patterns. Members by Age Group identifies your core audience. Gender Split by Membership Type reveals plan preferences. Monthly Visits by Age surfaces your most active brackets. Members by Referral Source shows which marketing channels drive the best results — essential for budgeting decisions.
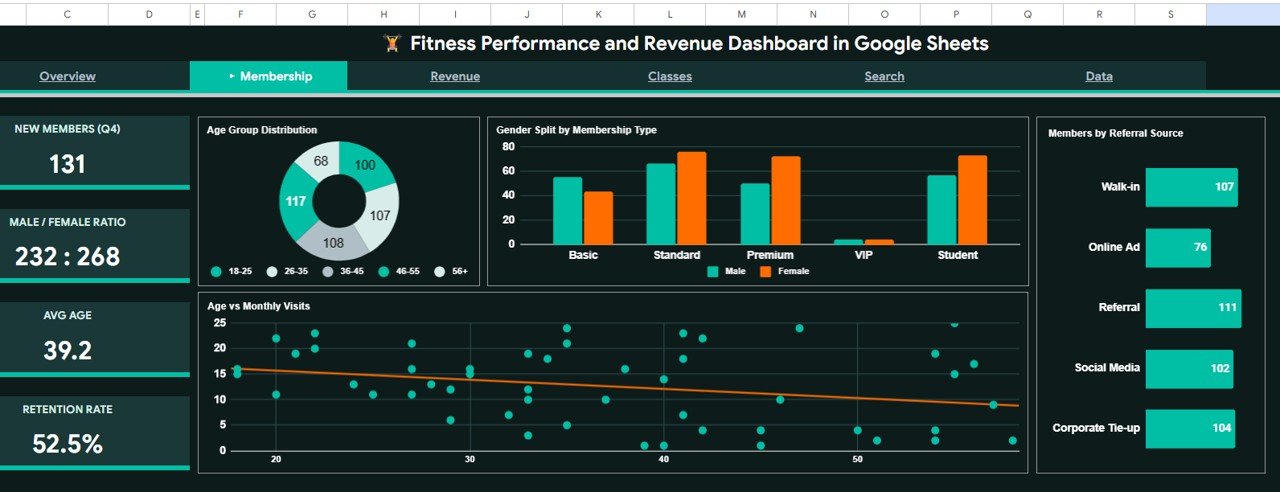
Membership Analysis Page
3 — Revenue Page
The financial heart of the dashboard. Revenue Actual vs Target by Membership Type highlights where you’re meeting goals and where you’re falling short. Revenue by Payment Method identifies preferred channels. Cumulative Revenue by Month tracks year-to-date earnings. Branch Revenue Q1 vs Q2 enables quarterly location comparisons.Fitness Performance and Revenue Dashboard in Google Sheets
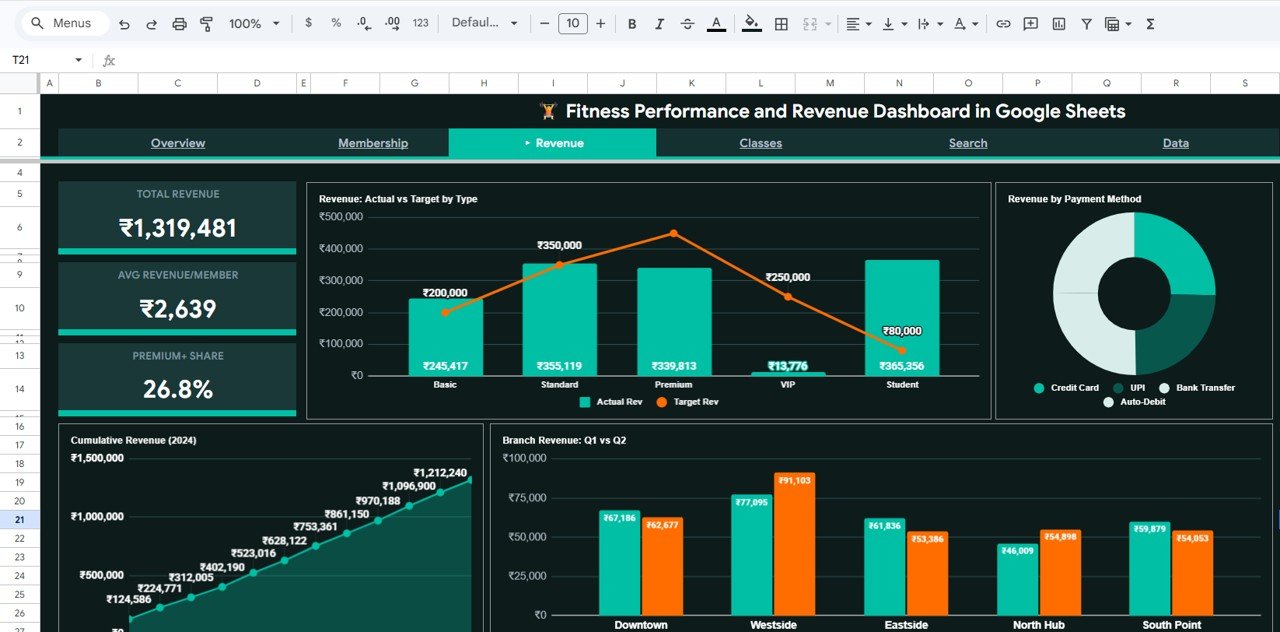
Revenue Analysis Page
4 — Classes Page
This page analyzes class operations and trainer impact. Attendance by Class identifies your most and least popular sessions. Members by Trainer reveals workload distribution. Avg Monthly Fee by Class ties session type to revenue contribution. Class Attendance by Gender helps plan targeted scheduling.
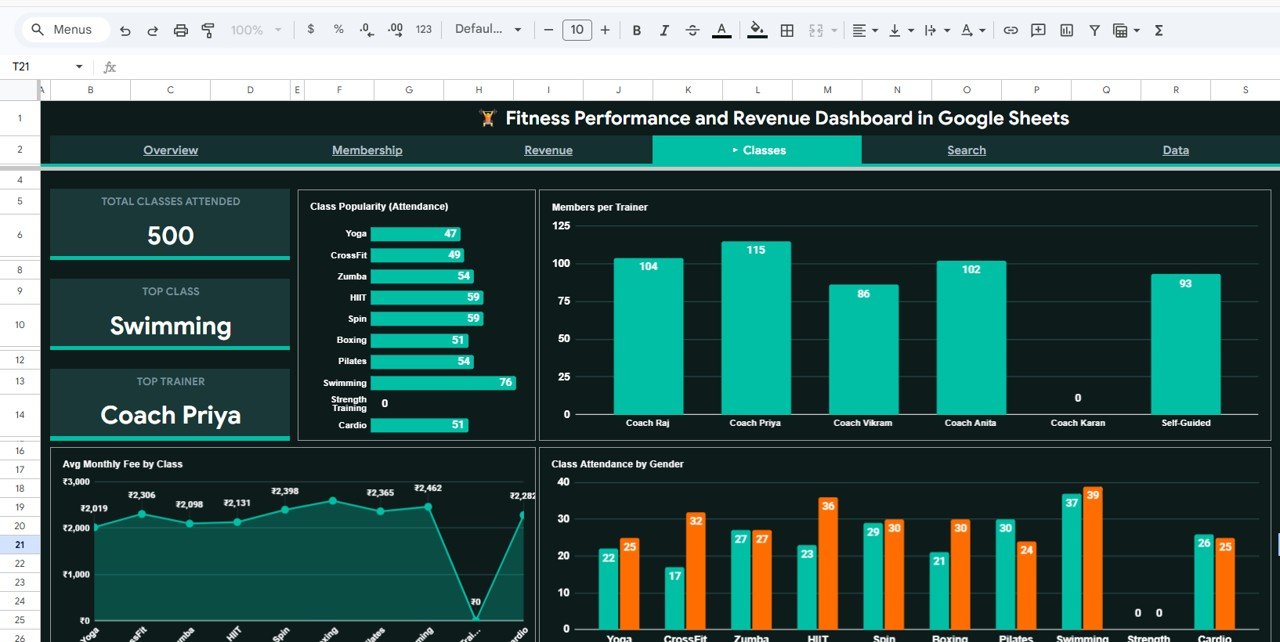
Classes Analysis Page
5 — Search Sheet
Select any Member ID from the dropdown to instantly display the complete member profile — including Member Name, Date, Gender, Age, Membership Type, Branch, Trainer, Class Attended, Monthly Fee, Revenue, Visits, and Status. This eliminates the need to scroll through raw data when looking up individual members.
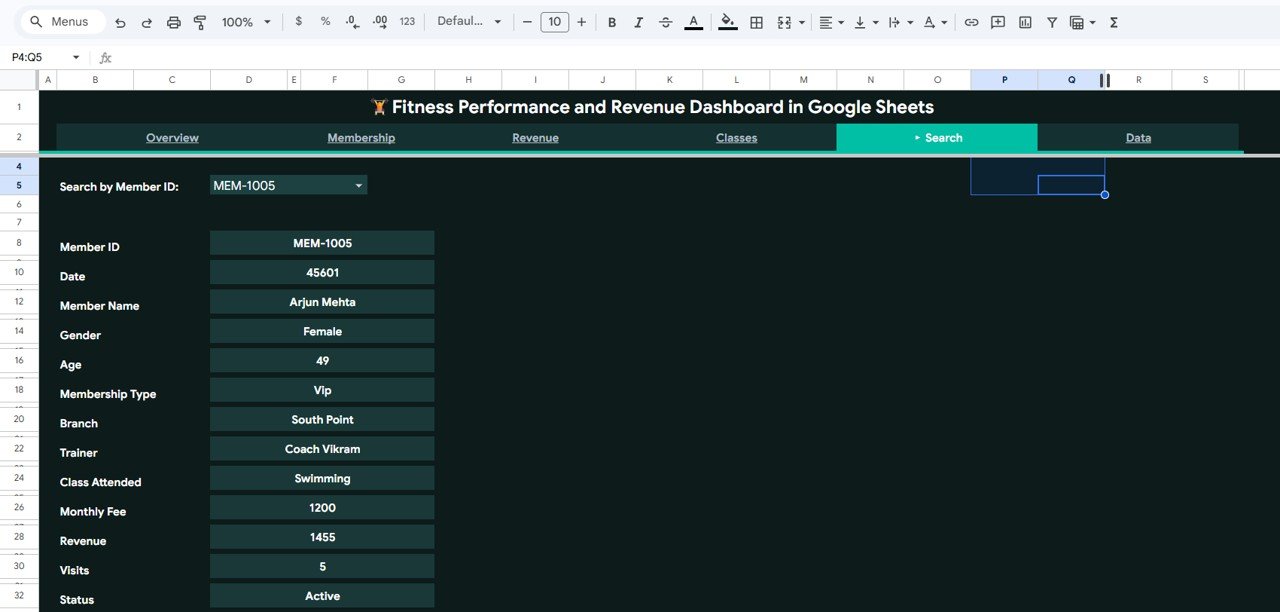
Search Sheet Tab
6 — Data Sheet
The single source of truth for all dashboard pages. Paste your gym’s membership data following the existing column format — member details, revenue figures, class info, branch data — and every KPI, chart, and analysis page refreshes automatically.Fitness Performance and Revenue Dashboard in Google Sheets
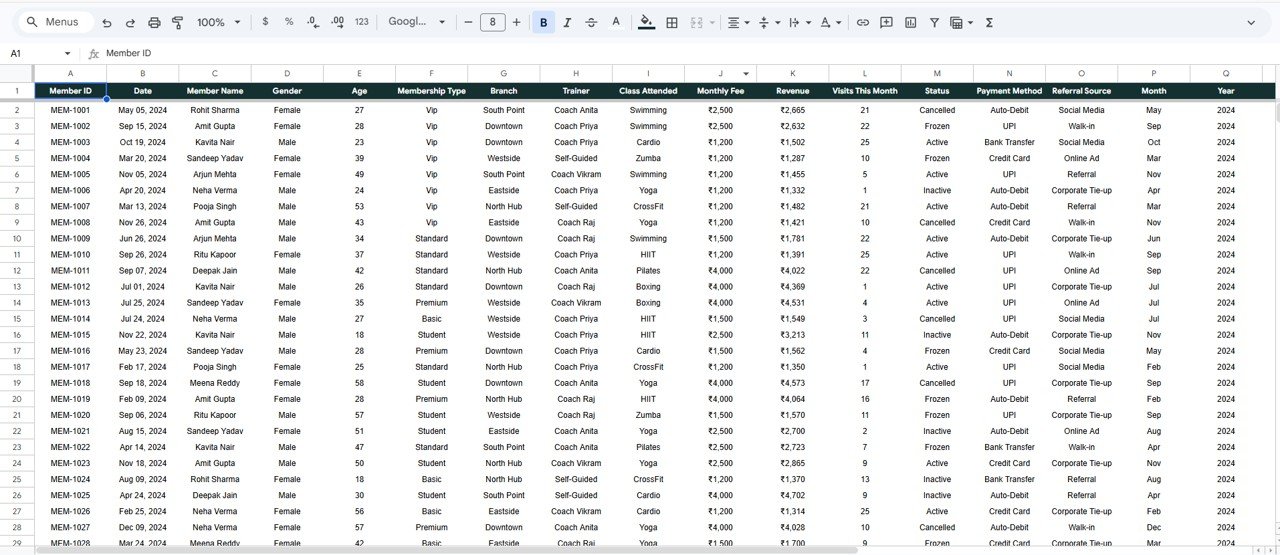
Data Sheet Tab
Fitness Performance and Revenue Dashboard in Google Sheets vs. Microsoft Excel Dashboard vs. Mindbody — Feature Comparison
| Feature | Fitness Dashboard (Google Sheets) | Excel Fitness Dashboard | Mindbody / Gymdesk |
|---|---|---|---|
| Cost | $9.99 one-time | $17.99 one-time | $139–$699/month |
| Platform | Google Sheets (free, cloud) | Excel (license required) | Cloud SaaS |
| Setup Time | Under 10 minutes | Under 10 minutes | 2–4 weeks onboarding |
| Real-Time Collaboration | ✅ Built-in | ❌ Requires OneDrive | ✅ Multi-user |
| Mobile Access | ✅ Google Sheets app | Limited | ✅ Dedicated app |
| Customizable Fields | ✅ Fully editable | ✅ Fully editable | Limited to plan tier |
| Member Search | ✅ Dropdown lookup | VBA or manual | ✅ Built-in CRM |
| Year-1 Cost (5 users) | $9.99 total | $17.99 + licenses | $1,668–$8,388 |
| Revenue vs Target | ✅ Included | ✅ Included | Depends on plan |
For gym owners and fitness studio managers who want membership analytics and revenue tracking without paying $139+/month for Mindbody, the Fitness Performance and Revenue Dashboard in Google Sheets sits in the sweet spot.
Who Should Use This Template
Perfect for:
- Gym owners and fitness studio managers tracking 50–5,000 members across 1–10 branches
- Personal training studios monitoring class attendance, trainer workload, and revenue by payment method
- Fitness business consultants building monthly reports for multiple client gyms
- CrossFit box operators and yoga studio owners who want revenue-vs-target tracking without SaaS fees
Not a fit if:
- You run a large fitness chain (500+ locations) needing enterprise access controls and API integrations
- You need automated member check-in hardware integration (kiosk, barcode, RFID)
- You require built-in billing, payment processing, or class booking — this is a reporting dashboard, not a booking system
Real-World Use Cases
👉 Click here to Purchase the Fitness Performance and Revenue Dashboard in Google Sheets
Ravi manages a 3-branch gym chain in Pune with 1,200 members. He uses the Fitness Performance and Revenue Dashboard in Google Sheets to compare revenue across branches quarterly. The Branch Revenue Q1 vs Q2 chart helped him discover that his Kothrud location was underperforming by 18%, prompting schedule and marketing adjustments. He previously paid ₹10,000+/month for Gymdesk and got similar reports.
Emily runs a boutique yoga studio in Austin with 180 members. She relies on the Membership page to identify which age groups attend most often and the Classes page to see which sessions fill up and which need promotion. The referral source chart revealed that Instagram drives 3x more signups than Google Ads — saving her $400/month in wasted ad spend.Fitness Performance and Revenue Dashboard in Google Sheets
Carlos is a fitness business consultant in Mexico City. He duplicates this Google Sheet for each of his 6 client gyms, imports their data, and delivers branded monthly performance reports. One template, $9.99, infinite reuse — versus subscribing to multiple SaaS platforms per client.
Advantages of Fitness Performance and Revenue Dashboard in Google Sheets
- Cost efficiency — $9.99 one-time replaces $1,668–$8,388/year in SaaS analytics fees for a 5-person team.
- Zero learning curve — Built on Google Sheets, which most teams already use daily. No new software to learn or install.
- Real-time collaboration — Share the file with trainers, managers, and owners. Everyone views and edits simultaneously at no extra cost.
- Mobile access — Check KPIs and charts from the Google Sheets app on any phone or tablet.
- Full customization — Every formula, chart, slicer, and color is editable. Add columns, change metrics, extend the data model.
- Instant setup — Pre-loaded sample data lets you explore every feature before adding your own records.
Opportunities for Improvement
👉 Click here to Purchase the Fitness Performance and Revenue Dashboard in Google Sheets
- No automated data import — You need to manually paste or update data in the Data sheet. There’s no API connection to your gym management system. For teams needing automated data feeds, a Power BI version may be a better fit.
- Google Sheets performance limit — While it handles 5,000–10,000 records smoothly, gyms with 50,000+ historical records may experience slower load times.
- No automated alerts — The dashboard doesn’t send notifications when a KPI drops below a threshold. You need to check the dashboard manually or build a Google Apps Script trigger separately.
- Single-currency design — Revenue columns assume one currency. Multi-currency gym chains would need to add conversion logic manually.
Best Practices
- Update data weekly — Export member records from your gym management system every Monday and paste them into the Data sheet. Weekly updates keep your KPIs and trend charts accurate.
- Use slicers before every decision — Filter by branch before making location-specific marketing or scheduling changes. Filter by membership type before adjusting pricing.
- Track revenue targets monthly — Update the target column in the Data sheet at the start of each month so the Revenue Actual vs Target chart gives meaningful comparisons.
- Review the Classes page before schedule changes — Attendance by Class and Avg Monthly Fee by Class together show which sessions drive both engagement and revenue.
- Share with read-only access first — Give trainers and front-desk staff view-only access, then upgrade to edit access for managers who need to update data. Learn more about Google Sheets sharing at Google’s official support page.
Explore Relevant Templates
📊 Gym Retention Dashboard in Google Sheets — Deep-dive into member churn, retention rates, and engagement trends.
📊 Gym Fitness Business Dashboard in Google Sheets — Broader gym operations dashboard covering revenue, expenses, and profit margins.
📊 Yoga & Wellness Studio Dashboard in Excel — Yoga and wellness-specific tracking with instructor and class analytics.
Also available as: Excel · Power BI · HTML
Browse all Google Sheets Dashboard Templates
Frequently Asked Questions
👉 Click here to Purchase the Fitness Performance and Revenue Dashboard in Google Sheets
What KPIs does the Fitness Performance and Revenue Dashboard in Google Sheets track?
The dashboard tracks 5 KPIs: Total Members, Total Revenue, Avg Monthly Fee, Avg Visits/Month, and Active Rate. All metrics update automatically when you replace the sample data with your own gym records.
Can I use this template with a free Google account?
👉 Click here to Purchase the Fitness Performance and Revenue Dashboard in Google Sheets
Yes. The Fitness Performance and Revenue Dashboard runs entirely on native Google Sheets formulas and pivot tables. No paid Google Workspace plan, add-ons, or macros are required.
How does this compare to Mindbody or Gymdesk?
Mindbody starts at $139/month and Gymdesk at $75/month. This dashboard costs $9.99 one-time with no recurring fees. It covers analytics and reporting — not booking or payment processing — making it ideal for gyms that already have a check-in system.
How many members can this dashboard handle?
Google Sheets supports up to 10 million cells. Practically, the Fitness Performance and Revenue Dashboard handles 5,000–10,000 member records smoothly. For larger datasets, consider the Power BI version.
Can multiple people use this dashboard at the same time?
Yes. Google Sheets supports real-time collaboration. Share the file with trainers, managers, or owners, and everyone can view or edit simultaneously with zero additional cost.
Can I customize the charts and add my own metrics?
Yes. Every chart, KPI formula, and slicer is fully editable. Add columns, modify chart types, change color schemes, or extend the Data sheet to include additional member fields.
How long does setup take?
Under 10 minutes. Open the Google Sheets copy link from the PDF guide, paste your data into the Data Sheet, and every dashboard page, chart, and KPI card refreshes automatically.
About the Author
Built by PK — Microsoft Certified Professional with 15+ years of Excel, Google Sheets, and Power BI experience. Founder of NextGenTemplates, reaching 300K+ subscribers across YouTube channels. Every template is hand-built and tested before release.
Conclusion
The Fitness Performance and Revenue Dashboard in Google Sheets delivers 5 KPIs, 16 charts, slicer-driven filtering, and a member search tool — all for a one-time $9.99. If you’re running a gym, fitness studio, or personal training business and want to stop paying $139+/month for analytics you can get in a familiar spreadsheet, this template is built for you.
✅ Instant download · One-time payment · No subscription
👉 Click here to Purchase the Fitness Performance and Revenue Dashboard in Google Sheets
🎥 Visit our YouTube channel: Youtube.com/@NeoTechNavigators