According to the Fundraising Effectiveness Project, the average donor retention rate across nonprofits sits at just 43.6%, meaning organizations lose more than half their donors each year. The Fundraising Campaign KPI Dashboard in Google Sheets tracks fundraising metrics across 6 worksheets with MTD and YTD comparisonsFundraising Campaign KPI Dashboard in Google Sheets against targets and prior-year data, conditional formatting arrows, and 12-month trend charts. Setup takes under 10 minutes — replace the sample data and every metric recalculates automatically.
In this article, we have created the Fundraising Campaign KPI Dashboard in Google Sheets. This is a ready-to-use template in Google Sheets.
 Fundraising Campaign KPI Dashboard in Google Sheets
Key Features of the Fundraising Campaign KPI Dashboard in Google Sheets
The Fundraising Campaign KPI Dashboard in Google Sheets delivers month-level KPI monitoring with built-in target and prior-year benchmarking. Every KPI displays MTD Actual, Target, and Previous Year numbers alongside YTD equivalents — with conditional formatting arrows showing whether performance is trending up or down against both benchmarks.Fundraising Campaign KPI Dashboard in Google Sheets
The template includes a dedicated KPI Trend sheet where you can select any individual KPI and view its 12-month Actual vs. Target vs. Previous Year trend on both MTD and YTD charts. Each KPI’s Group, Unit, Type (LTB or UTB), Formula, and Definition display alongside the charts for full context.Fundraising Campaign KPI Dashboard in Google Sheets
Three structured input sheets — Actual Numbers, Target Numbers, and Previous Year Numbers — keep data entry organized with month-by-month MTD and YTD columns. The KPI Definition sheet acts as a central registry where you define each metric’s name, group, unit, formula, description, and type. This registry feeds directly into the KPI Trend sheet’s descriptive fields.Fundraising Campaign KPI Dashboard in Google Sheets
All formulas are pre-built. The conditional formatting arrows, variance calculations, and chart references update automatically when you enter new data or switch months using the dropdown on cell D3 of the Dashboard sheet.
Dashboard Pages Explanation
📊 Click here to Purchase the Fundraising Campaign KPI Dashboard in Google Sheets
Below are the key features of this KPI Dashboard. In this dashboard, we have 6 worksheets:
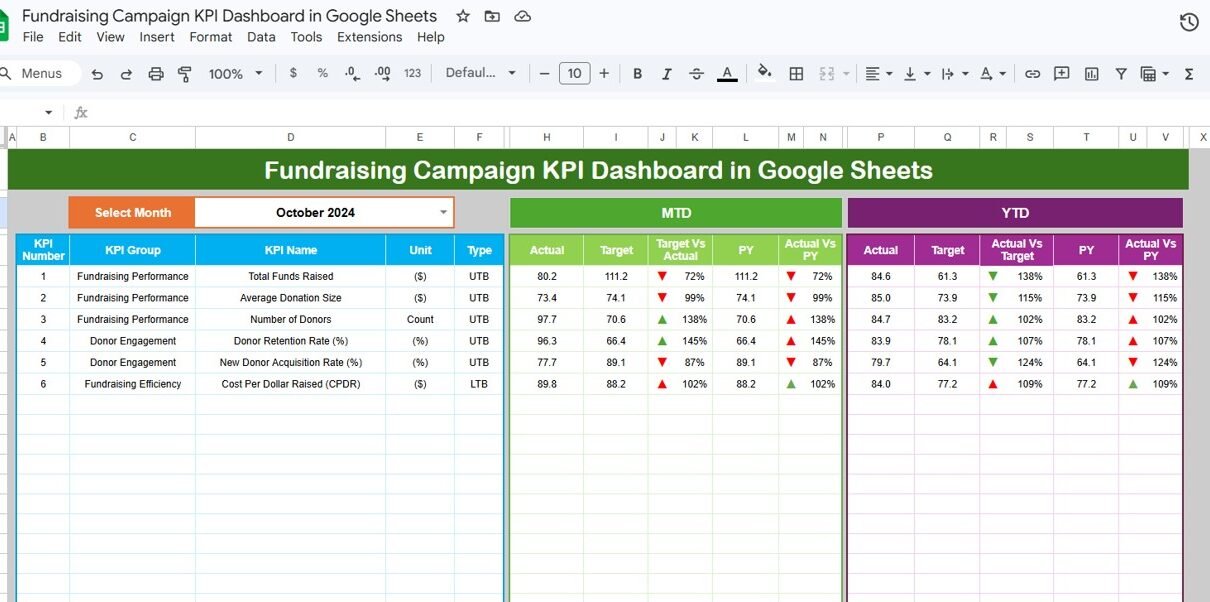
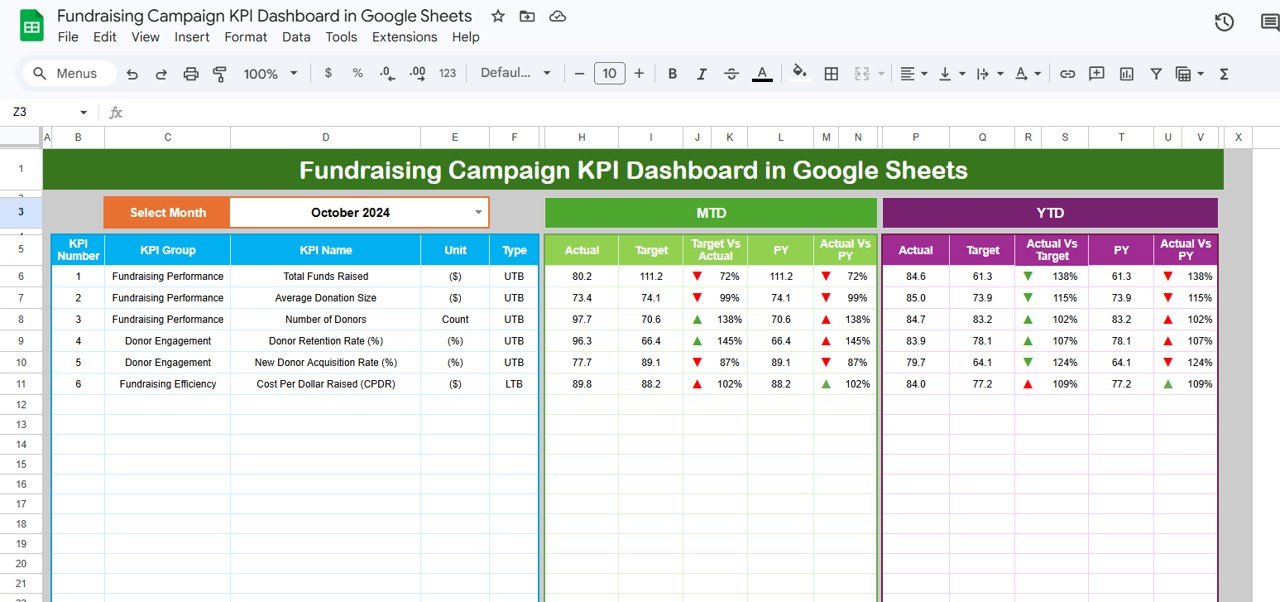
1. Dashboard Sheet Tab
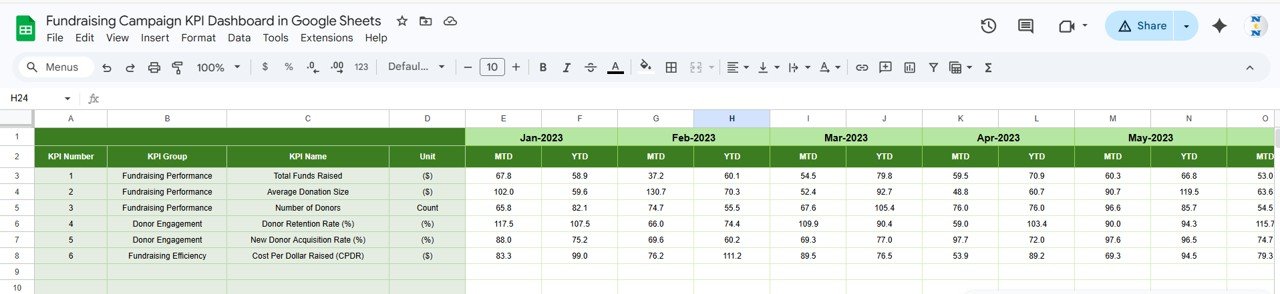
This is the main sheet tab. Here, we are showing all information about all of the KPIs. On range D3, you can select the Month from the drop-down. The whole dashboard numbers will change for that month.
Here, we are showing the MTD Actual, Target, Previous Year data along with the Target Vs Actual and PY vs Actual with conditional formatting up-down arrows. We are also showing YTD Actual, Target, Previous Year data along with the Target Vs Actual and PY vs Actual with conditional formatting up-down arrows.
Fundraising Campaign KPI Dashboard in Google Sheets2. KPI Trend Sheet Tab
Here you can select the KPI name from the drop-down available on range C3. We have displayed the KPI Group, Unit of KPI, Type of KPI (Lower the Better or Upper the Better), Formula of the KPI, and Definition of the KPI. We are also showing the MTD and YTD trend chart for Actual, Target, and PY numbers.
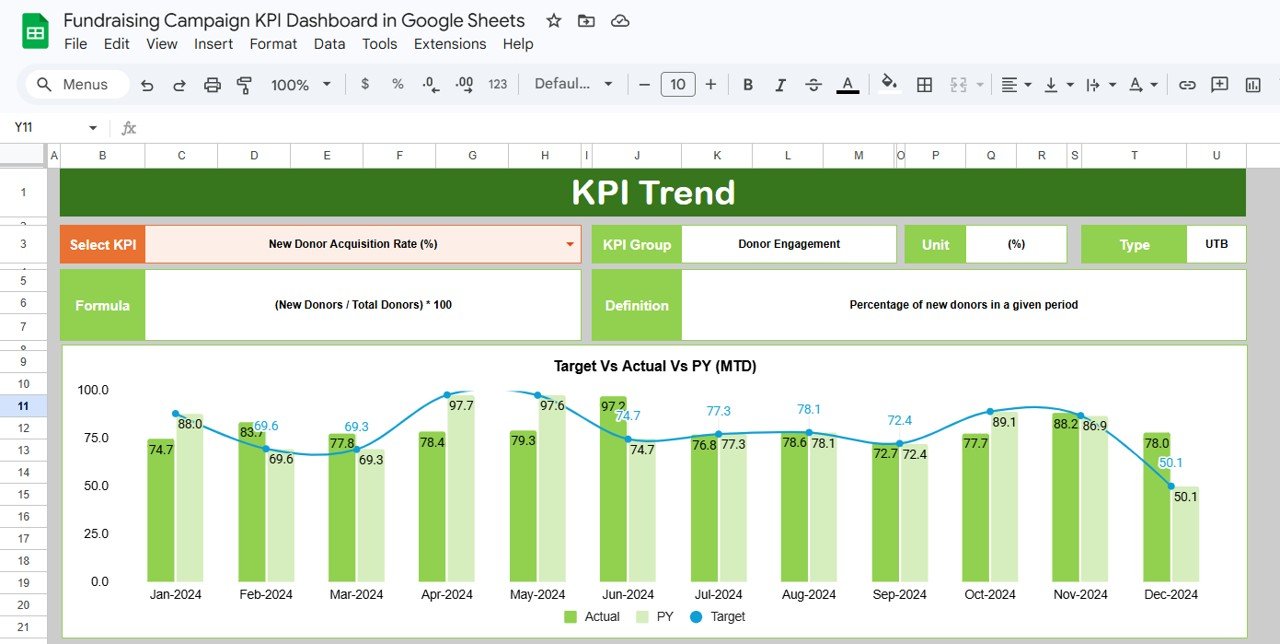 KPI Trend Sheet
3. Actual Numbers Input Sheet
Here you have to enter the actual numbers for YTD and MTD for a particular month. You can change the months from range E1. Just input the first month of the year on range E1.
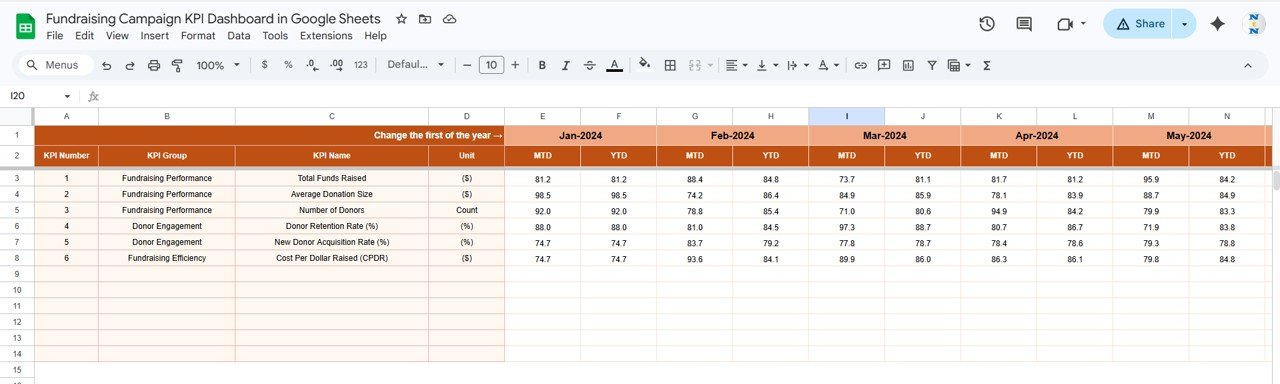 Actual Numbers Input Sheet
4. Target Number Input Sheet
In this sheet tab, you have to enter the Target numbers for each KPI for the particular month as MTD as well as YTD.
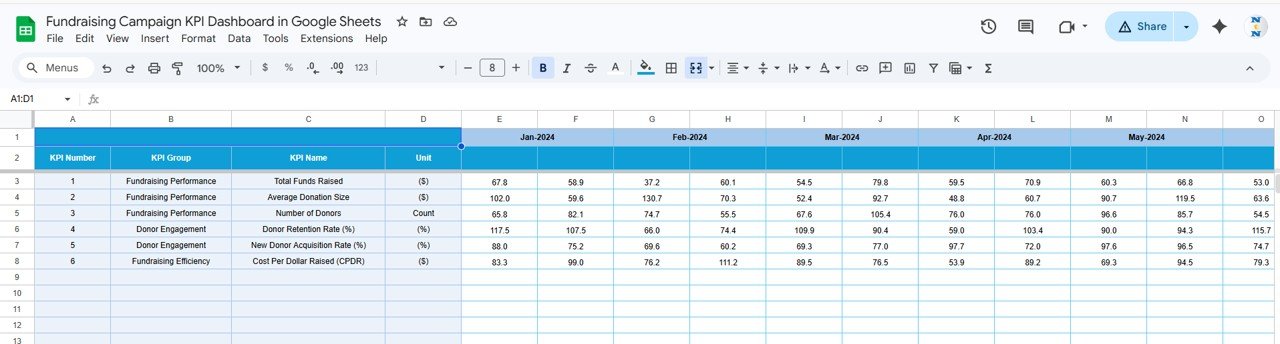 Target Number Input Sheet
5. Previous Year Number Sheet Tab
Enter the numbers for the previous year here, same as you have entered for the current year.
 Previous Year Number Input Sheet
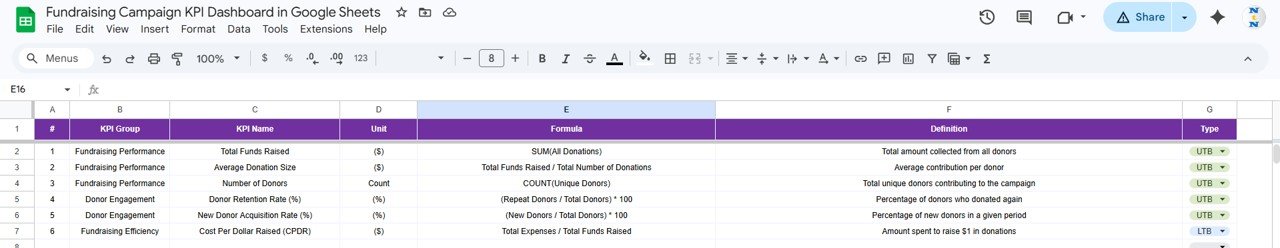
6. KPI Definition Sheet Tab
In this sheet tab, you have to enter the KPI Name, KPI Group, Unit, Formula, and KPI definition. In the last column, enter the KPI type as LTB (Lower the Better) or UTB (Upper the Better).
 KPI Definition Sheet
Fundraising Campaign KPI Dashboard vs. Excel Fundraising Dashboard vs. Bloomerang — Feature Comparison
| Feature | Fundraising Campaign KPI Dashboard (Google Sheets) | Excel Fundraising Dashboard | Bloomerang / DonorPerfect |
|---|---|---|---|
| Cost | $8.99 one-time | $14.99–$17.99 one-time | $99–$349/month |
| Platform | Google Sheets (free) | Microsoft Excel (license needed) | Cloud SaaS |
| Setup Time | Under 10 minutes | 10–15 minutes | 2–4 weeks onboarding |
| Real-Time Collaboration | ✅ Built-in | ❌ File sharing only | ✅ Yes |
| Mobile Access | ✅ Google Sheets app | Limited | ✅ Yes |
| Customizable KPIs | ✅ Add/modify any KPI | ✅ Modify formulas | Limited to built-in reports |
| Share with Link | ✅ One click | ❌ Email attachment | ✅ Dashboard sharing |
| Year-1 Cost (5 users) | $8.99 total | $14.99–$17.99 total | $1,188–$4,188 |
| Prior Year Comparison | ✅ Built-in PY tracking | ✅ Manual setup | ✅ Automated |
For nonprofit teams that want KPI tracking without paying $100+/month for donor management software, the Fundraising Campaign KPI Dashboard sits in the sweet spot.
Who Should Use This Template
Perfect for:
- Nonprofit fundraising managers tracking campaign performance across multiple annual drives
- Small-to-mid charity organizations (1–50 staff) that need KPI visibility without enterprise software costsFundraising Campaign KPI Dashboard in Google Sheets
- Board members and executive directors who need monthly or quarterly fundraising performance reports Fundraising Campaign KPI Dashboard in Google Sheets
- Freelance grant writers and development consultants tracking outcomes for multiple nonprofit clients
Not a fit if:
- Your nonprofit has 500+ staff and needs CRM integration with Salesforce NPSP or Raiser’s Edge
- You require automated online donation tracking with payment gateway synchronization
- Your team needs built-in email marketing, donor segmentation, and communication workflow tools
Real-World Use Cases
📊 Click here to Purchase the Fundraising Campaign KPI Dashboard in Google Sheets
Maria manages fundraising at a 25-person animal welfare nonprofit. She uses the Fundraising Campaign KPI Dashboard to track monthly donation targets, donor retention rates, and cost per dollar raised across three annual campaigns. Instead of paying $199/month for Bloomerang, she presents board-ready KPI reports directly from Google Sheets — saving her organization $2,388 per year.
James is a development director at a community food bank. He tracks 15 fundraising KPIs including grant success rate, average gift size, and event revenue per attendee. The KPI Trend sheet helps him identify which months underperform against targets, so he can adjust outreach timing. His team of four accesses the same dashboard simultaneously through Google Sheets sharing.
Priya consults for three small nonprofits as a freelance fundraising strategist. She duplicates the dashboard for each client, entering their specific KPIs and targets. The Previous Year comparison lets her show clients exactly where their fundraising has improved — and where it hasn’t — without building custom reports from scratch each quarter.
Advantages of the Fundraising Campaign KPI Dashboard
The one-time $8.99 cost replaces ongoing SaaS subscriptions that can run $1,200–$4,200 per year for a 5-person team. Because it runs in Google Sheets, every team member can edit simultaneously without version conflicts or file-sharing workarounds.
The MTD plus YTD dual tracking with prior-year comparison gives fundraising managers three benchmarks for every single KPI — current month performance, year-to-date trajectory, and year-over-year trend. The conditional formatting arrows make it immediately obvious which metrics need attention without reading individual numbers.
The KPI Definition sheet functions as a living data dictionary for your fundraising metrics. New team members can look up any KPI’s formula, unit, group, and definition in one place, which reduces onboarding time and ensures everyone calculates metrics the same way.
Opportunities for Improvement
This dashboard tracks KPI numbers you enter manually — it does not connect directly to donation platforms like Stripe, PayPal, or GoFundMe. Organizations processing thousands of transactions monthly may find manual data entry time-consuming compared to automated CRM integrations.
The template does not include donor-level detail, communication tracking, or segmentation features. If your team needs to track individual donor histories, send targeted emails, or manage pledge schedules, a dedicated donor CRM would be a better fit alongside this dashboard.
Chart formatting is limited to Google Sheets’ built-in options. Teams that need publication-quality data visualizations or interactive drill-down capabilities may want to pair this with a Power BI dashboard for presentation-grade reporting.
Best Practices
📊 Click here to Purchase the Fundraising Campaign KPI Dashboard in Google Sheets
Update your actual numbers on the same day each month — consistency in data entry timing makes trend analysis meaningful. Set a recurring calendar reminder for your team’s designated data entry person.
Fill out the KPI Definition sheet before entering any numbers. Agree on formulas, units, and LTB/UTB designations upfront so your team interprets every metric the same way from day one.
Use the Previous Year sheet even if you’re starting fresh — enter estimated or partial data so the PY comparison columns aren’t blank. After your first full year, the year-over-year trends become your most valuable planning tool.
Share the Google Sheets file with view-only access for board members and edit access for your data entry team. This prevents accidental formula changes while giving leadership instant access to current fundraising performance. Learn more about Google Sheets sharing controls at Google Support.
Explore Relevant Templates
📊 Charity Fundraising KPI Dashboard in Google Sheets — Tracks charity-specific KPIs with the same MTD/YTD structure and conditional formatting.
📊 Nonprofit Fundraising Dashboard in Google Sheets — A visual analytics dashboard with charts and multiple analysis pages for nonprofit fundraising.
📊 Charity Fundraising KPI Scorecard in Google Sheets — A traffic-light scorecard format for quick fundraising performance reviews.
📊 Donation Management Tracker in Google Sheets — Track individual donations, donors, and gift history.
📊 Church Finance Dashboard in Google Sheets — Financial tracking tailored for religious organizations.
🔗 Also available: Nonprofit Fundraising Dashboard in Excel | Nonprofit Fundraising Dashboard in HTML
Frequently Asked Questions
📊 Click here to Purchase the Fundraising Campaign KPI Dashboard in Google Sheets
What KPIs does the Fundraising Campaign KPI Dashboard track?
The Fundraising Campaign KPI Dashboard tracks any fundraising metric you define — donation totals, donor retention, campaign ROI, cost per dollar raised, grant success rate, and more. You add your own KPIs in the KPI Definition sheet with full descriptions and formulas.
How long does setup take for this fundraising dashboard?
Setup takes under 10 minutes. Copy the Google Sheets file to your Drive, enter your KPI definitions, add target and actual numbers, and the Dashboard sheet displays all comparisons automatically with conditional formatting arrows.
Can I track both MTD and YTD fundraising performance?
Yes. Every KPI in the Fundraising Campaign KPI Dashboard shows both Month-to-Date and Year-to-Date numbers for Actual, Target, and Previous Year — with automatic variance calculations and directional arrows.
How does this compare to Bloomerang or DonorPerfect?
The Fundraising Campaign KPI Dashboard costs $8.99 one-time versus $99–$349/month for Bloomerang or DonorPerfect. It covers KPI tracking and reporting without the CRM features like donor communication or online donation processing that those platforms include.
Can multiple team members edit this dashboard at the same time?
Yes. Google Sheets supports real-time collaboration — your entire fundraising team can view and edit the dashboard simultaneously from any device with a browser or the Google Sheets mobile app.
Does this template work on Mac and mobile devices?
Yes. The Fundraising Campaign KPI Dashboard runs entirely in Google Sheets, which works on Windows, Mac, Chromebook, iOS, and Android. No desktop software installation needed.
Can I customize the KPIs in this dashboard?
The KPI Definition sheet lets you add, remove, or modify any KPI. Enter the name, group, unit of measurement, formula, description, and whether the KPI is Lower the Better (LTB) or Upper the Better (UTB).
About the Author
Built by PK — Microsoft Certified Professional with 15+ years of Excel, Google Sheets, and Power BI experience. Founder of NextGenTemplates, reaching 300K+ subscribers across YouTube channels (@PK-AnExcelExpert, @NextGenTemplates, @NeoTechNavigators). Every template is hand-built and tested before release.
Conclusion
The Fundraising Campaign KPI Dashboard in Google Sheets gives nonprofit teams a structured, shareable way to monitor fundraising performance with MTD and YTD tracking, target comparisons, prior-year benchmarking, and trend charts — all for a one-time $8.99 investment.
📊 Click here to Purchase the Fundraising Campaign KPI Dashboard in Google Sheets
✅ Instant download · One-time payment · No subscription · Lifetime access
🎥 Visit our YouTube channel for step-by-step video tutorials:
👉 Youtube.com/@NeoTechNavigators