Personalization is one of the highest-leverage levers in modern marketing — but it only compounds if you can measure it. According to Google Analytics documentation, teams that track personalization KPIs consistently are 2–3x more likely to identify underperforming segments before revenue impact compounds. Yet most teams still track these metrics manually in spreadsheets without any standardized MTD/YTD structure, Target vs Actual variance, or year-over-year comparison.
In this article we have created the Personalization Strategy KPI Dashboard in Google Sheets. This is a ready-to-use template in Google Sheets with 6 structured worksheets that track all your personalization KPIs across MTD and YTD time horizons, with conditional formatting arrows indicating whether each metric is trending toward or away from target.
The template is available on NextGenTemplates: Click here to Purchase the Personalization Strategy KPI Dashboard in Google Sheets
Key Features of the Personalization Strategy KPI Dashboard in Google Sheets
Below are the key features of this KPI Dashboard. It is structured around 6 worksheets, each serving a distinct purpose in your personalization performance management workflow.
In This Dashboard, We Have 6 Worksheets
1. Dashboard Sheet Tab
✅ Click here to Purchase the Personalization Strategy KPI Dashboard in Google Sheets
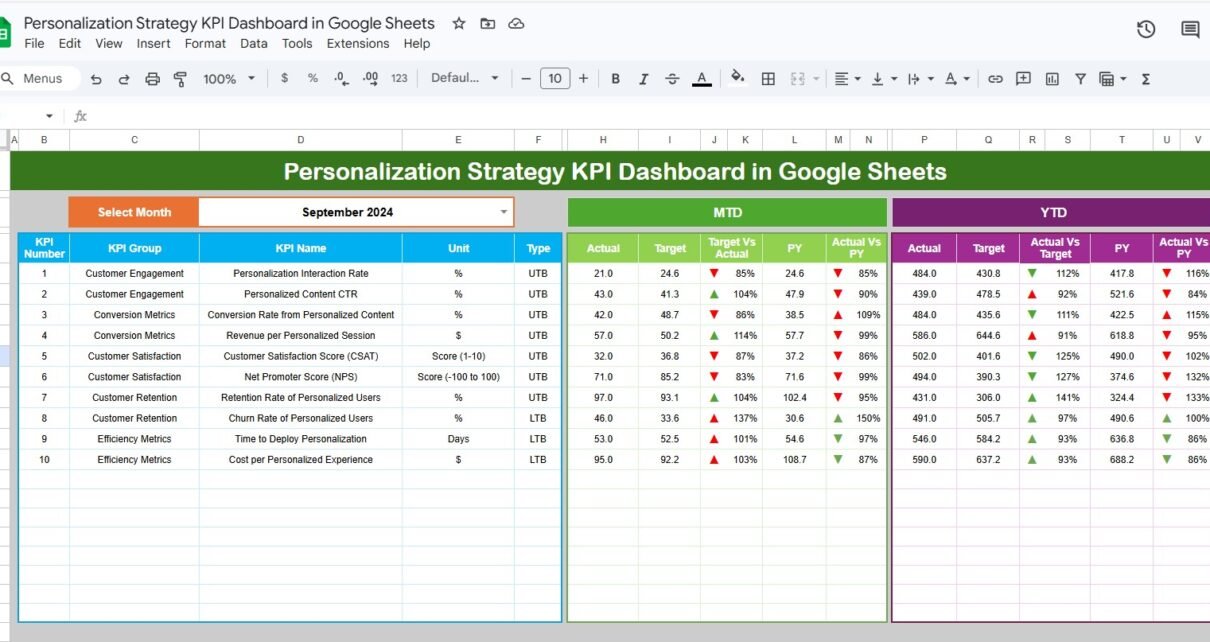
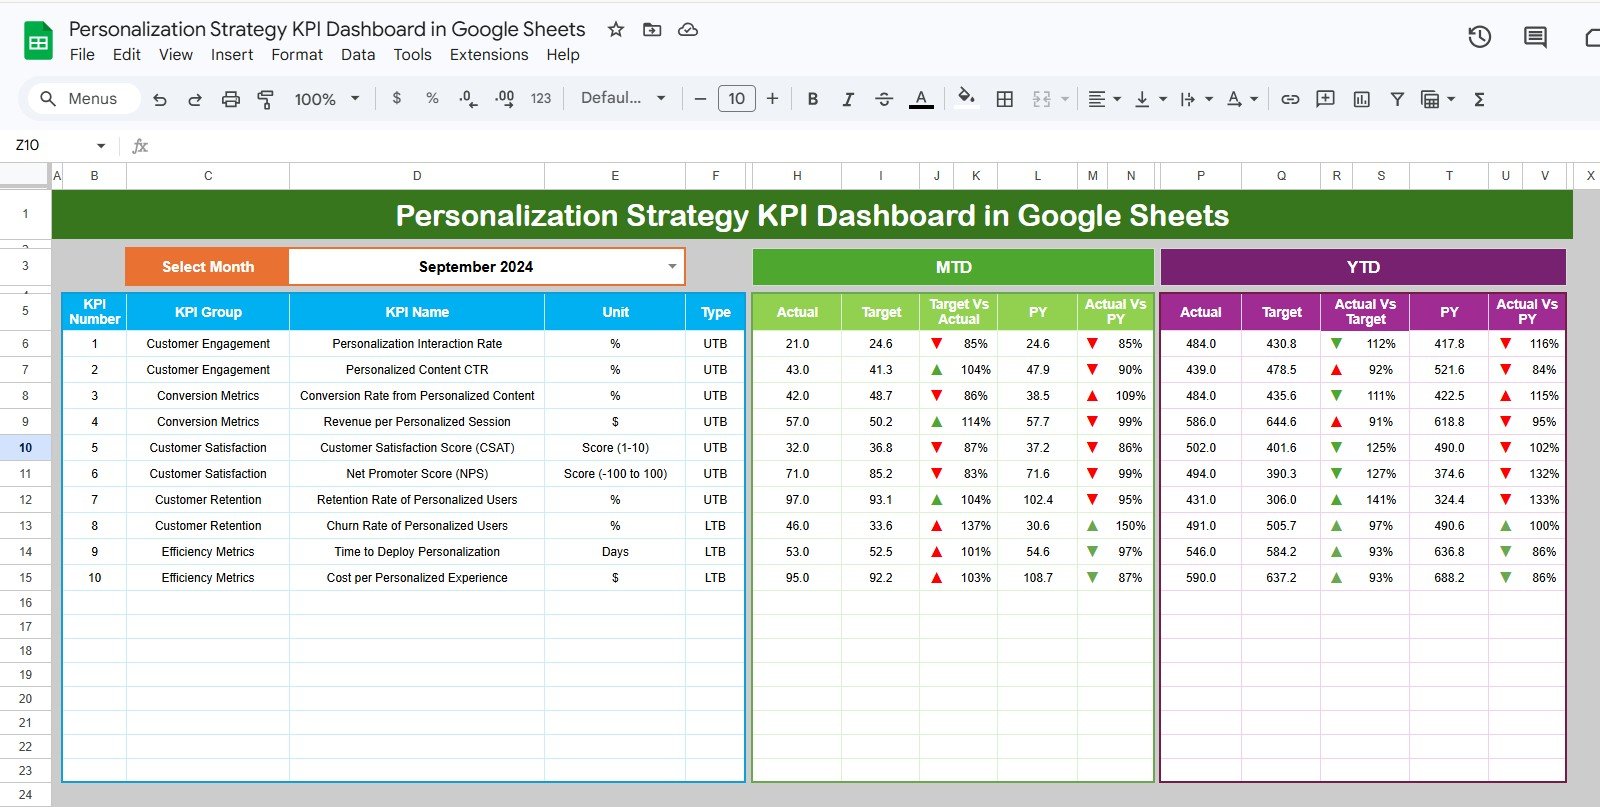
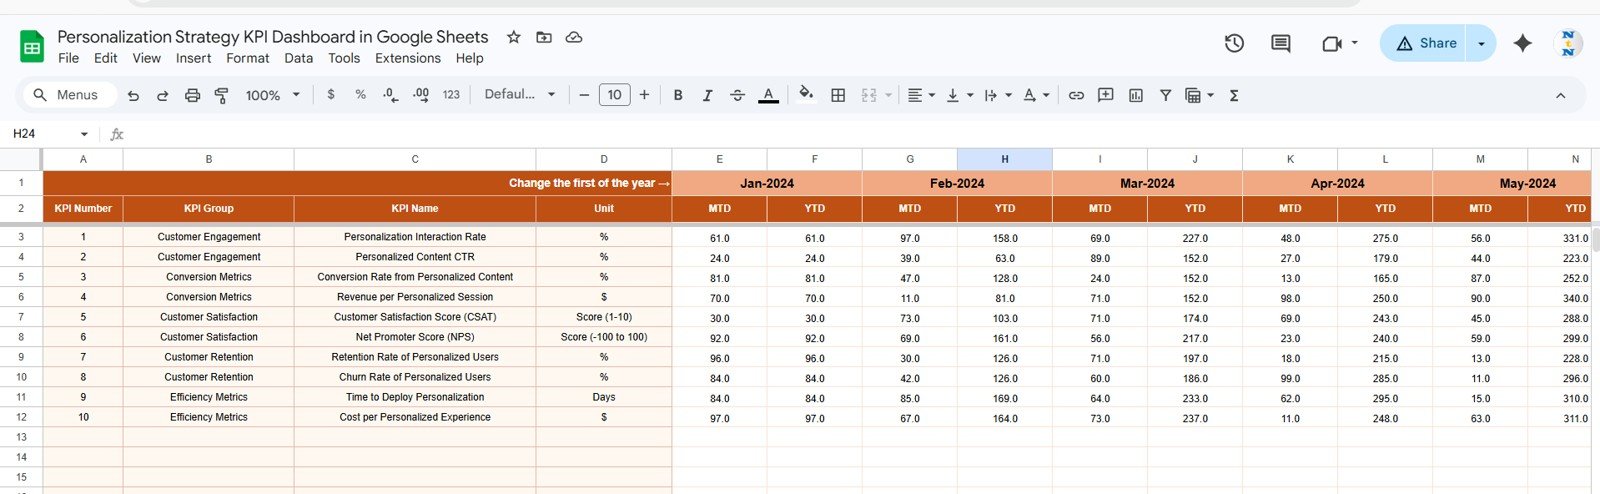
This is the main sheet tab. Here, we are showing all information about all of the KPIs. On range D3, you can select the Month from the drop-down. The entire dashboard updates for that selected month — MTD Actual, Target, and Previous Year data instantly recalculate without touching a formula.Personalization Strategy KPI Dashboard in Google Sheets
Here, we are showing the MTD Actual, Target, Previous Year data along with the Target Vs Actual and PY vs Actual with Conditional formatting up/down arrows. The same structure is repeated for YTD Actual, Target, Previous Year data along with the Target Vs Actual and PY vs Actual with conditional formatting arrows.Personalization Strategy KPI Dashboard in Google Sheets
This dual-layer reporting — both MTD and YTD in the same view — means leadership can assess monthly pacing and cumulative trajectory for every personalization KPI in a single glance. For example, a personalization click-through rate might be on-target for the current month but below YTD targets due to a weak Q1 — the dashboard surfaces that nuance immediately.Personalization Strategy KPI Dashboard in Google Sheets
Personalization Strategy KPI Dashboard in Google Sheets
2. KPI Trend Sheet Tab
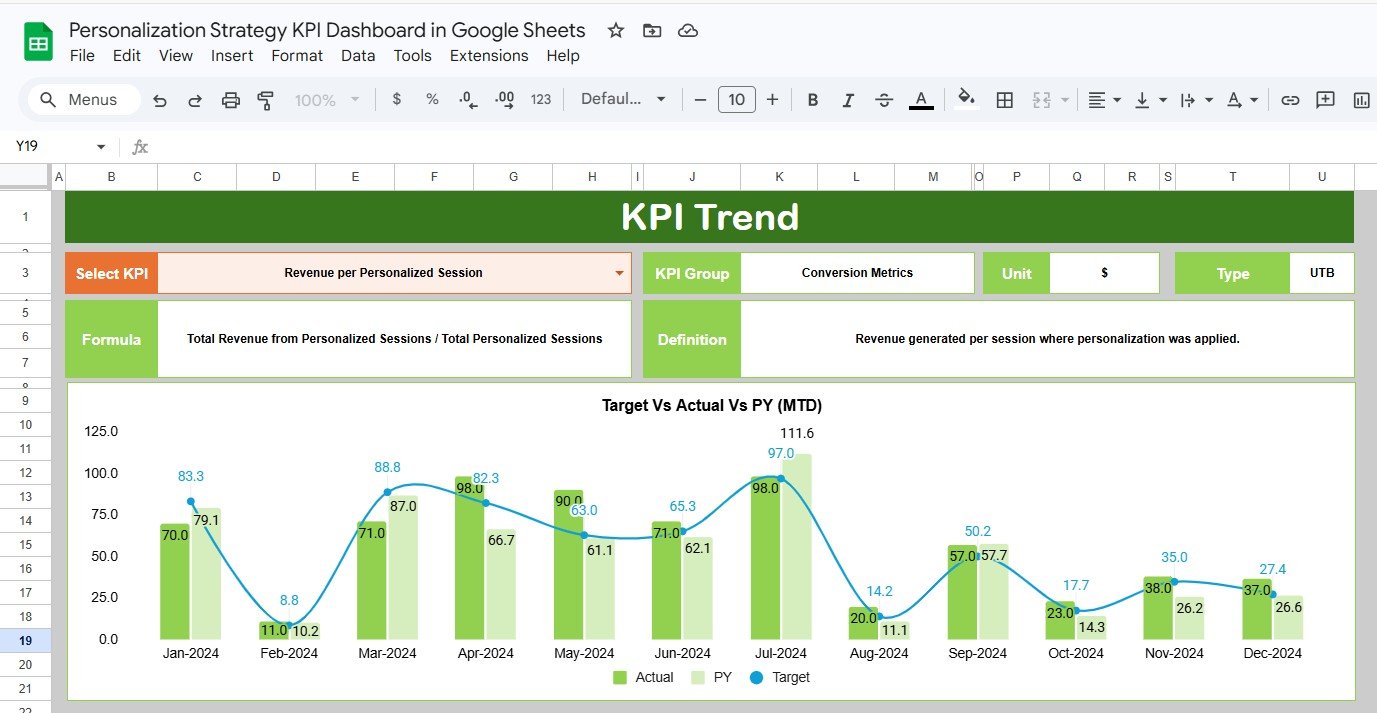
Here you can select the KPI name from the drop-down available on range C3. The dashboard then displays the KPI Group, Unit of KPI, Type of KPI (Lower the Better or Upper the Better), Formula of the KPI, and Definition of the KPI for the selected metric.
We are also showing the MTD and YTD trend chart for Actual, Target, and PY numbers. This dual-chart view makes it easy to spot divergence — for example, when a personalization KPI like email recommendation click rate is consistently tracking below target in MTD but closing the gap YTD, indicating seasonal recovery.
The LTB (Lower the Better) and UTB (Upper the Better) classification is critical here: a KPI like average page load time after personalization rendering is LTB, while a KPI like personalized content engagement rate is UTB. The trend chart and variance arrows respect this classification automatically.
KPI Trend Sheet
3. Actual Numbers Input Sheet
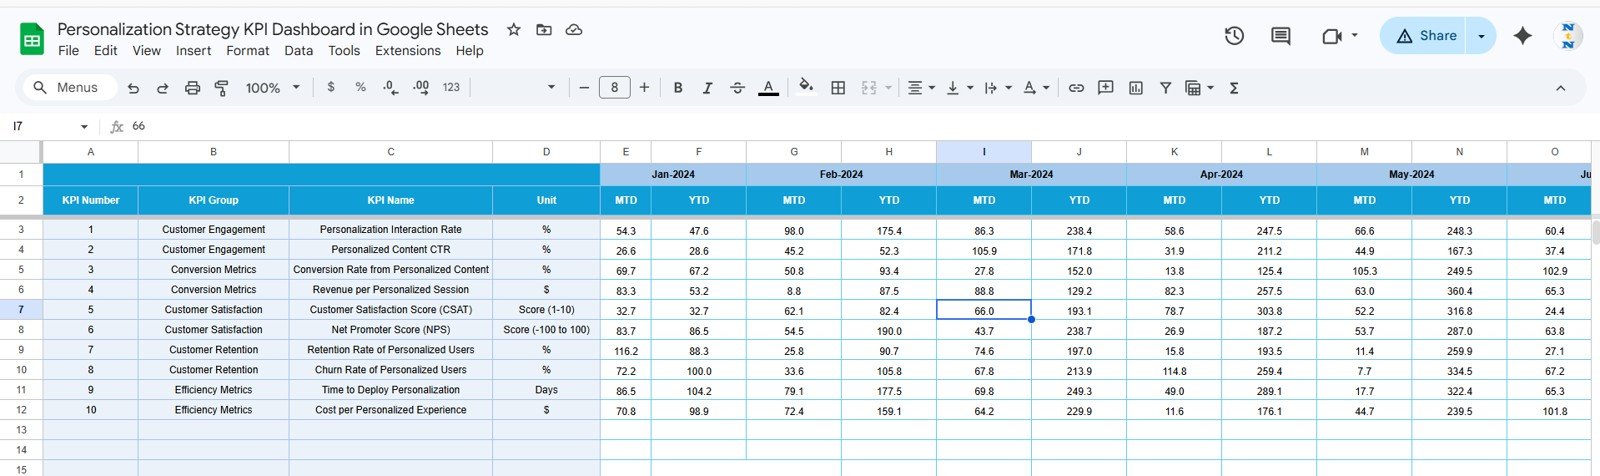
Here you have to enter the actual numbers for YTD and MTD for a particular month. You can change the months from range E1 — just input the first month of the Year on range E1 and the entire input structure adjusts to your fiscal calendar. This makes the template suitable for teams operating on any financial year start date.
Enter your actual personalization KPI data row by row. The data flows automatically to the Dashboard sheet and the KPI Trend charts — no copy-paste or additional formula work required.
Actual Numbers Input Sheet
4. Target Number Input Sheet
In this sheet tab, you have to enter the Target numbers for each KPI for the particular month as MTD as well as YTD. Setting both MTD and YTD targets independently is important for personalization teams because monthly targets often reflect seasonal adjustments (e.g., higher personalization engagement targets during product launch periods) while YTD targets reflect the annual business plan.
Target Number Input Sheet
5. Previous Year Number Sheet Tab
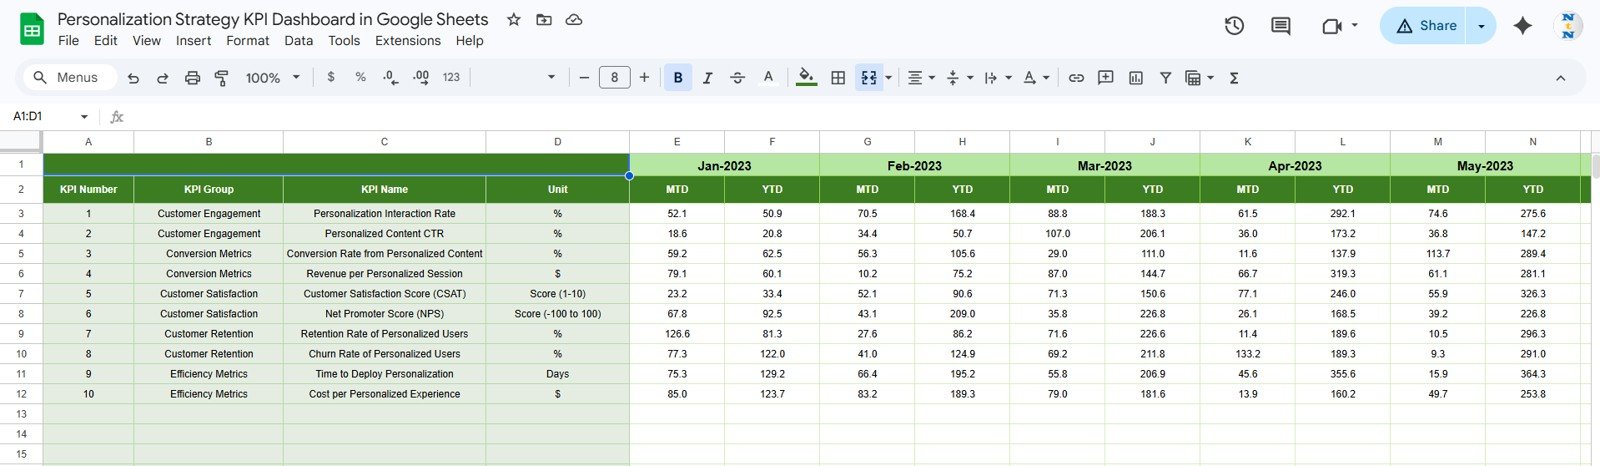
Enter the numbers for the previous year in the same format as you have entered for the current year. The PY vs Actual comparison on the Dashboard tab is powered by this sheet — providing year-over-year context for every KPI that is essential when presenting personalization strategy effectiveness to leadership or board-level stakeholders.Personalization Strategy KPI Dashboard in Google Sheets
Previous Year Number Input Sheet
6. KPI Definition Sheet Tab
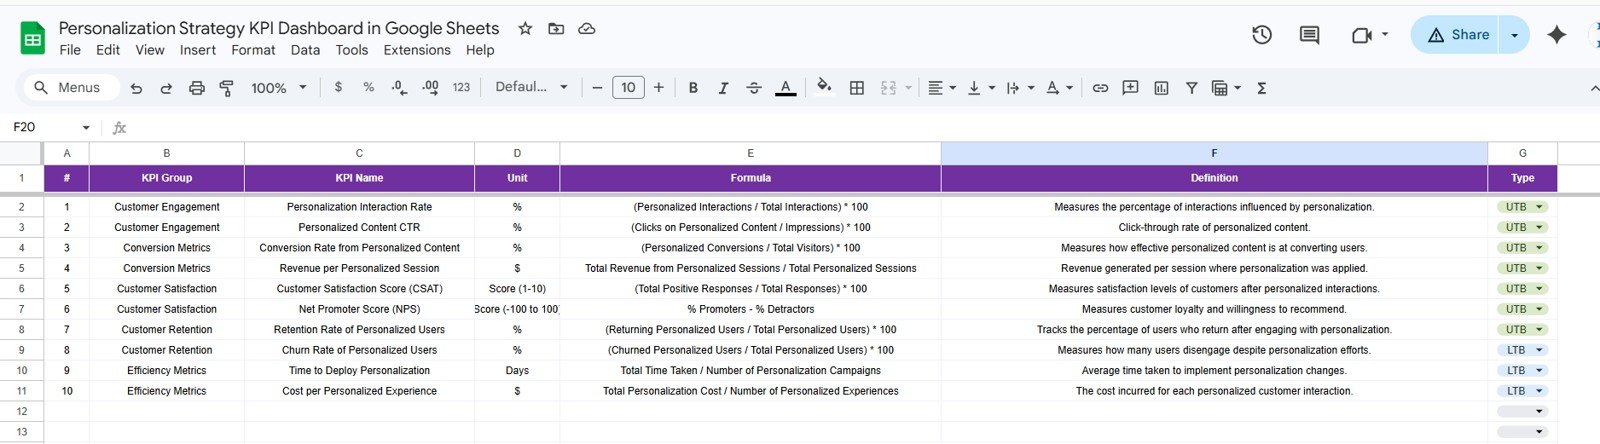
In this sheet tab, you have to enter the KPI Name, KPI Group, Unit, Formula, and KPI definition. In the last column, enter the KPI type as LTB (Lower the Better) or UTB (Upper the Better). This configuration sheet is the engine of the entire dashboard — every KPI displayed on the Dashboard tab and the KPI Trend sheet reads its metadata from here.
For a personalization strategy, typical KPIs you might define here include: Personalized Content Click-Through Rate (UTB), Recommendation Acceptance Rate (UTB), A/B Test Win Rate (UTB), Bounce Rate on Personalized Pages (LTB), Average Session Duration for Personalized Segments (UTB), and Email Personalization Open Rate (UTB).Personalization Strategy KPI Dashboard in Google Sheets
KPI Definition Sheet
Personalization Strategy KPI Dashboard in Google Sheets vs. Microsoft Excel vs. HubSpot Marketing Hub — Feature Comparison
| Feature | Personalization Strategy KPI Dashboard in Google Sheets | Microsoft Excel KPI Dashboard | HubSpot Marketing Hub |
|---|---|---|---|
| Cost | $8.99 one-time | $12–17 one-time | $800–$3,200 / month |
| Platform | Google Sheets (browser, free) | MS Excel (desktop) | Cloud SaaS |
| Setup Time | Under 10 minutes | Under 15 minutes | 2–4 weeks onboarding |
| Real-time team collaboration | ✅ Native — share a link | Requires SharePoint/OneDrive | ✅ Built-in |
| MTD + YTD dual tracking | ✅ Pre-built | ✅ Manual build | ⚠️ Custom reports only |
| LTB / UTB KPI logic | ✅ Built-in | Manual setup | ❌ Not available |
| Customizable KPI definitions | ✅ Full control | ✅ Full control | ❌ Vendor-locked |
| Mobile access | ✅ Google Sheets app | Limited mobile editing | ✅ Dedicated app |
| Year-1 cost at 5 users | $8.99 total | $12–17 total | $9,600–$38,400 |
For marketing and personalization teams that want structured MTD/YTD KPI tracking without enterprise SaaS pricing, the Personalization Strategy KPI Dashboard in Google Sheets sits in the sweet spot.
Who Should Use This Template
Perfect for:
- Marketing analysts and personalization managers tracking monthly and annual KPI performance across recommendation engines, dynamic content, and behavioral targeting
- E-commerce teams measuring the effectiveness of product recommendation, cart personalization, and browse abandonment campaigns
- Growth and CRM teams that need structured Actual vs Target vs Prior Year comparisons without building custom dashboards from scratch
- Marketing agencies managing personalization KPI reporting for multiple clients from a single, configurable Google Sheets template
- Teams on limited budgets that need professional-grade KPI monitoring without monthly SaaS subscriptionsPersonalization Strategy KPI Dashboard in Google Sheets
Not a fit if:
- Your team needs live API integrations pulling data automatically from ad platforms, CDPs, or CRMs (consider HubSpot or Segment)
- Your organization requires SOC 2 compliance, SSO, or enterprise audit logging built into the analytics layerPersonalization Strategy KPI Dashboard in Google Sheets
- You need automated anomaly detection or AI-generated KPI recommendations (use a dedicated BI platform)Personalization Strategy KPI Dashboard in Google Sheets
Real-World Use Cases
✅ Click here to Purchase the Personalization Strategy KPI Dashboard in Google Sheets
Priya is a personalization analyst at a 50-person e-commerce brand. She tracks 12 KPIs spanning product recommendation click rates, email personalization opens, and dynamic homepage engagement. Every month she fills in the Actual Numbers Input sheet and selects the current month from the D3 drop-down on the Dashboard tab. Her VP of Marketing reviews the conditional formatting arrows in real time during the monthly business review — no manual PowerPoint preparation needed.
Marco leads growth at a SaaS startup running A/B personalization experiments. He uses the KPI Trend sheet to drill into individual KPIs and identify the months where actual performance diverged most sharply from targets — the MTD/YTD dual chart makes it easy to distinguish seasonal dips from structural performance gaps. This helps him reallocate experiment budget to the personalization surfaces with the largest variance opportunity.
A boutique digital marketing agency manages personalization KPI reporting for five B2C clients simultaneously. Each client gets a dedicated copy of the dashboard in Google Drive. The KPI Definition sheet allows completely different KPI configurations per client without rebuilding the dashboard structure — one client tracks email personalization, another tracks on-site product recommendations, and a third tracks push notification personalization. Monthly reporting time dropped by 60% after adopting this template.
Advantages of the Personalization Strategy KPI Dashboard in Google Sheets
- ✅ Single source of truth — all personalization KPIs consolidated in one place, accessible by any team member with the shared Google Sheets link
- 📊 MTD and YTD in one view — eliminates the need to maintain separate monthly and annual tracking spreadsheets
- 🔄 Instant updates — change the month on D3 and the entire dashboard recalculates in seconds
- 📚 Flexible KPI configuration — define any KPI with LTB/UTB classification and the logic propagates automatically
- 📈 Trend visibility — the KPI Trend sheet gives single-KPI drill-down with MTD and YTD line charts for deeper analysis
- 👥 No per-user cost — share with the entire team via Google Drive link at zero additional cost
Opportunities for Improvement
✅ Click here to Purchase the Personalization Strategy KPI Dashboard in Google Sheets
- 🔔 Adding automated data pull from Google Analytics or CRM platforms via Google Sheets API connectors or Zapier would eliminate manual data entry
- 📱 Building a mobile-optimized view of the dashboard tab for quick executive review on smartphones
- 🧠 Integrating simple threshold-based alerting (e.g., flag cells in red if Actual falls more than 10% below Target) would provide proactive signals without requiring daily dashboard review
- 🌎 Adding a multi-segment view to compare personalization KPIs across customer segments, product categories, or channels side by side would strengthen strategic decision-making
Best Practices
- Define all KPIs in the KPI Definition sheet before entering any Actual, Target, or Previous Year data — this ensures consistent naming and grouping throughout the dashboard
- Use meaningful KPI Group names (e.g., “Recommendation Engine”, “Email Personalization”, “On-Site Dynamic Content”) to make the dashboard easier to navigate as the KPI count grows
- Review the KPI Trend sheet weekly to catch divergence early, not just at month-end
- Archive copies of the dashboard at each quarter-end to track strategic evolution of your personalization KPI framework over time
- Align KPI targets with your personalization platform’s benchmark data — if your recommendation engine vendor publishes industry average click rates, use those as initial targets
Explore Relevant Templates
- Call Abandonment Rate KPI Dashboard in Google Sheets — Same 6-worksheet MTD/YTD KPI structure applied to call center performance metrics.
- HVAC Service Dashboard in Google Sheets — Operational Google Sheets dashboard for field service analytics across revenue, service type, and equipment performance.
- Browse all Google Sheets KPI Dashboard Templates — 100+ KPI dashboards covering marketing, sales, HR, operations, healthcare, and more.
Frequently Asked Questions
✅ Click here to Purchase the Personalization Strategy KPI Dashboard in Google Sheets
What KPIs does the Personalization Strategy KPI Dashboard in Google Sheets track?
The Personalization Strategy KPI Dashboard in Google Sheets tracks any KPI you define in the KPI Definition sheet. Typical personalization KPIs include recommendation click-through rate, personalized content engagement rate, email personalization open rate, A/B test win rate, and bounce rate on personalized pages. The dashboard tracks all defined KPIs with MTD and YTD Actual, Target, and Previous Year data plus conditional formatting variance arrows.Personalization Strategy KPI Dashboard in Google Sheets
How does this compare to HubSpot Marketing Hub for KPI tracking?
HubSpot Marketing Hub starts at $800/month and requires weeks of onboarding and CRM data integration. The Personalization Strategy KPI Dashboard in Google Sheets costs $8.99 once and delivers structured MTD/YTD KPI tracking with LTB/UTB variance logic in under 10 minutes. It does not offer live API data pulls, but eliminates subscription costs entirely for teams that can maintain data manually.Personalization Strategy KPI Dashboard in Google Sheets
Can I customize the KPIs in this dashboard?
Yes. The KPI Definition sheet is fully configurable. Add any number of KPIs with their Name, Group, Unit, Formula, Definition, and LTB/UTB classification. The Dashboard tab and KPI Trend sheet read from this configuration automatically — no formula editing required to add or change KPIs.
How long does it take to set up?
Setup takes under 10 minutes. Make a copy in Google Drive, fill in the KPI Definition sheet, enter your Target and Previous Year data in their respective input sheets, add the first month of Actual data, and select your reporting month from the D3 drop-down. The dashboard is ready for your first monthly review immediately.
Does this dashboard support non-January fiscal year starts?
Yes. Set the first month of your fiscal year on cell E1 of the Actual Numbers Input sheet. The YTD calculations and period labelling across all sheets adjust automatically to match your financial calendar.
Is there a Google Sheets version vs an Excel version?
This template is built natively in Google Sheets for browser-based access and easy team sharing. For teams that prefer Microsoft Excel, browse the KPI dashboard collection on NextGenTemplates.com for equivalent Excel versions across dozens of business domains.
Can multiple team members use this dashboard simultaneously?
Yes. Because this is a Google Sheets template, multiple users can access and edit the same file simultaneously via a shared Drive link. There are no per-user fees from NextGenTemplates — your $8.99 purchase covers unlimited internal users.
About the Author
Built by PK — Microsoft Certified Professional with 15+ years of Excel, Google Sheets, and Power BI experience. Founder of NextGenTemplates, reaching 300K+ subscribers across YouTube channels. Every template is hand-built and tested before release.
Conclusion
The Personalization Strategy KPI Dashboard in Google Sheets gives marketing and personalization teams a structured, flexible way to track their most important metrics across MTD and YTD horizons, compare against targets and prior year, and drill into individual KPI trends — all from a single Google Sheets file that costs less than a single SaaS monthly seat.
✅ Click here to Purchase the Personalization Strategy KPI Dashboard in Google Sheets
Instant download · One-time payment · No subscription
📅 Last updated: May 2026
📺 For step-by-step tutorials, visit our YouTube channel: Youtube.com/@NeoTechNavigators