The Sports Team Performance Dashboard in Google Sheets turns a single match log into a complete season report — tracking 4 headline KPIs (Matches Played, Wins, Goals For, Total Points) across 6 connected sheets, with 16 pre-built charts and one-click slicer filtering. Built entirely on native Google Sheets, it needs no add-ons, runs free in any browser, and sets up in under 10 minutes.
If you’ve been juggling match results in scattered notes or paying for a scouting platform you barely use, this Google Sheets sports analytics dashboard gives coaches, analysts, and team secretaries a single shareable place to see how the season is really going. Replace the sample data once, and every card, chart, slicer, and match-lookup updates automatically.
Key Features of the Sports Team Performance Dashboard
- 4 live KPI cards — Matches Played, Wins, Goals For, and Total Points sit at the top of the Overview and recalculate automatically from your data.
- 16 charts across 4 analysis pages — Results, Goals, and Competitions each carry four dedicated charts, all built with native Google Sheets visualisations.
- Native slicer filtering — Filter the entire dashboard by competition, venue, or month in a single click.
- Match-level Search sheet — Choose any Match ID and instantly see that fixture’s full record.
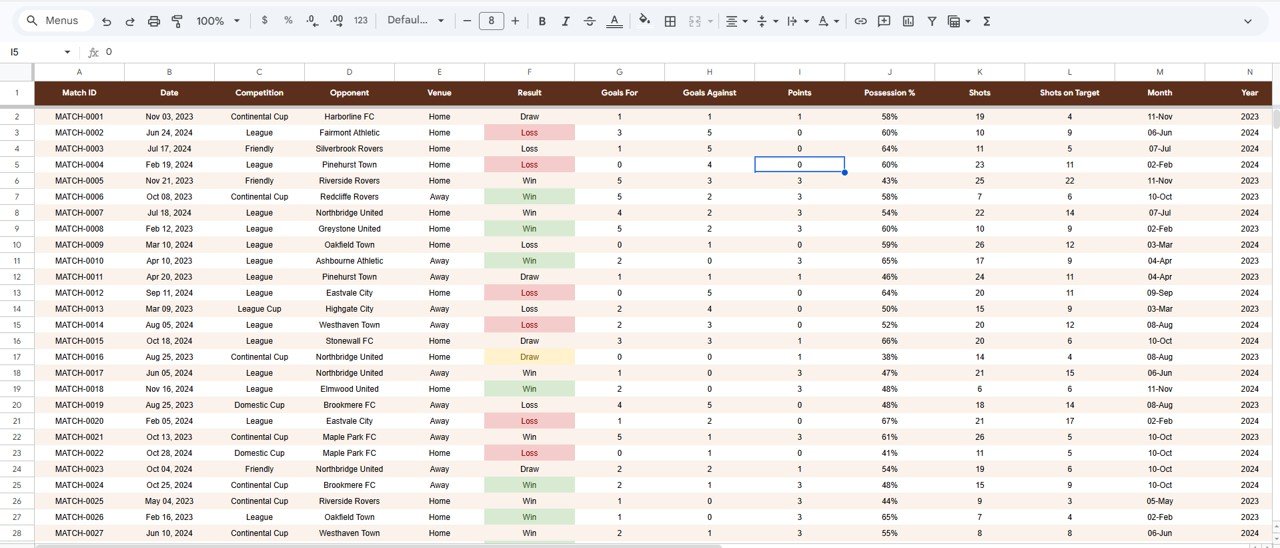
- One clean Data sheet — Add matches in the same row format and the workbook extends itself with zero formula editing.
The dashboard tracks more than the four headline numbers: behind the scenes it also captures possession %, shots, shots on target, opponent, venue, and competition for every match — so the analysis pages can slice performance by almost any angle a coach cares about.
Dashboard Pages Explanation
👉 Click here to Purchase the Sports Team Performance Dashboard in Google Sheets
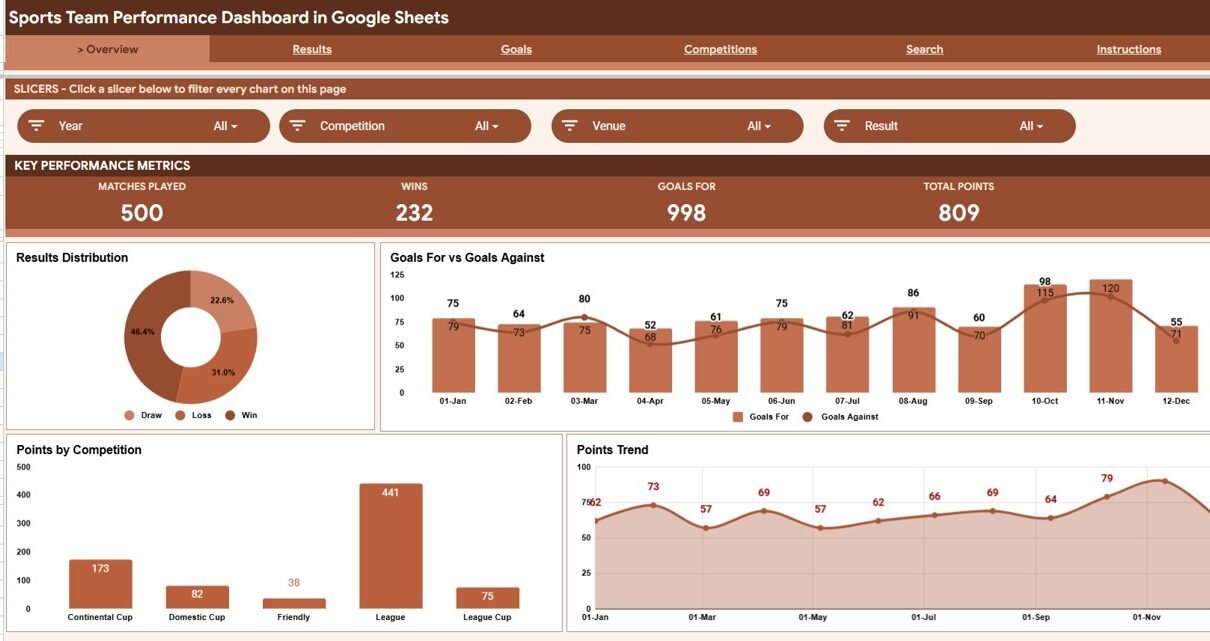
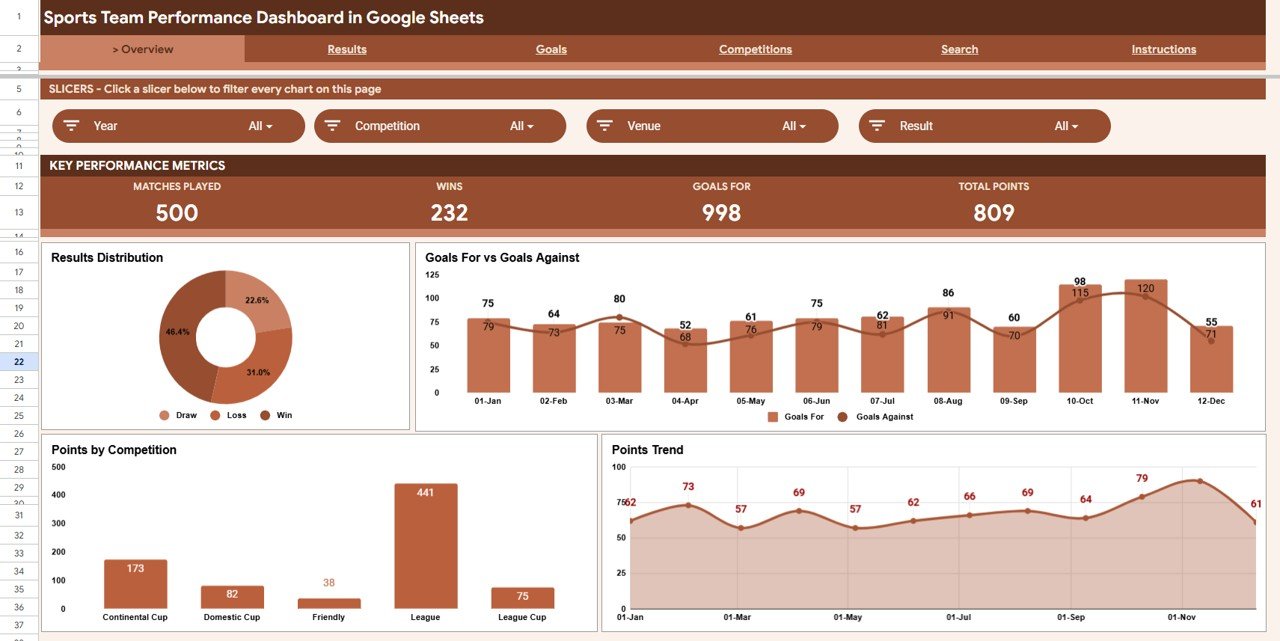
Overview
The Overview sheet is the season at a glance: four KPI cards on top, a row of slicers, and four charts — Matches by Result, Goals For and Goals Against by Month, Points by Competition, and Points by Month. It’s the page you’ll open first before every team meeting.
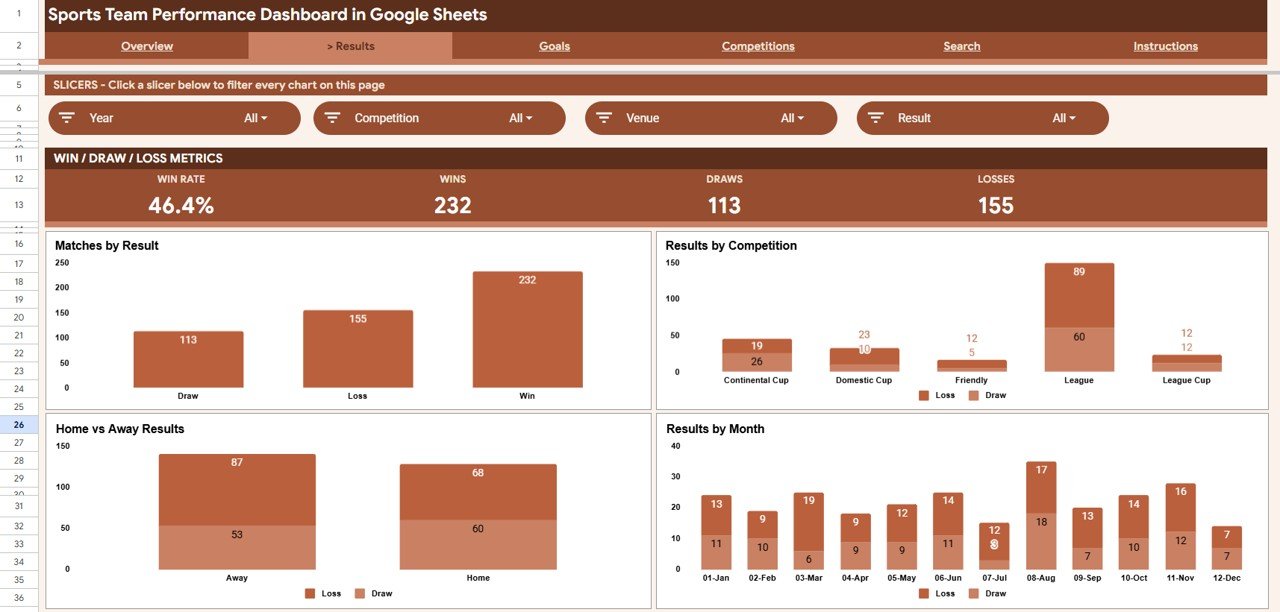
Results
The Results sheet answers “where are our wins coming from?” with Matches by Result, Results by Competition, Results by Venue, and Results by Month. It’s ideal for spotting home/away patterns or a strong run in one competition.
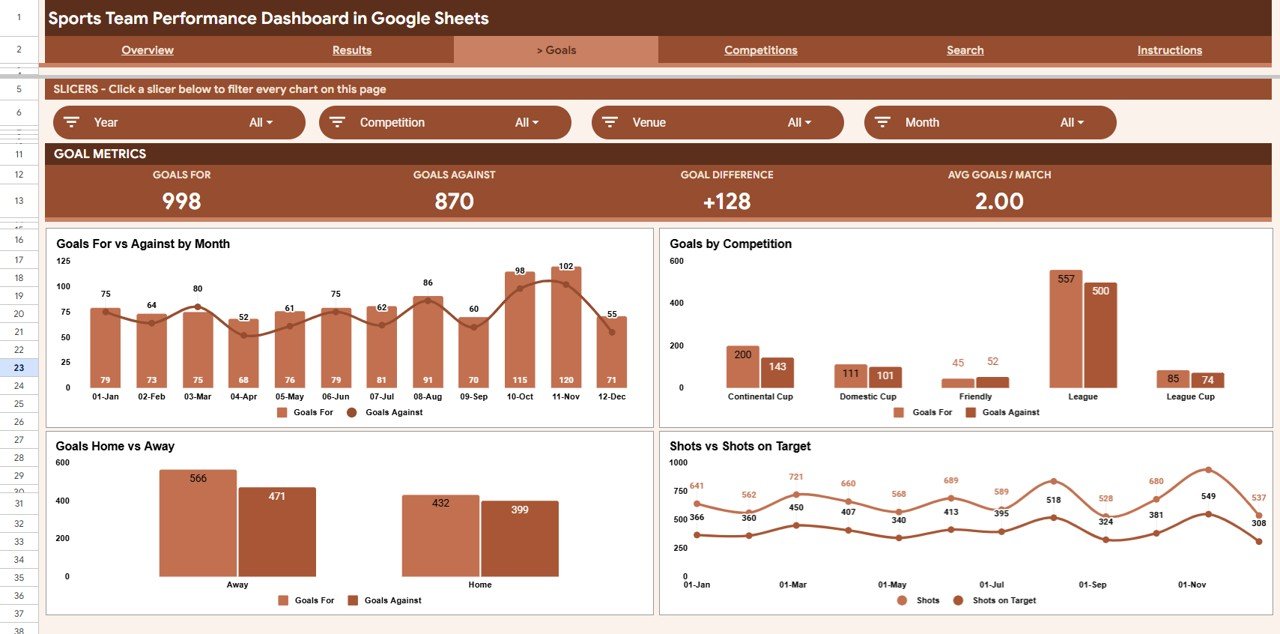
Goals
The Goals sheet focuses on attack and defence: Goals For and Goals Against by Month, Goals by Competition, Goals by Venue, and Shots and Shots on Target by Month. Linking goals back to shot volume helps you see whether results come from finishing or from sheer chance creation.
Competitions
👉 Click here to Purchase the Sports Team Performance Dashboard in Google Sheets
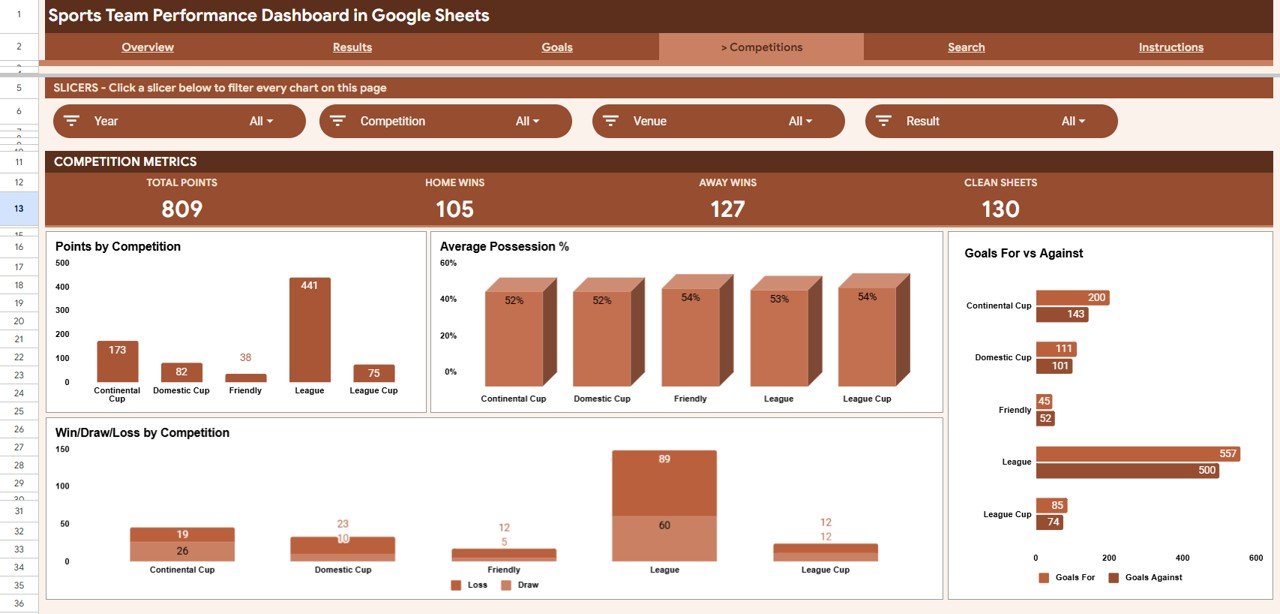
The Competitions sheet compares leagues and cups side by side: Points by Competition, Average Possession % by Competition, Goals For and Goals Against by Competition, and Win Draw Loss by Competition. It quickly reveals which competition your team performs best in.
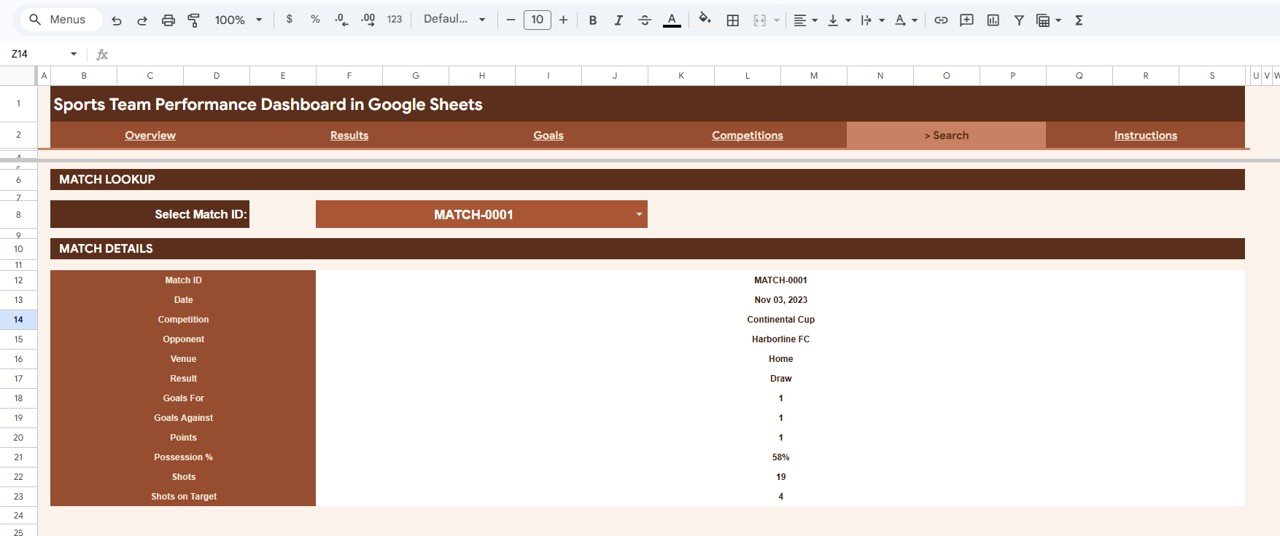
Search
The Search sheet is a single-match lookup. Pick a Match ID from the dropdown and the page shows date, competition, opponent, venue, result, goals for, goals against, points, possession, shots, and shots on target — perfect for pulling one fixture’s detail on demand.
Data Sheet
👉 Click here to Purchase the Sports Team Performance Dashboard in Google Sheets
The Data sheet is the engine room. Enter each match in the same column format and every KPI, chart, slicer, and the Search sheet update automatically across the workbook. This is the only sheet you ever need to type into.
Sports Team Performance Dashboard vs. Excel vs. Paid Sports Analytics SaaS — Feature Comparison
| Feature | Sports Team Performance Dashboard (Google Sheets) | Microsoft Excel Dashboard | Paid Sports Analytics SaaS (Hudl / Wyscout) |
|---|---|---|---|
| Cost | $9.99 one-time | $15-30 one-time | $100-1,000+ / year |
| Platform | Google Sheets (browser, free) | Excel desktop licence | Web app / login required |
| Setup time | Under 10 minutes ✅ | Under 10 minutes ✅ | Onboarding + import setup |
| Real-time team collaboration | Yes — share like any Sheet ✅ | Limited (file sharing) | Yes ✅ |
| Mobile access | Yes — Sheets app ✅ | Excel mobile | Yes ✅ |
| Customizable fields | Fully open — edit any cell ✅ | Fully open ✅ | Restricted to vendor schema |
| Share with a link | Yes ✅ | Manual | Yes (seat-based) |
| Year-1 cost at 5 users | $9.99 total ✅ | ~$20 + licences | $500-5,000+ |
For coaches and analysts who want shareable, fully editable match analytics without paying per-seat SaaS fees, the Sports Team Performance Dashboard in Google Sheets sits in the sweet spot.
Who Should Use This Template
Perfect for:
- Coaches and managers tracking one team’s season across league and cup competitions
- Amateur, semi-pro, and youth-academy football, hockey, or futsal teams logging goals, results, and shots
- Team analysts and secretaries who want a shareable Google Sheets report instead of a paid scouting platform
Not a fit if:
- You’re a pro club needing player tracking, video tagging, or GPS/wearable integration
- You run a multi-team league needing a central standings engine across many clubs
- You need automatic live-score feeds — this dashboard runs on your own manual match log
Real-World Use Cases
Daniel, semi-pro soccer coach. Daniel logs every league and cup match in the Data sheet. Using the Competitions page, he shows his committee the team earns more points per game in cup fixtures than league matches — a clear, data-backed case for a different rotation policy, made without paying for a scouting subscription.
Priya, youth academy analyst. Priya filters the Overview with slicers to compare home and away results month by month, then shares the live Google Sheet link with coaches and parents so everyone reads the same numbers on their phones during fixtures.
Marcus, team secretary. Before each board meeting, Marcus opens the Search sheet, pulls specific fixtures by Match ID, and reports goals for, goals against, possession, and shots on target straight from one tidy lookup — no scrolling through a giant spreadsheet.
Advantages of the Sports Team Performance Dashboard
- Zero subscription cost — a one-time $9.99 purchase replaces recurring SaaS fees that can run into hundreds per year.
- Genuinely shareable — because it’s a Google Sheet, staff and parents open it on any device with a link, no software install.
- Fast to maintain — one Data sheet drives everything, so weekly updates take minutes.
- Fully yours to edit — add competitions, rename columns, or extend charts without vendor restrictions.
Opportunities for Improvement
Being honest about the limits helps you decide if it fits. The dashboard is built around team-level match data, so it doesn’t track individual player minutes, heat maps, or video clips. It also relies on manual data entry rather than live API feeds, which keeps it simple but means you update results yourself. Teams wanting deeper player analytics may eventually pair it with a dedicated tracking tool — but for season-level reporting, this template covers the essentials cleanly.
Best Practices
- Keep the Data sheet column order intact — it’s what powers every chart and the Search lookup.
- Enter each match consistently (same competition and venue names) so slicers group cleanly.
- Update results weekly so the by-month charts stay accurate.
- Duplicate the file each season to keep a clean historical archive.
- For deeper formatting tips, see the official Google Sheets slicers guide.
Explore Relevant Templates
Prefer a different tool? The same dashboard is available as a Sports Team Dashboard in Excel and a Sports Team Dashboard in Power BI. For more Google Sheets dashboards, try the Political Campaign Dashboard in Google Sheets and the SaaS Onboarding Dashboard in Google Sheets, or browse the full Google Sheets Dashboards collection.
Frequently Asked Questions
👉 Click here to Purchase the Sports Team Performance Dashboard in Google Sheets
What KPIs does the Sports Team Performance Dashboard track?
The Sports Team Performance Dashboard tracks 4 headline KPIs — Matches Played, Wins, Goals For, and Total Points — plus possession %, shots, shots on target, and results split by competition, venue, and month across its analysis pages.
Do I need Excel or any add-ons to use this dashboard?
No. The Sports Team Performance Dashboard runs entirely in Google Sheets in your browser, free of charge. There are no add-ons, scripts, or paid extensions — the charts and slicers are all native Google Sheets features.
How long does setup take?
Setup takes under 10 minutes. Make your own copy from the included link, paste your match log into the Data sheet using the same column format, and every KPI card, chart, and slicer updates automatically.
Can I share the dashboard with my coaching staff?
Yes. Because the Sports Team Performance Dashboard is a Google Sheet, you can share it with a link, control view and edit access, and let staff open it on desktop or the Sheets mobile app with no per-user fees.
How does this compare to paid sports analytics SaaS?
Paid platforms like Hudl or Wyscout can cost hundreds to thousands per year. The Sports Team Performance Dashboard is a one-time $9.99 purchase you fully own and edit — ideal for amateur and semi-pro teams that don’t need video or tracking-data feeds.
Is the template available for other platforms?
Yes. The same dashboard is available as a Sports Team Dashboard in Excel and a Sports Team Dashboard in Power BI, so you can use whichever tool your team already works in.
About the Author
Built by PK — Microsoft Certified Professional with 15+ years of Excel, Google Sheets, and Power BI experience. Founder of NextGenTemplates, reaching 300K+ subscribers across YouTube channels. Every template is hand-built and tested before release.
Conclusion
The Sports Team Performance Dashboard in Google Sheets gives any team a clean, shareable, season-long view of results, goals, and competition performance — without subscriptions or software installs. Paste your data once and the whole report comes to life.
👉 Click here to Purchase the Sports Team Performance Dashboard in Google Sheets
Instant download · One-time payment · No subscription
🎥 For step-by-step video tutorials, visit YouTube.com/@NeoTechNavigators.
📅 Last updated: June 2026