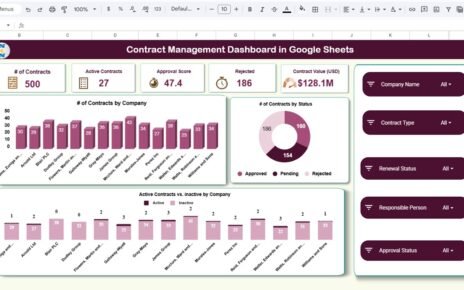
The HR Review Analytics Dashboard in Google Sheets converts raw appraisal data into 19 interactive charts spread across 7 tabs, scoring every employee on 6 review dimensions: communication, problem solving, teamwork, technical skill, punctuality, and an overall average. Five KPI cards sit at the top of the Overview tab, and slicers let you re-cut the entire dashboard in a single click. Setup takes under 10 minutes — paste your review records into the Data tab and every chart recalculates automatically.
Most teams still run performance reviews inside disconnected spreadsheets or pay $7–11 per employee per month for a SaaS review platform. This template gives you the analytics layer of those tools — reviewer comparisons, department breakdowns, and monthly trend lines — in a Google Sheet you own outright, with real-time collaboration and zero per-seat fees. If you have been searching for how to track employee performance reviews in Google Sheets without another subscription, this dashboard is built for exactly that.
Key Features of the HR Review Analytics Dashboard in Google Sheets
Click here to purchase the HR Review Analytics Dashboard in Google Sheets.
📊 Six review dimensions in one model — The dashboard scores communication, problem solving, teamwork, technical skill, and punctuality, then rolls them into an overall average score so a reviewer can read a full picture from a single row.
🎛️ Slicer-driven filtering — Native Google Sheets slicers on the Overview tab let you filter every KPI card and chart by department, position, reviewer, or month without touching a formula.
📈 19 pre-built charts across 5 analysis tabs — Reviewer, position, department, and month each get a dedicated view, so you can move from a company-wide number down to one team in seconds.
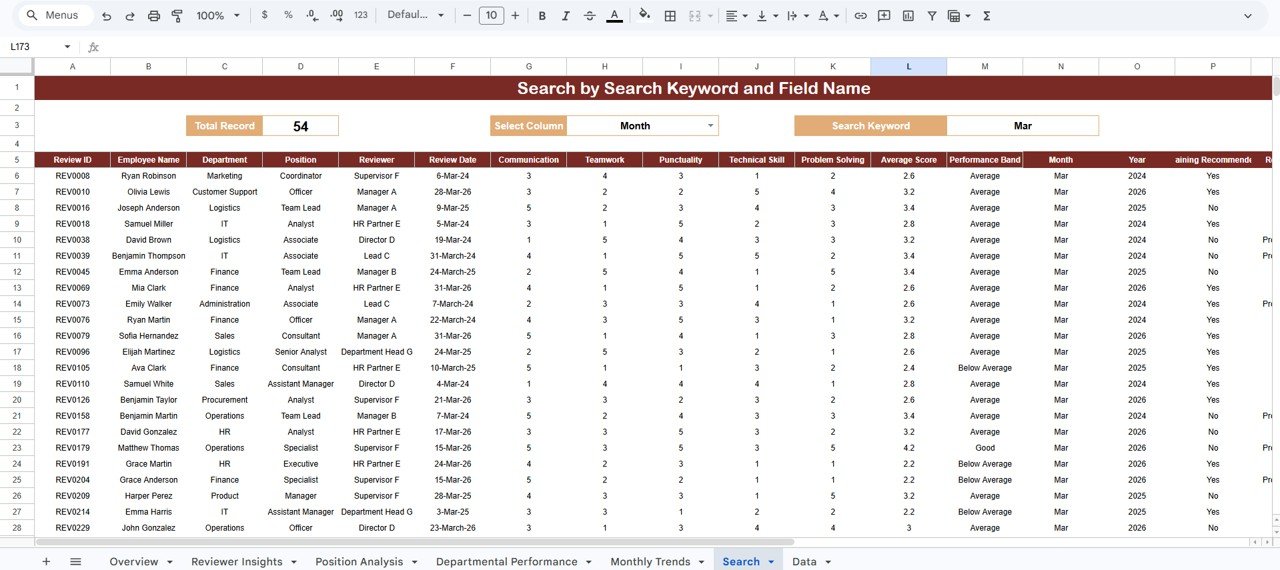
🔍 Built-in Search tab — Pick a column, type a keyword, and the sheet returns every matching review plus a live record count — no filters to reset afterward.
☁️ Cloud-native and shareable — Because it runs in Google Sheets, the whole HR team can open the same review dashboard on any device and edit together in real time.
Dashboard Pages Explanation
Overview Page
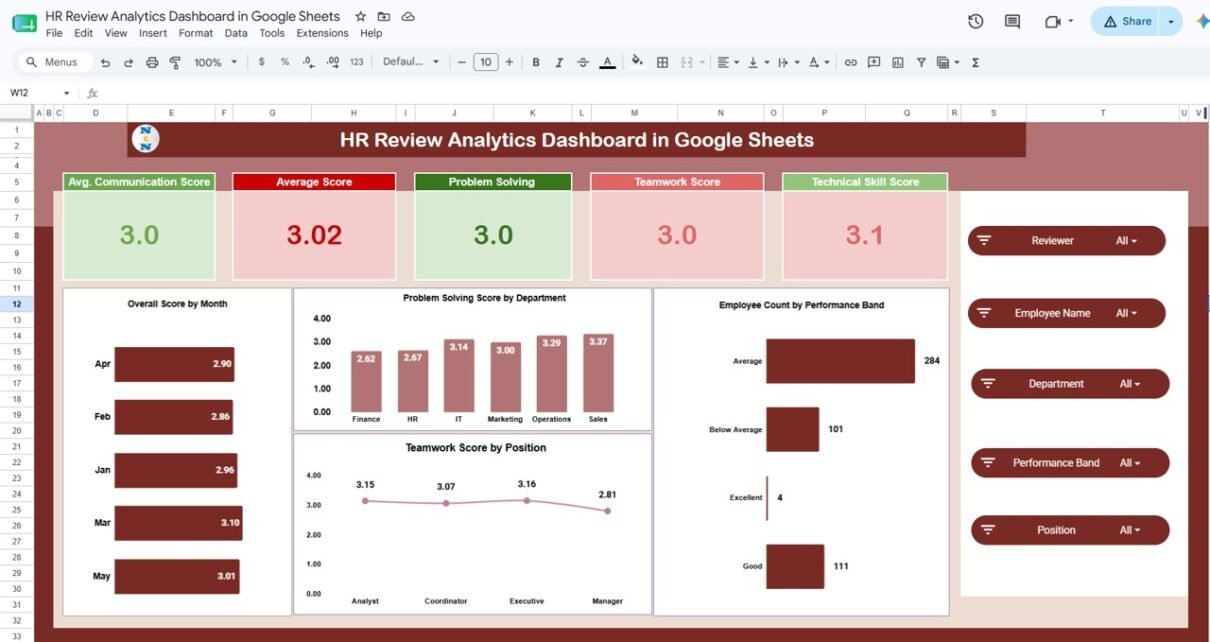
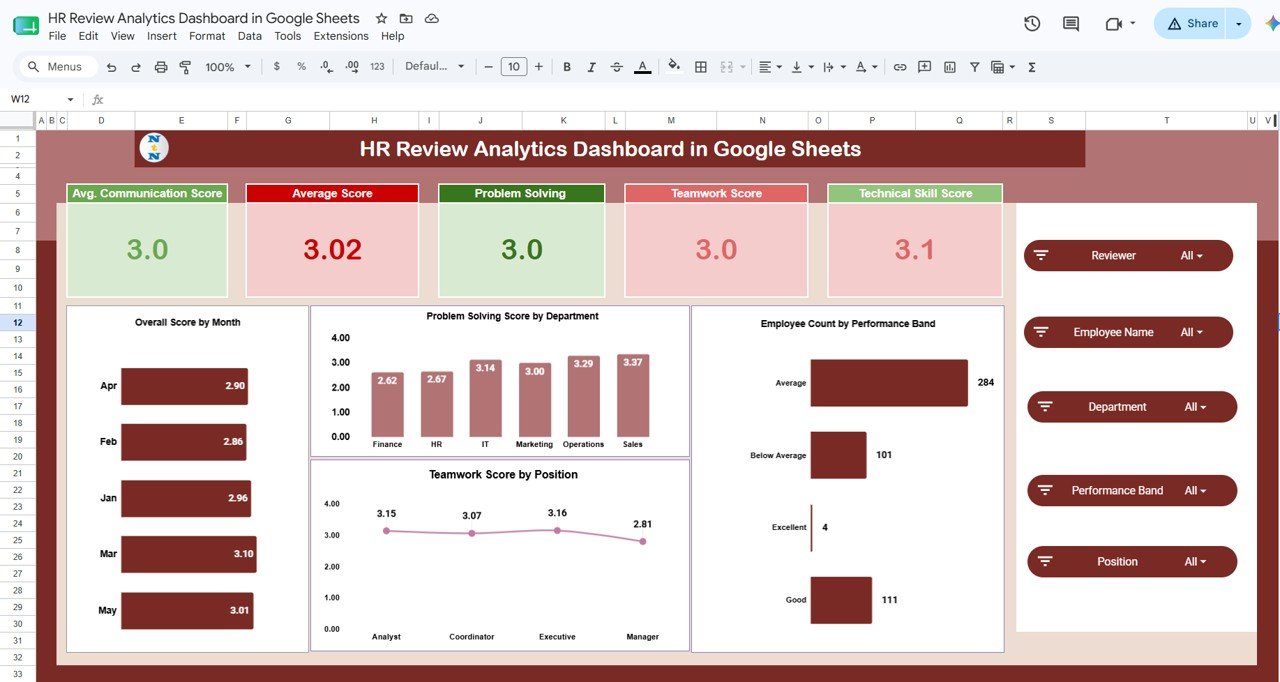
The landing tab opens with five KPI cards — Average Communication Score, Average Score, Problem Solving, Teamwork Score, and Technical Skill Score — above charts for Overall Score by Month, Problem Solving Score by Department, Teamwork Score by Position, and Employee Count by Performance Band. Slicers across the top filter the entire page at once.
Reviewer Insights
Click here to purchase the HR Review Analytics Dashboard in Google Sheets.
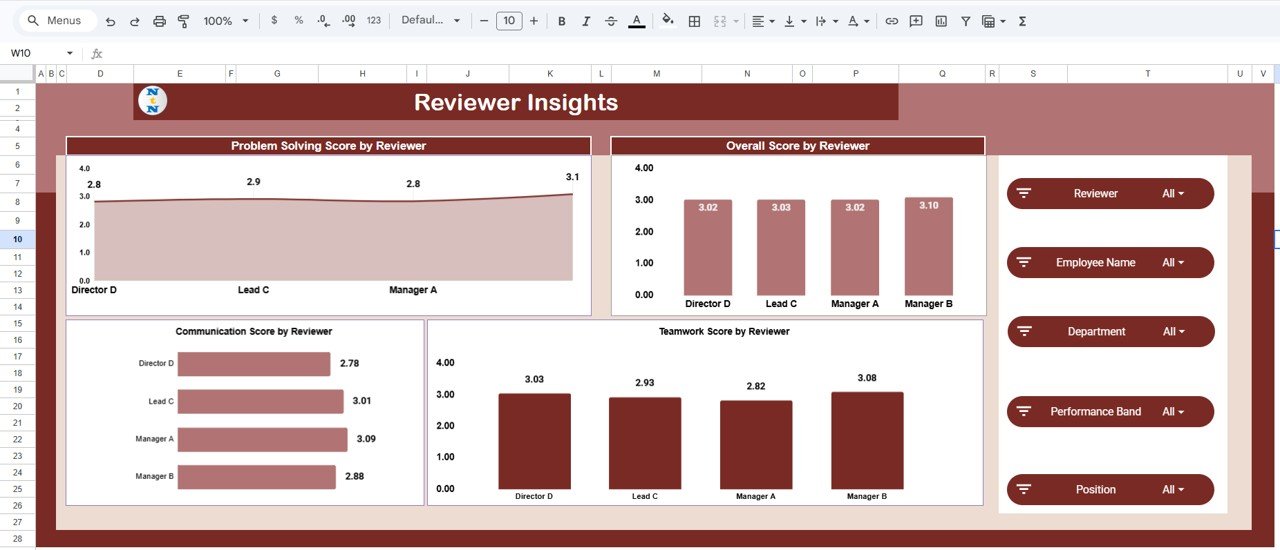
This tab compares how different reviewers score employees, with Problem Solving Score by Reviewer, Overall Score by Reviewer, Communication Score by Reviewer, and Teamwork Score by Reviewer. It is the fastest way to spot lenient or strict raters and keep your appraisal process consistent.
Position Analysis
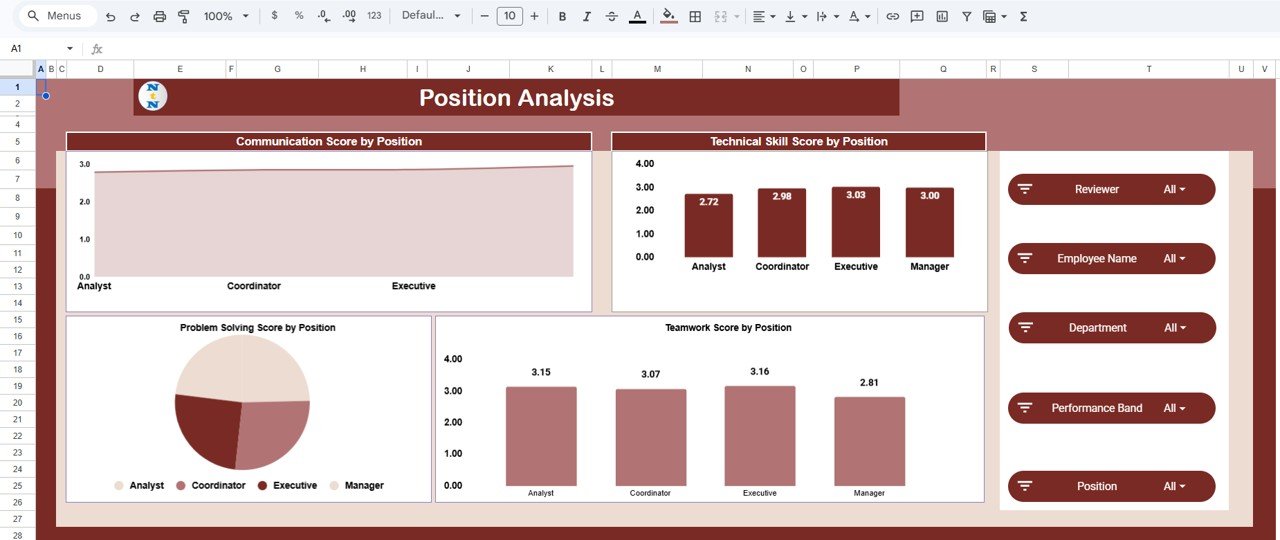
Here the scores are broken down by job role through Communication Score by Position, Technical Skill Score by Position, Problem Solving Score by Position, and Teamwork Score by Position. Use it to see which competencies are strong or weak at each level of the org.
Departmental Performance
Click here to purchase the HR Review Analytics Dashboard in Google Sheets.
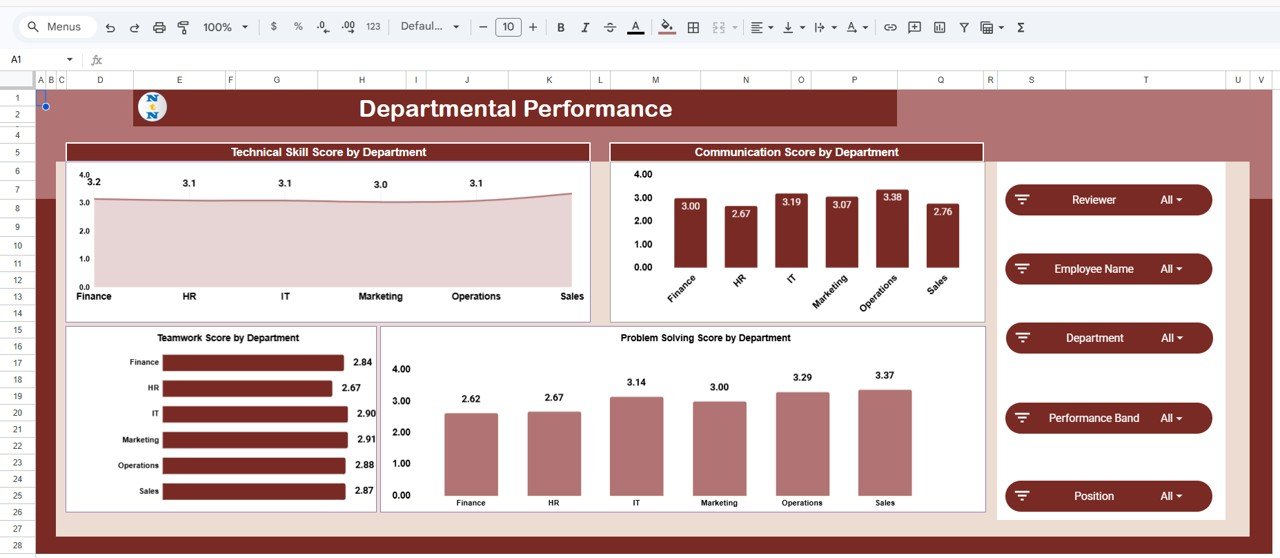
The department view shows Technical Skill Score by Department, Communication Score by Department, Teamwork Score by Department, and Problem Solving Score by Department side by side, making it easy to benchmark teams and target training budgets where they will help most.
Monthly Trends
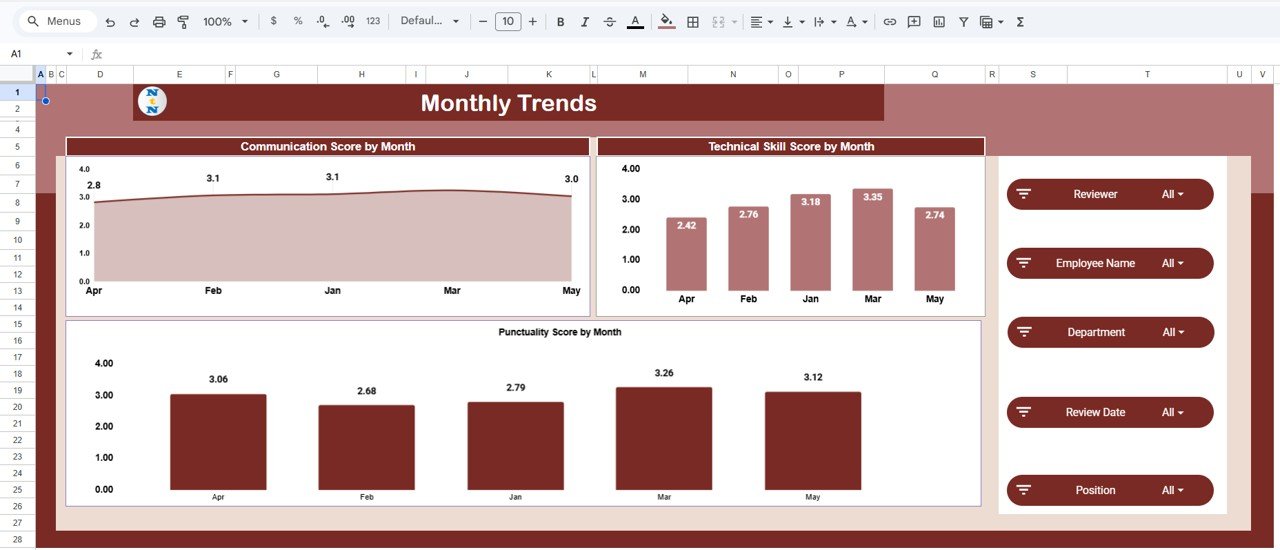
This tab tracks movement over time with Communication Score by Month, Technical Skill Score by Month, and Punctuality Score by Month, so you can tell whether coaching and feedback are actually moving the numbers quarter over quarter.
Search Sheet
The Search tab lets you find review records fast: choose a column, enter a search keyword, and the sheet lists every matching record along with the total count. It is ideal for pulling up one employee’s full review history before a one-on-one.
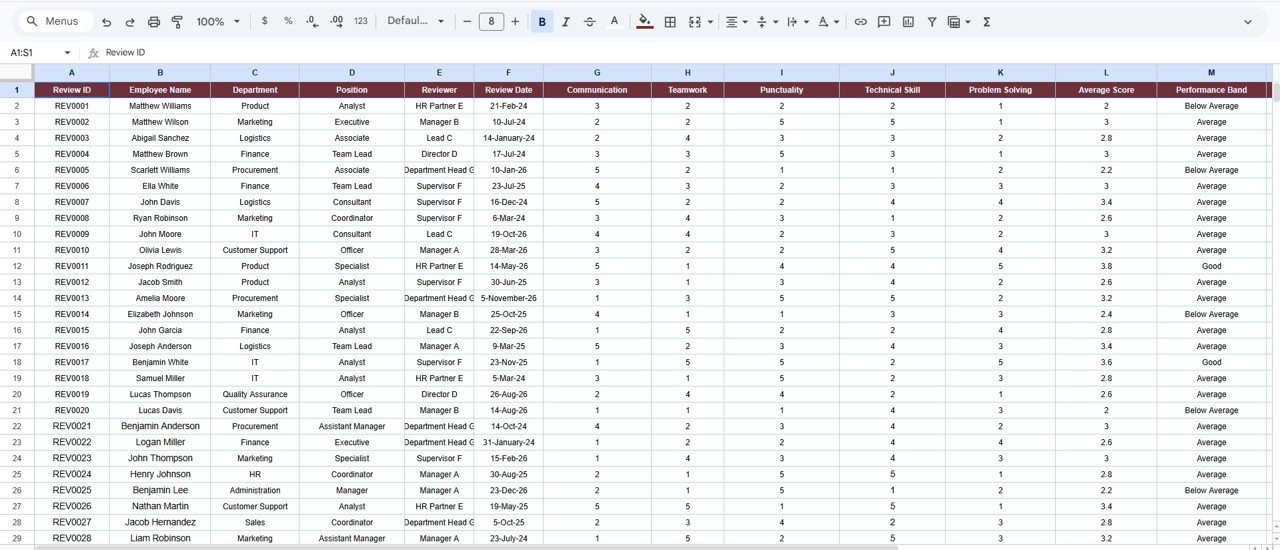
Data Sheet
Click here to purchase the HR Review Analytics Dashboard in Google Sheets.
The Data tab is where your review records live. Keep the same column format, add or paste new rows, and every KPI card, chart, and search result updates automatically across the workbook.
HR Review Analytics Dashboard vs. Excel vs. Paid Review SaaS — Feature Comparison
| Feature | HR Review Analytics Dashboard (Google Sheets) | Microsoft Excel Dashboard | Lattice / 15Five / BambooHR |
|---|---|---|---|
| Cost | $9.99 one-time | $17.99 one-time | $7–11 / user / month |
| Platform | Google Sheets (browser) | Excel desktop | Proprietary web app |
| Setup time | Under 10 minutes | Under 10 minutes | Days (onboarding + config) |
| Real-time team collaboration | ✅ Built in | Via OneDrive only | ✅ Yes |
| Mobile access | ✅ Sheets app | Limited | ✅ Yes |
| Own your data | ✅ In your Drive | ✅ Local file | ❌ Vendor-hosted |
| Customizable fields | ✅ Fully editable | ✅ Fully editable | Limited to plan |
| Year-1 cost at 25 users | $9.99 | $17.99 | $2,100–$3,300 |
For HR teams that want reviewer, department, and trend analytics without paying per-seat SaaS fees, the HR Review Analytics Dashboard in Google Sheets sits in the sweet spot.
Who Should Use This Template
Perfect for:
- HR managers and people-ops leads at 10–500 person companies running periodic appraisals
- Team leads who want to compare competency scores across reviewers and departments
- HR consultants who need a clean, shareable review report for multiple clients
- Small businesses replacing a paid review platform with a one-time-purchase Google Sheet
Not a fit if:
- You need automated 360-degree feedback collection with email workflows and reminders
- Your organization requires SOC 2, SSO, or HRIS integration out of the box
- You want continuous OKR or goal-tracking rather than periodic review scoring
Real-World Use Cases
Priya leads HR at a 60-person software firm. Each quarter she pastes the latest appraisal scores into the Data tab and uses the Reviewer Insights view to catch managers who rate everyone a 5, keeping the review process fair before scores reach leadership.
Daniel runs an HR consultancy. He duplicates the dashboard for each client, drops in their review data, and shares a read-only link so department heads can explore Communication, Teamwork, and Technical Skill scores by team without a single meeting.
Anita manages a retail chain’s regional staff. She watches the Monthly Trends tab to confirm that the punctuality coaching she rolled out is actually lifting scores month over month before expanding it to other stores.
Advantages of the HR Review Analytics Dashboard in Google Sheets
Click here to purchase the HR Review Analytics Dashboard in Google Sheets.
The biggest advantage is cost-to-value: a one-time $9.99 purchase replaces a recurring per-employee fee that can reach thousands of dollars a year for a 25-person team. Because it lives in Google Sheets, there is nothing to install, the data stays in your own Drive, and the whole HR team can collaborate in real time. The slicer-driven design also means non-technical managers can explore the data confidently without learning formulas.
Opportunities for Improvement
This is an analytics and reporting dashboard, not a full review-management system. It does not collect feedback through forms, send automated reminders, or run approval workflows — you bring the scored review data and it does the analysis. Very large datasets (tens of thousands of rows) will also perform better in a Power BI version than in Google Sheets. Teams needing those workflow features should pair this with a dedicated collection tool.
Best Practices
- Keep the Data tab column structure intact — add rows, never rename or reorder the existing headers.
- Use a consistent 1–5 (or 1–10) scoring scale across all reviewers so reviewer comparisons stay meaningful.
- Standardize department, position, and reviewer names with a dropdown to avoid duplicate categories in the charts.
- Take a fresh copy each review cycle so you keep a clean historical snapshot for year-over-year trends. See Google’s guide to sharing and copying Sheets for tips.
Explore Relevant Templates
- Employee Performance Review Dashboard in Google Sheets — a lighter review dashboard for smaller teams.
- HR KPI Dashboard in Google Sheets — broader HR metrics beyond reviews.
- Workforce Analytics Dashboard in Google Sheets — headcount and workforce trends.
Also available as: Employee Performance Review Dashboard in Excel and in Power BI. 💎 Want the full set? Get all 10 HR templates in the HR & Workforce Analytics Bundle and save 35%.
Need a different tool? Browse our Employee Attendance & Payroll Management System, the Staff Training Completion Calendar in Google Sheets, or the Small Business KPI Scorecard in Google Sheets.
Frequently Asked Questions
Click here to purchase the HR Review Analytics Dashboard in Google Sheets.
What does the HR Review Analytics Dashboard in Google Sheets track?
The HR Review Analytics Dashboard in Google Sheets tracks six review dimensions — communication, problem solving, teamwork, technical skill, punctuality, and an overall average score — across 19 charts and 7 tabs, broken down by reviewer, position, department, and month.
How long does setup take?
Setup takes under 10 minutes. Open the included PDF guide, click the Google Sheets copy link to create your own editable copy, then paste your review records into the Data tab. Every KPI card and chart updates automatically.
How does this compare to Lattice or 15Five?
Lattice and 15Five charge roughly $7–11 per user per month and host your data on their servers. The HR Review Analytics Dashboard in Google Sheets is a one-time $9.99 purchase, keeps data in your own Drive, and delivers the same reviewer, department, and trend analytics without per-seat fees.
Can my whole HR team use it at once?
Yes. Because the HR Review Analytics Dashboard in Google Sheets runs in Google Sheets, multiple HR users can view and edit the same workbook in real time on desktop or the mobile Sheets app.
Do I need formulas or coding to use it?
No. The HR Review Analytics Dashboard in Google Sheets uses native slicers and pre-built charts, so managers filter and read the data with clicks. You only ever add rows to the Data tab in the existing format.
Is the download a subscription?
No. It is a one-time payment with lifetime access and no recurring fees. You own the Google Sheet outright once you create your copy.
About the Author
Built by PK — Microsoft Certified Professional with 15+ years of Excel, Google Sheets, and Power BI experience. Founder of NextGenTemplates, reaching 300K+ subscribers across YouTube channels. Every template is hand-built and tested before release.
Conclusion
If you run periodic appraisals and want clear, shareable analytics without another monthly bill, the HR Review Analytics Dashboard in Google Sheets gives you reviewer, position, department, and monthly views in one cloud workbook. Click here to purchase the HR Review Analytics Dashboard in Google Sheets.
✅ Instant download · One-time payment · No subscription
🎥 For step-by-step video tutorials, visit YouTube.com/@NeoTechNavigators.
Last updated: June 2026