That much giving creates a real reporting challenge for nonprofits: leaders need to know where donations came from, where they were allocated, which programs used the funds, and whether beneficiaries were actually reached. The Donation Allocation and Beneficiary Dashboard in Google Sheets is built for that workflow. It turns donation records into cards, slicers, charts, program views, donor insights, funding analysis, impact tracking, a Record ID search page, and a structured Data sheet.
Get the Donation Allocation and Beneficiary Dashboard in Google Sheets
Key Features of Donation Allocation and Beneficiary Dashboard in Google Sheets
- Overview KPI cards: Total Donations, Donation Records, Beneficiaries Reached, and Avg Impact Score summarize the dashboard quickly.
- Five dashboard analysis pages: Overview, Program Performance, Donor Insights, Funding and Expenses, and Impact and Outcomes.
- Search Sheet tab: Select a Record ID and see full details for one donation allocation record.
- Data Sheet tab: Add new records in the same format and keep reporting consistent.
- Interactive slicers: Filter dashboard views quickly. Google explains how slicers filter charts and tables in Google Sheets Help.
- Nonprofit-ready metrics: Track donation amount, program expense, beneficiaries, impact score, status, donor type, channel, region, and coordinator.
Dashboard Pages Explanation
Donation Allocation and Beneficiary Dashboard in Google Sheets.
1. Overview Page
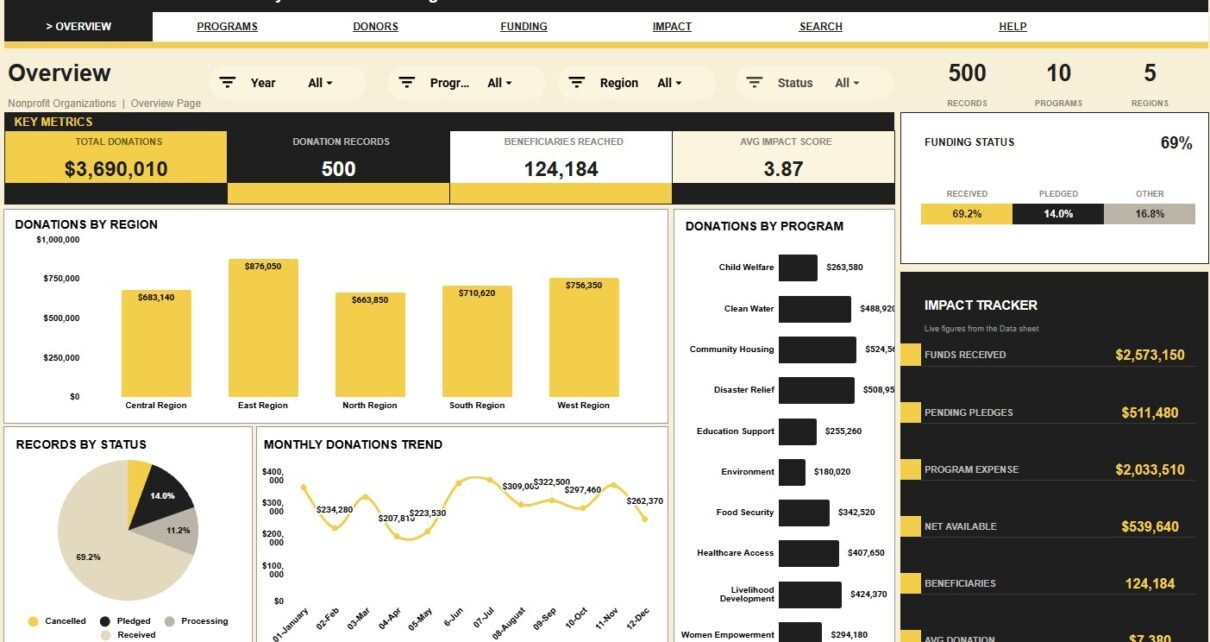
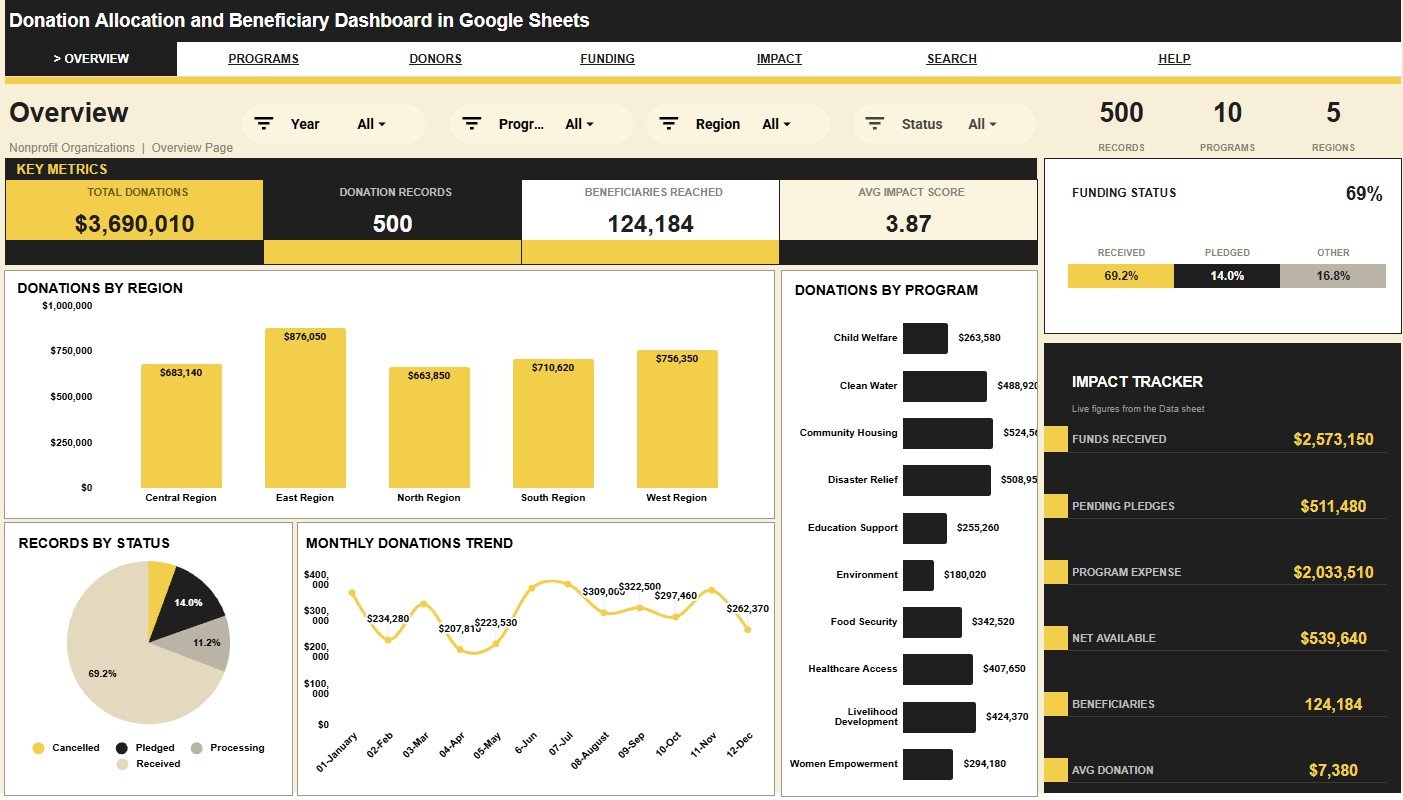
The Overview page opens with four cards: Total Donations, Donation Records, Beneficiaries Reached, and Avg Impact Score. These cards give directors, finance teams, and program managers a quick read before they review the detailed charts.
Donations by Region: Shows how donation value is distributed across regions.
Use it to identify stronger regions, weaker coverage, and locations that may need more fundraising attention.
Donations by Program: Compares donation allocation across nonprofit programs.
Use it to see which programs receive the largest share and whether funding matches strategic priorities.
Records by Status: Counts donation records by status such as completed, active, pending, or similar stages.
Use it to spot follow-up work and understand how many records are still moving through the process.
Donations by Month: Tracks donation movement across months.
Use it to identify seasonal giving patterns, campaign peaks, and months that need stronger donor outreach.
Funding Status by Status: Reviews funding status across the selected status categories.
Use it to compare funded, partially funded, and pending records during finance reviews.
Impact Tracker by Metric: Shows impact-related metrics in one tracker view.
Use it to connect money received with beneficiaries and impact score outcomes.
2. Program Performance
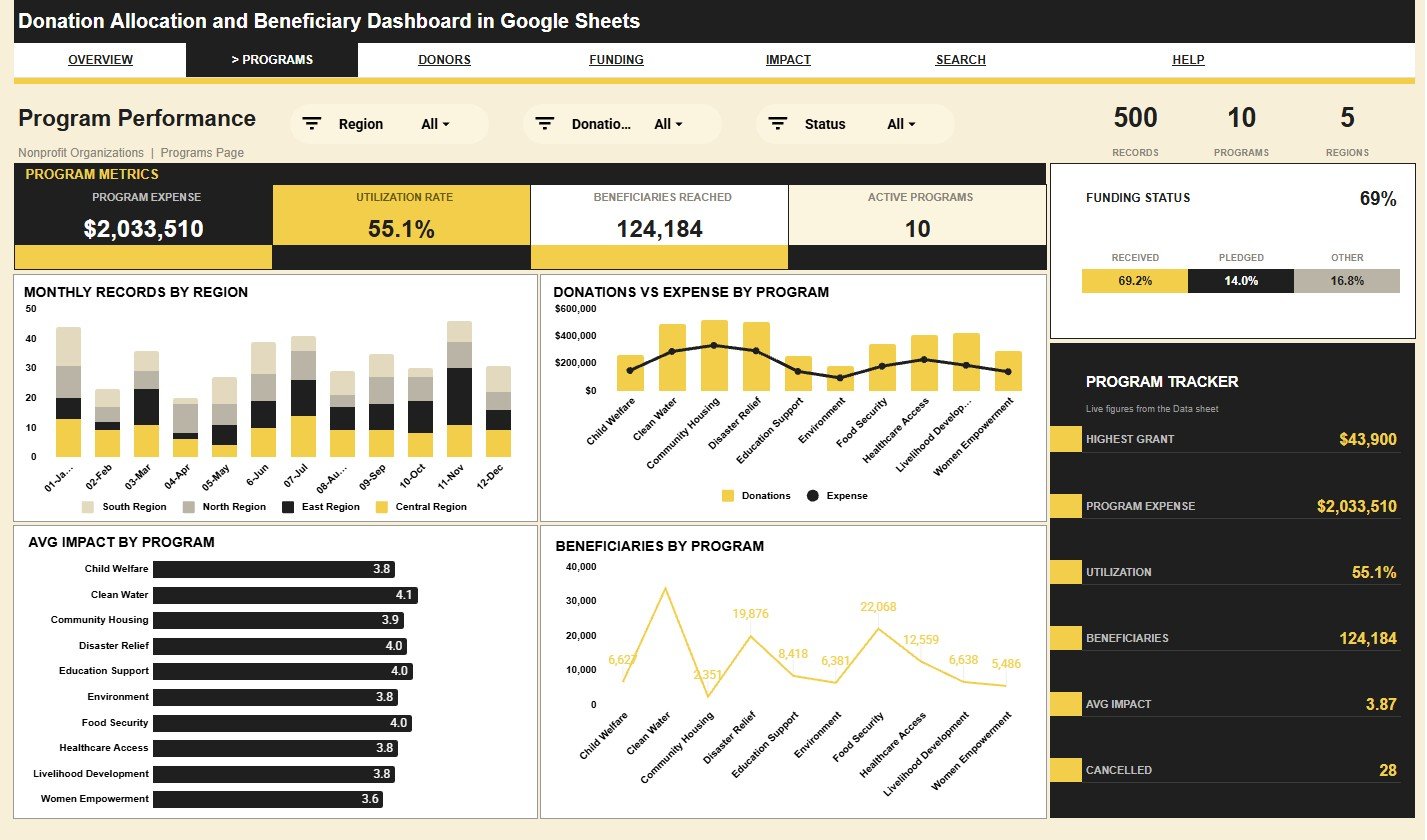
This tab is designed for program-level review. It helps teams compare regional activity, program spending, beneficiaries, impact, and status from one sheet.
Monthly Records by Region: Tracks record volume by region over time.
Use it to see whether program activity is increasing in the regions you serve.
Donations and Expense by Program: Compares donation amount with program expense for each program.
Use it to understand which programs are well funded and which programs may be spending faster than donations arrive.
Avg Impact by Program: Shows average impact score by program.
Use it to compare outcome quality across programs rather than looking only at donation value.
Beneficiaries by Program: Compares the number of beneficiaries reached by each program.
Use it to identify high-reach programs and programs that may need operational support.
Funding Status by Status: Breaks program records into funding status groups.
Use it to track which program records are funded, pending, or under review.
Program Tracker by Metric: Summarizes program metrics in a tracker-style view.
Use it to monitor multiple program indicators without opening the raw Data sheet.
Donation Allocation and Beneficiary Dashboard in Google Sheets.
3. Donor Insights
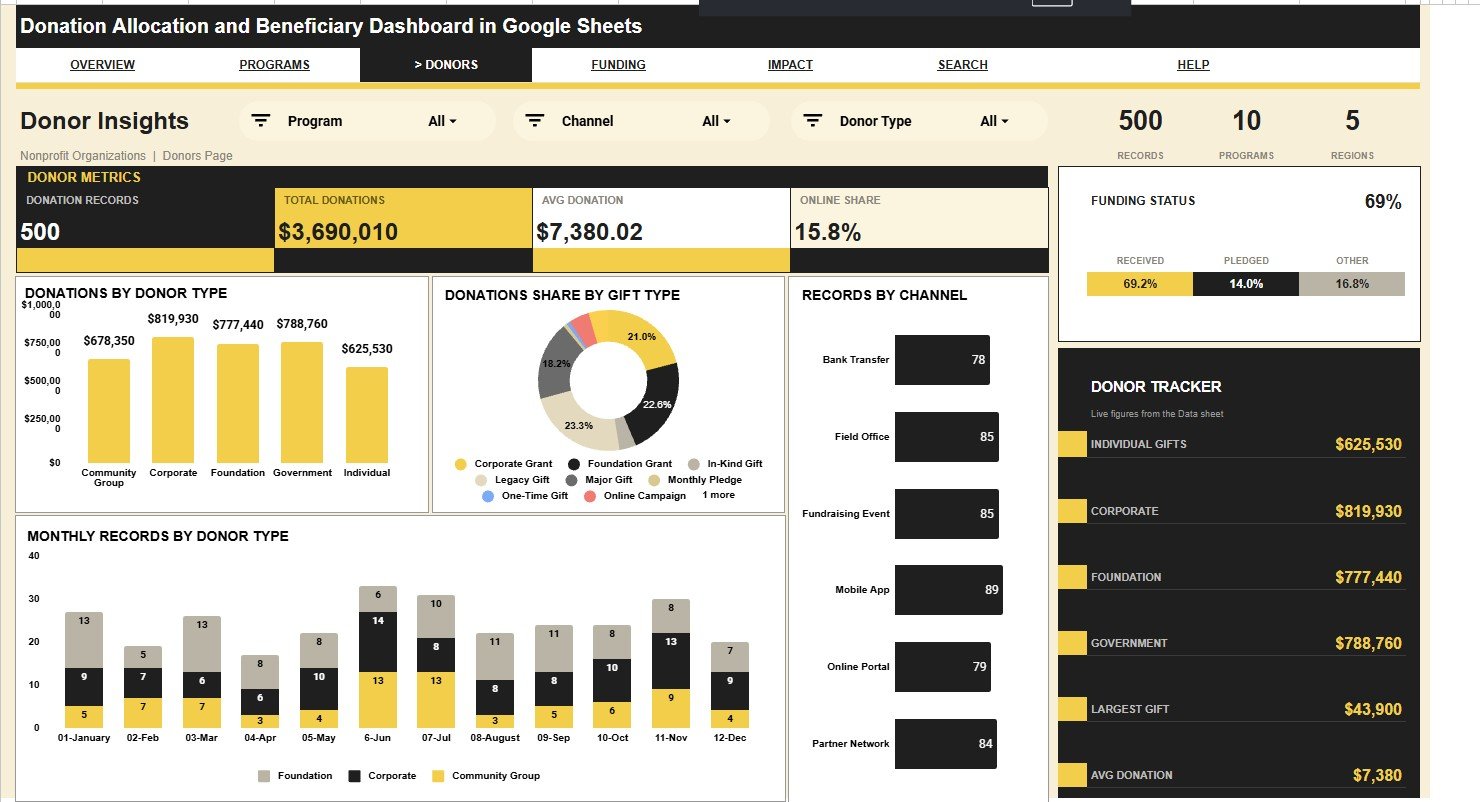
The Donor Insights tab helps fundraising teams understand who is giving and how gifts arrive. It is useful for donor segmentation, channel review, and monthly fundraising meetings.
Donations by Donor Type: Shows donation value by donor category.
Use it to compare individuals, foundations, corporate donors, recurring donors, or other donor groups in your data.
Donation Share by Gift Type: Shows the share of donations by gift type.
Use it to understand how one-time gifts, recurring gifts, grants, in-kind support, or other gift formats contribute to funding.
Records by Channel: Counts donation records by channel.
Use it to compare online, offline, event, partner, campaign, and other giving channels.
Monthly Records by Donor Type: Tracks donor-type record movement by month.
Use it to see which donor groups are active during specific periods.
Funding Status by Status: Reviews donor-related records by status.
Use it to understand which donor commitments are completed, pending, or still need action.
Donor Tracker by Metric: Brings donor metrics into a tracker view.
Use it to monitor donor type, channel, gift type, and status indicators together.
Donation Allocation and Beneficiary Dashboard in Google Sheets.
4. Funding and Expenses
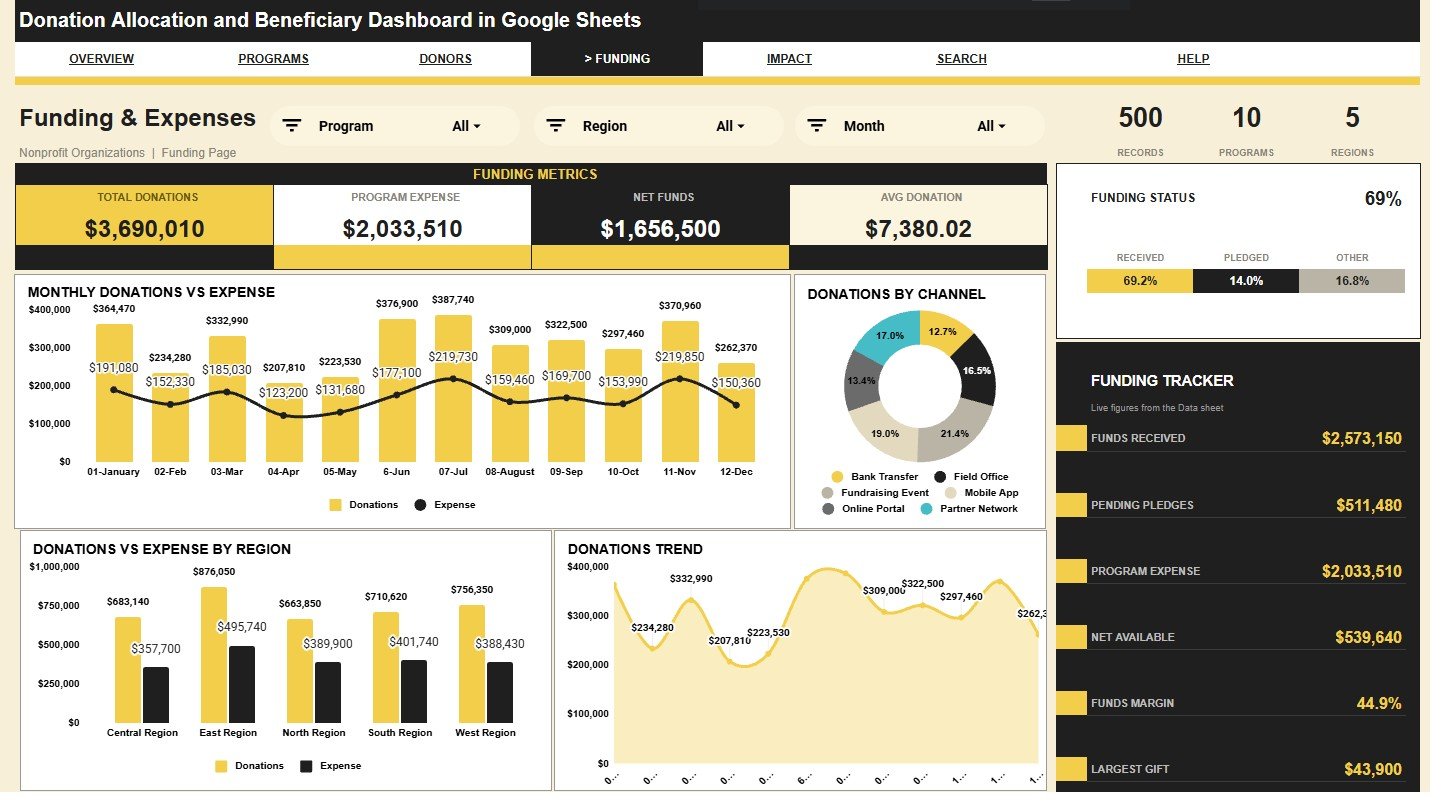
The Funding and Expenses page connects donation intake with program expense. It is helpful for budget review, fund allocation meetings, and monthly finance reporting.
Monthly Donations and Expense by Month: Compares donation amount and program expense by month.
Use it to see whether spending is moving in line with incoming donations.
Donations by Channel: Shows donation amount by giving channel.
Use it to find the channels that generate the most funding.
Donations and Expense by Region: Compares regional donations with regional expenses.
Use it to review whether funding and spending are balanced across locations.
Donations by Month: Tracks donation amount across the calendar.
Use it to identify high-performing months and periods where campaigns may need support.
Funding Status by Status: Shows funding status distribution.
Use it to review how many records are funded, pending, partially funded, or otherwise categorized.
Funding Tracker by Metric: Summarizes funding indicators in a tracker view.
Use it to monitor donation, expense, region, channel, and status metrics together.
Donation Allocation and Beneficiary Dashboard in Google Sheets.
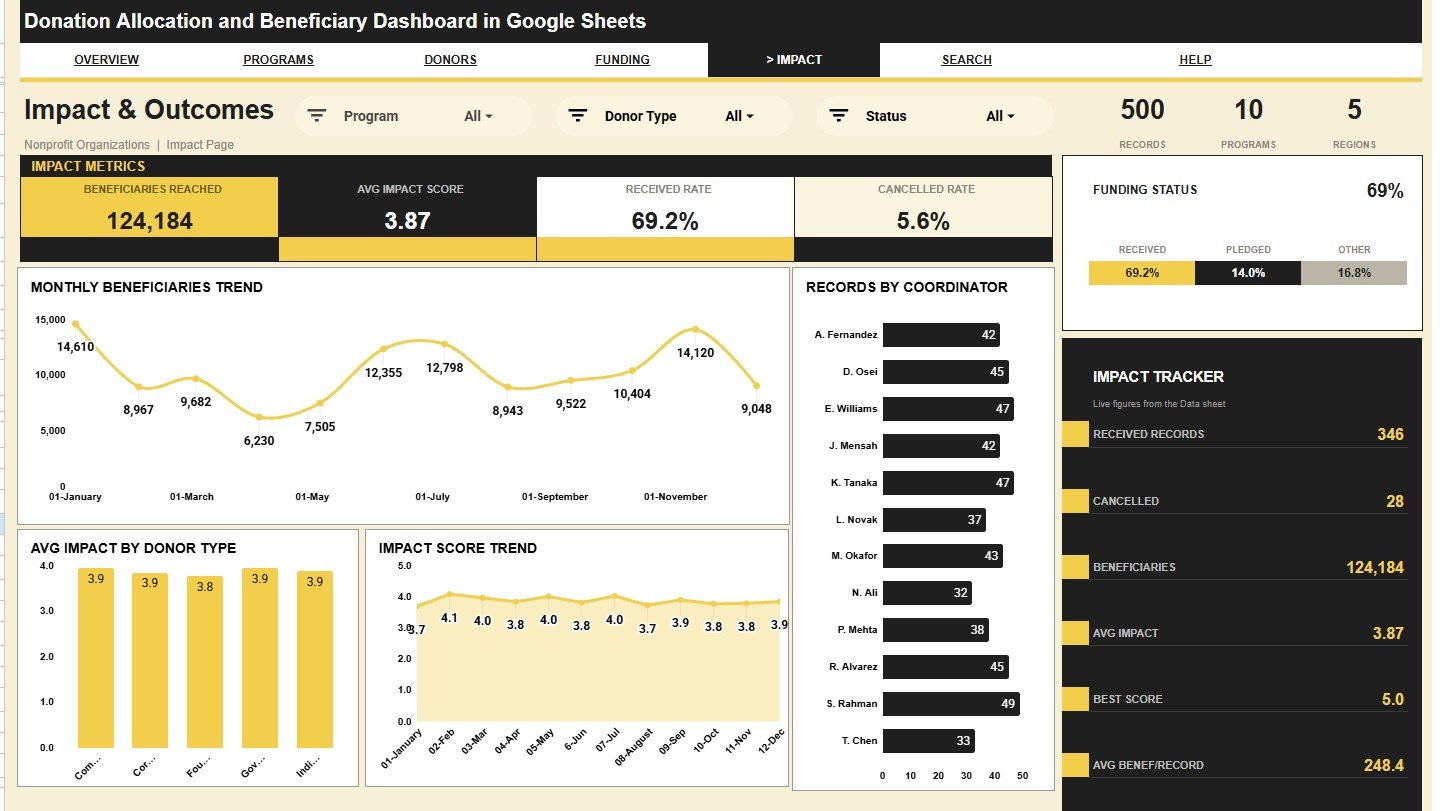
5. Impact and Outcomes
The Impact and Outcomes tab helps teams connect donations and expenses to beneficiary reach. It is the best page for program outcome reviews and impact reporting.
Monthly Beneficiaries by Month: Tracks beneficiary count across months.
Use it to see when reach increases, slows, or changes after major campaigns.
Records by Coordinator: Counts records handled by each coordinator.
Use it to understand workload distribution and follow-up ownership.
Avg Impact by Donor Type: Compares average impact score by donor type.
Use it to see whether certain donor segments are associated with higher impact records.
Impact Score by Month: Tracks impact score movement by month.
Use it to evaluate whether outcomes improve, decline, or stay steady over time.
Funding Status by Status: Reviews impact-related records by funding status.
Use it to see whether funded records are producing stronger outcome patterns.
Impact Tracker by Metric: Summarizes impact measures in a tracker view.
Use it to monitor beneficiary reach, impact score, coordinator activity, and funding status together.
Donation Allocation and Beneficiary Dashboard in Google Sheets.
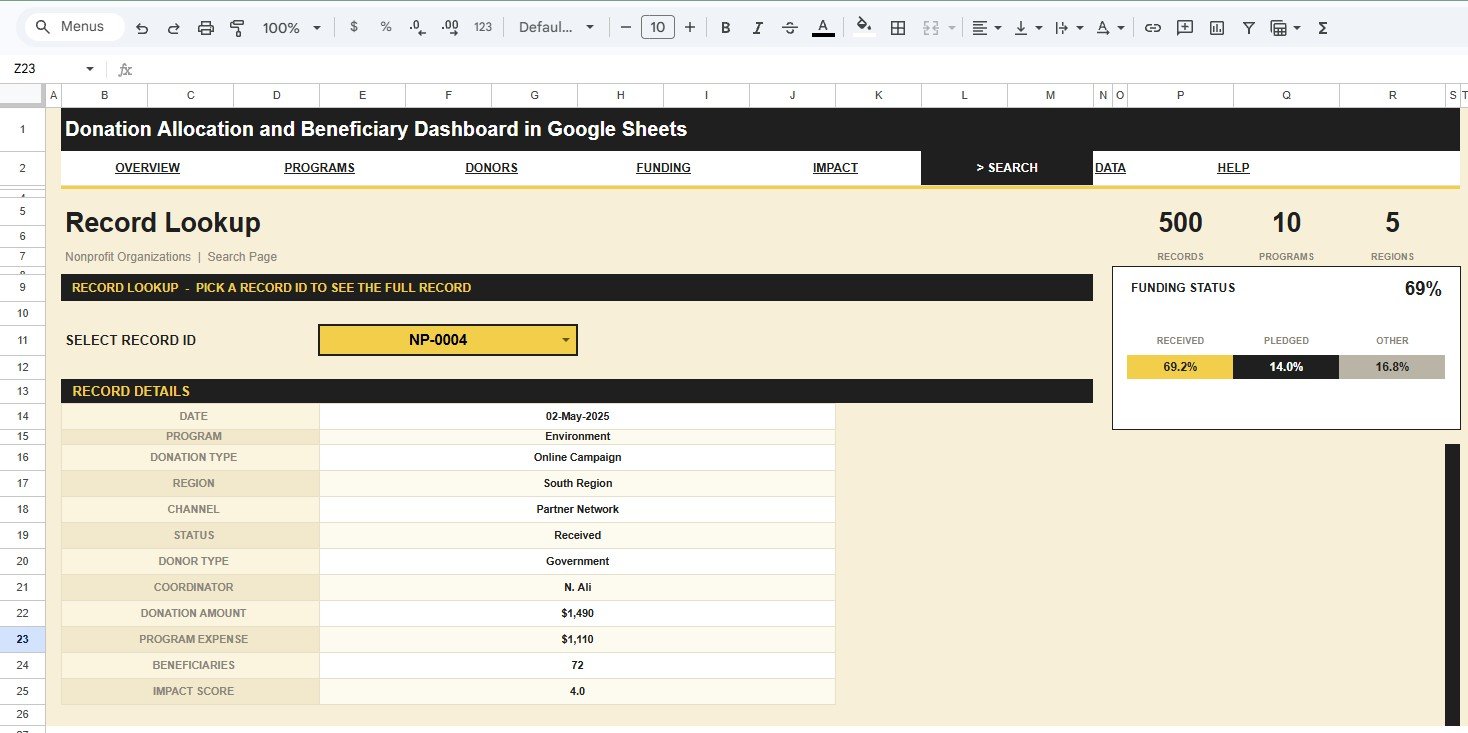
6. Search Sheet Tab
The Search sheet lets you select a Record ID and instantly view the full donation allocation record. It includes date, program, donation type, region, channel, status, donor type, coordinator, donation amount, program expense, beneficiaries, and impact score.
Donation Allocation and Beneficiary Dashboard in Google Sheets.
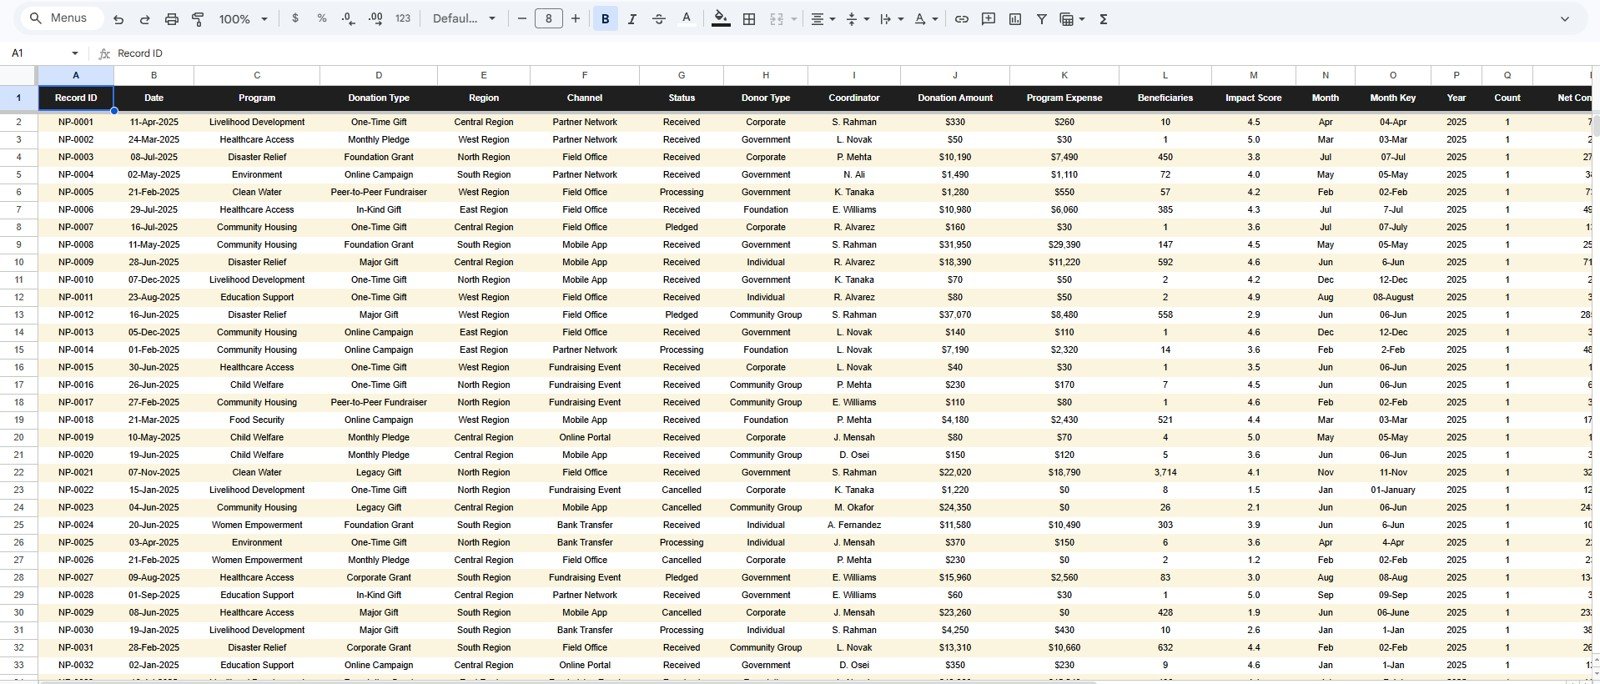
7. Data Sheet Tab
The Data sheet is where you add your records in the same format. Keep column names and record structure consistent so the cards, slicers, charts, and Search sheet continue working correctly.
Donation Allocation and Beneficiary Dashboard in Google Sheets.
Donation Allocation and Beneficiary Dashboard in Google Sheets vs. Microsoft Excel Dashboard vs. Paid Donor SaaS – Feature Comparison
| Feature | This Google Sheets template | Microsoft Excel dashboard | Paid donor SaaS or CRM |
|---|---|---|---|
| Cost | $9.99 one-time | Template price plus Excel or Microsoft 365 access | Recurring subscription and possible onboarding fees |
| Platform | Google Sheets in browser | Excel desktop or Microsoft 365 | Vendor cloud platform |
| Setup time | Copy file, paste records, review charts | Open workbook and refresh data | Implementation and configuration |
| Real-time team collaboration | Built into Google Drive sharing | Possible through OneDrive | Usually available by paid user |
| Mobile access | Google Sheets app and browser | Excel mobile with limits | Usually included |
| Customizable fields | Editable sheets, formulas, charts, and slicers | Editable workbook | Often limited by vendor setup |
| Share with link | Yes, controlled by Google permissions | Possible through cloud storage | Usually login based |
| Year-1 cost at 5 users | $9.99 plus any Google Workspace plan already used | Template plus Microsoft licensing | Varies by vendor and seat count |
| Record ID lookup | Built-in Search sheet | Requires setup unless included | Usually included |
Who Should Use This Template
Donation Allocation and Beneficiary Dashboard in Google Sheets.
This template fits nonprofit directors, NGO program teams, charity finance leads, foundation operations teams, fundraising managers, donor reporting teams, grant support teams, and consultants who need donation allocation reporting in a familiar spreadsheet environment.
It is especially useful when your organization already exports donation records from forms, payment tools, accounting systems, CRM exports, or manual registers and needs a cleaner way to review them.
Real-World Use Cases
Anita, finance manager at a local NGO: uses the Overview and Funding and Expenses pages to compare donations, expenses, funding status, and monthly movement before board meetings.
Marcus, program coordinator: uses Program Performance and Impact and Outcomes to understand which programs are reaching more beneficiaries and which programs need support.
Priya, fundraising consultant: uses Donor Insights to show clients which donor types, gift types, and channels are contributing the most funding.
Advantages of Donation Allocation and Beneficiary Dashboard in Google Sheets
The main advantage is speed. Instead of building charts from scratch, users can paste structured records and begin reviewing donation, funding, expense, program, donor, and impact views inside Google Sheets.
The second advantage is collaboration. Teams can share the file through Google Drive, protect key tabs, and review the same dashboard without passing file versions back and forth.
The third advantage is transparency. The Data sheet remains visible, so teams can trace dashboard visuals back to the underlying record format.
Opportunities for Improvement
This dashboard does not replace a donor CRM, payment processor, accounting system, grant compliance platform, or automated donation receipt workflow. It also does not automatically connect to bank feeds, online donation forms, or live donor databases.
For larger organizations, the best setup may be to export clean records from your source system and use this dashboard as a lightweight analysis and reporting layer.
Best Practices
Donation Allocation and Beneficiary Dashboard in Google Sheets.
- Keep the Data sheet column structure unchanged unless you are comfortable editing formulas and charts.
- Use consistent names for regions, programs, statuses, donor types, channels, and coordinators.
- Review donation amount and program expense totals against your accounting records before board reporting.
- Protect formula-driven areas so accidental edits do not break charts or cards.
- Use slicers during meetings to answer specific questions by region, program, donor type, status, or month.
- Use the Search sheet when someone asks about one specific Record ID.
Explore Relevant Templates
Get the product here: Donation Allocation and Beneficiary Dashboard in Google Sheets.
You may also like , Fundraising Campaign KPI Dashboard in Google Sheets, Charity Fundraising KPI Dashboard in Google Sheets, Donation Management Tracker in Google Sheets, and Political Campaign Dashboard in Google Sheets.
To build dashboards like this on your own data, the Excel Pivot Tables & Dashboards course on NextGenTemplates Academy is a good place to start, with practice files included.
Get the Donation Allocation and Beneficiary Dashboard in Google Sheets
Frequently Asked Questions
Is this dashboard built in Google Sheets?
Yes. It is built for Google Sheets and can be copied to Google Drive for editing, sharing, and collaboration.
What cards are included on the Overview page?
The Overview page includes Total Donations, Donation Records, Beneficiaries Reached, and Avg Impact Score.
What does the Search sheet do?
The Search sheet lets you select a Record ID and view the full record details, including program, donor type, region, status, donation amount, expense, beneficiaries, and impact score.
Can I replace the sample data?
Yes. Add your own records in the Data sheet using the same format and keep the column structure consistent.
Does this dashboard connect to online donation platforms?
No direct connector is included. Export or prepare your donation records first, then paste them into the Data sheet.
Can multiple people use it?
Yes. Google Sheets supports team sharing, and you can control view or edit permissions through Google Drive.
About the Author
Built by PK – Microsoft Certified Professional with 15+ years of Excel, Google Sheets, and Power BI experience. Founder of NextGenTemplates, reaching 300K+ subscribers across YouTube channels. Every template is hand-built and tested before release.
Conclusion
The Donation Allocation and Beneficiary Dashboard in Google Sheets gives nonprofit and NGO teams a practical way to review donations, program expenses, beneficiary reach, donor insights, funding status, and impact outcomes in one shareable workbook. Use it when you need clear dashboard reporting without moving your whole organization into a full donor SaaS platform.
Donation Allocation and Beneficiary Dashboard in Google Sheets.