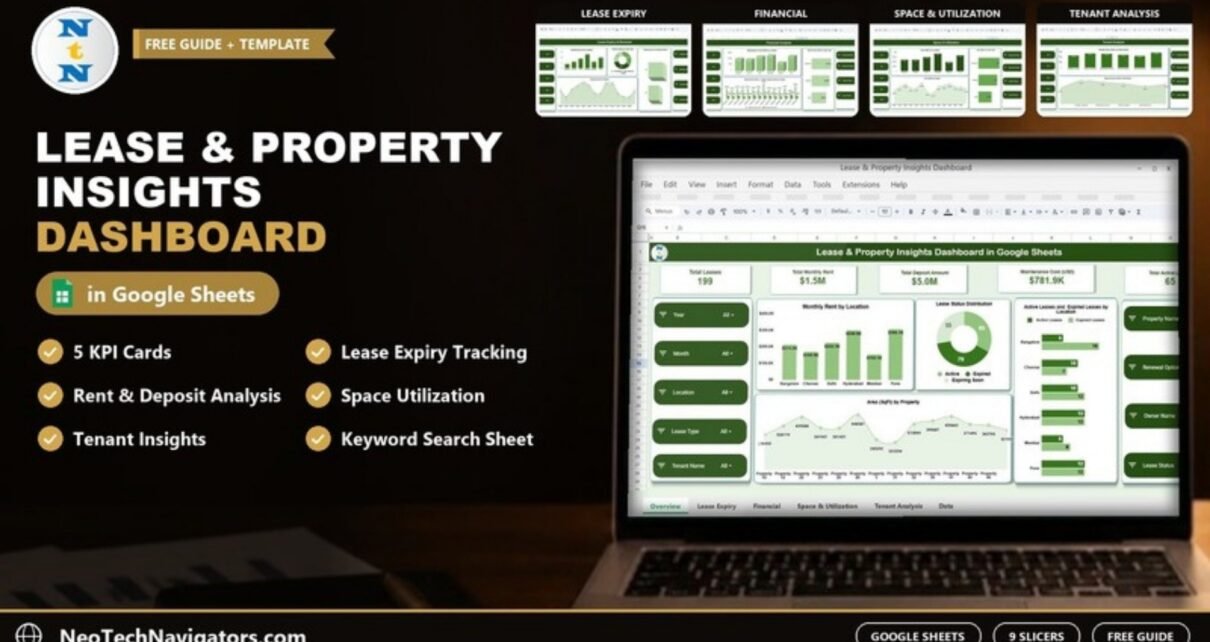
If you look after more than a handful of leases, the hard part is rarely the data itself. It is seeing it all at once: which leases are about to end, where the rent comes from, how much is held in deposits and which locations cost the most to maintain. The Lease & Property Insights Dashboard in Google Sheets pulls those answers into five KPI cards, four analysis pages, a search sheet and a single data table.
This guide walks through every page of the template as it ships, explains what each chart tells you, and shows how to replace the sample data with your own portfolio. It is written for property managers, landlords, leasing teams and facility managers who already work in Google Sheets and want a clear view without buying property management software.
🎥 Watch the Video Tutorial
Get the Lease & Property Insights Dashboard
What the Lease & Property Insights Dashboard Solves
Most lease registers start as a simple list: property, tenant, start date, end date, rent. That list works until someone asks a question that needs a summary. How many leases expire soon in Hyderabad? Which lease type brings in the most rent? Which tenant holds the largest deposit? Answering each one by hand means filtering, copying and adding up again every month.
This dashboard keeps the list (the Data Sheet) and builds the summaries for you. Every page reads from the same table, and the same set of slicers sits on each page, so you can narrow everything to one year, one location, one tenant or one lease status in a couple of clicks.
Template at a Glance
| Sheet / page | What it shows |
|---|---|
| Overview | 5 KPI cards, Monthly Rent by Location, Lease Status Distribution, Area (SqFt) by Property, Active vs Expired Leases by Location |
| Lease Expiry & Renewal | Expiring Soon by Location, Expired Leases by Lease Type, Expiring Soon by Renewal Option, Expiring Soon by Property |
| Financial Analysis | Maintenance Cost (USD) by Location, Monthly Rent (USD) by Lease Type, Monthly Rent (USD) vs Deposit Amount (USD) by Property |
| Space & Utilization | Area (SqFt) by Location, Area (SqFt) by Lease Type, Area (SqFt) by Property |
| Tenant Analysis | Monthly Rent (USD) by Tenant Name, Deposit Amount (USD) by Tenant Name |
| Search | Pick a column, type a keyword, see the matching lease records and a Total Record count |
| Data Sheet | One row per lease – the only sheet you edit |
Every dashboard page carries nine slicers: Year, Month, Location, Lease Type and Tenant Name on the left, and Property Name, Renewal Option, Owner Name and Lease Status on the right.
Page-by-Page Walkthrough
1. Overview – Your Portfolio in One Screen
The Overview opens with five KPI cards. In the sample data they read:
| KPI card | Sample value | What it tells you |
|---|---|---|
| Total Leases | 199 | Number of lease records in the current slicer selection |
| Total Monthly Rent | $1.5M | Sum of the Monthly Rent (USD) column |
| Total Deposit Amount | $5.0M | Sum of deposits held across the selected leases |
| Maintenance Cost (USD) | $781.9K | Sum of the Maintenance Cost (USD) column |
| Total Active Leases | 65 | Leases whose status is Active |
Below the cards, four charts give context:
- Monthly Rent by Location – a column chart across Bangalore, Chennai, Delhi, Hyderabad, Mumbai and Pune. In the sample, Pune ($306.1K) and Hyderabad ($298.9K) lead.
- Lease Status Distribution – a doughnut split into Active (65), Expired (79) and Expiring Soon (55). Together they add up to the 199 leases on the first card.
- Area (SqFt) by Property – an area chart comparing the total leased area of each property.
- Active Leases and Expired Leases by Location – paired bars per city, so you can spot locations where expired leases outnumber active ones (Bangalore shows 6 active against 16 expired in the sample).

2. Lease Expiry & Renewal – What Ends Next
This page is the one to open at the start of each month. It answers a single question from four angles: which leases need attention before they lapse?
- Expiring Soon by Location – in the sample, Hyderabad has 13 leases expiring soon, Pune 10 and Delhi 9.
- Expired Leases by Lease Type – a doughnut split across Commercial, Industrial and Retail leases.
- Expiring Soon by Renewal Option – separates leases that carry a renewal option (Yes) from those that do not (No). Leases marked No usually need a negotiation or a re-letting plan.
- Expiring Soon by Property – a property-level count, so you can see which buildings have several leases ending at the same time.

3. Financial Analysis – Rent, Deposits and Maintenance
The Financial Analysis page puts income and cost side by side:
- Maintenance Cost (USD) by Location – Hyderabad ($135.3K) and Pune ($130.1K) carry the highest maintenance spend in the sample; Mumbai the lowest ($72.6K).
- Monthly Rent (USD) by Lease Type – Commercial $437.2K, Industrial $405.5K and Retail $325.8K.
- Monthly Rent (USD) vs Deposit Amount (USD) by Property – a clustered column chart that shows how large each property’s deposit pool is compared with its monthly rent.
Reading the maintenance chart next to the rent-by-location chart on the Overview is a quick way to spot a city where upkeep is eating into income.

4. Space & Utilization – Where the Square Footage Sits
Three charts break down leased area:
- Area (SqFt) by Location – Hyderabad has the most leased area in the sample (933.0K sq ft), Mumbai the least (472.6K).
- Area (SqFt) by Lease Type – Commercial 1.4M, Industrial 1.3M and Retail 902.8K.
- Area (SqFt) by Property – the property-level area curve also shown on the Overview.
Comparing area with rent helps you judge whether a location or lease type earns its share of the space.

5. Tenant Analysis – Who Contributes What
The Tenant Analysis page has two charts: Monthly Rent (USD) by Tenant Name and Deposit Amount (USD) by Tenant Name. The sample tenants are BrightWave Logistics, Evergreen Enterprises, Global InfoTech Services, PrimeTech Solutions, Skyline Retail Group and UrbanNest Interiors, with UrbanNest Interiors ($287.8K) and Evergreen Enterprises ($272.1K) paying the most rent.
This view is useful before renewal talks: you know how much each tenant matters to your income and how much of their money you already hold as deposit.

6. Search – Find Any Lease in Seconds
The Search sheet works in two steps. Choose a field in Select Column (for example Lease Type), then type a value in Search Keyword (for example Industrial). The sheet lists every matching lease with all its columns and shows a Total Record count – 51 Industrial leases in the sample.

7. Data Sheet – The Only Sheet You Edit
Every chart and card reads from the Data Sheet. Each row is one lease, with these columns:
- Lease ID, Property Name, Location, Tenant Name, Owner Name, Lease Type
- Lease Start Date, Lease End Date
- Area (SqFt), Monthly Rent (USD), Annual Escalation (%), Deposit Amount (USD), Maintenance Cost (USD)
The Renewal Option and Lease Status values that the slicers filter on are kept on the same row as each lease.

How to Use It With Your Own Data
- Make your own copy of the file in Google Drive so the original stays clean.
- Clear the sample rows on the Data Sheet, keeping the header row exactly as it is.
- Paste or type your leases, one per row. Use real dates (YYYY-MM-DD works well) and plain numbers for area, rent, deposit and maintenance – no currency symbols or text.
- Keep names consistent. “Property 12” and “Property-12” will be treated as two properties, and the same goes for locations and tenants.
- Open the Overview and check that Total Leases matches the number of rows you entered.
- Use the slicers to filter by Year, Month, Location or Lease Status, and repeat the check on the Lease Expiry & Renewal page.
- Update monthly (or whenever a lease starts, ends or renews) so the expiry counts stay accurate.
Real-World Use Cases
- Multi-city commercial landlord: compare rent, maintenance and leased area across six or more cities and decide where to invest in upkeep or where to raise rent at renewal.
- Facility or workplace team in a company: track the offices and warehouses the business rents, see which leases end in the next few months and which have a renewal option.
- Small property management firm: show owners a clean monthly summary of their properties by filtering on Owner Name, instead of sending raw spreadsheets.
Best Practices
- Review the Lease Expiry & Renewal page on the same day every month.
- Do not merge cells or insert blank rows in the Data Sheet – charts read the table as one continuous range.
- Keep a dated backup copy before large imports.
- Reset all slicers to All before sharing a screenshot so readers see the full portfolio.
- Store currency in one unit (the template uses USD labels); convert other currencies before entering them.
Limitations – Who Should Not Use It
- It is a reporting dashboard, not an accounting system. It does not record individual rent payments, invoices or arrears.
- There are no automatic email reminders for expiring leases; you review the expiry page yourself.
- Very large portfolios (many thousands of leases) can make Google Sheets slow – a database or Power BI may suit them better.
- If you need tenant portals, document storage or maintenance work orders, you need dedicated property management software.
Related Guides and Templates
If your focus is offices only, the Office Lease Management Dashboard in Google Sheets is a narrower alternative, and the Commercial Lease Analytics Dashboard goes deeper on commercial leases. For KPI tracking across a managed portfolio, see the Property Management KPI Dashboard; to log renewal requests as they come in, the Office Lease Renewal Request Tracker pairs well with this dashboard. Investors may also like the Real Estate Property Portfolio Performance Dashboard.
Prefer Excel? The Lease Management Dashboard in Excel covers similar ground in a desktop format.
If you want to build dashboards like this yourself, the Pivot Tables & Dashboards course on NextGenTemplates Academy teaches the summarising and charting techniques step by step.
Frequently Asked Questions
What does the Lease & Property Insights Dashboard track?
It tracks total leases, monthly rent, deposits, maintenance cost and active leases, plus lease status, expiring leases, leased area and tenant-wise rent and deposits – all from one Data Sheet.
Do I need Google Workspace or any add-on?
No. It runs in a regular Google Sheets file with a free Google account and works in any modern browser.
How does the dashboard know which leases are expiring soon?
Each lease carries a status (Active, Expired or Expiring Soon) used by the Lease Status slicer and the expiry charts. Keep the status and the Lease End Date up to date when you add or renew a lease.
Can I add more locations, properties or tenants?
Yes. New values in the Data Sheet appear in the charts and slicers. The sample charts show six cities (Bangalore, Chennai, Delhi, Hyderabad, Mumbai and Pune); you can enter any locations you manage.
Can I share the dashboard with my team or property owners?
Yes. Use the normal Google Sheets Share button. Give view access to people who only need to read the dashboard and edit access only to whoever maintains the Data Sheet.
Can I change the currency from USD?
The labels say USD, but the numbers are plain values. You can enter amounts in your own currency and edit the chart titles and number formats to match.
Wrapping Up
The Lease & Property Insights Dashboard in Google Sheets turns a lease list into a monthly decision tool: what is expiring, where the rent comes from, what upkeep costs and which tenants matter most. Load your leases into the Data Sheet, check the Overview totals, and make the Lease Expiry & Renewal page part of your monthly routine.
Get the Lease & Property Insights Dashboard
📅 Last updated: October 2026