Managing residential or commercial properties involves tracking occupancy, rental income, expenses, maintenance efficiency, and tenant performance. However, many property managers still rely on scattered spreadsheets, manual calculations, and static reports. As a result, visibility reduces and decision-making slows down.Property Management KPI Dashboard in Google Sheets
That is exactly where a Property Management KPI Dashboard in Google Sheets becomes a game-changer.
Get the Property Management KPI Dashboard in Google Sheets
This ready-to-use KPI dashboard helps property owners, real estate managers, and facilities teams monitor performance using structured KPIs, visual trends, and clear target comparisons—all inside Google Sheets.Property Management KPI Dashboard in Google Sheets
In this article, you will learn how the dashboard works, its worksheet structure, a complete KPI list with formulas, advantages, best practices, and FAQs.Property Management KPI Dashboard in Google Sheets
What Is a Property Management KPI Dashboard in Google Sheets?
A Property Management KPI Dashboard is a performance monitoring tool that tracks key metrics related to property operations, financial performance, tenant management, and maintenance efficiency.
Because this dashboard is built in Google Sheets, it offers:
-
Centralized KPI tracking
-
Easy collaboration
-
Real-time updates
-
Target vs actual comparison
-
No expensive property software required
This dashboard is ideal for:
-
Property owners
-
Real estate managers
-
Facility management teams
-
Leasing and finance teams
Key Features of the Property Management KPI Dashboard
The dashboard consists of 6 structured worksheet tabs, designed to support monthly, yearly, and historical performance analysis.
Dashboard Sheet Tab (Main Dashboard)
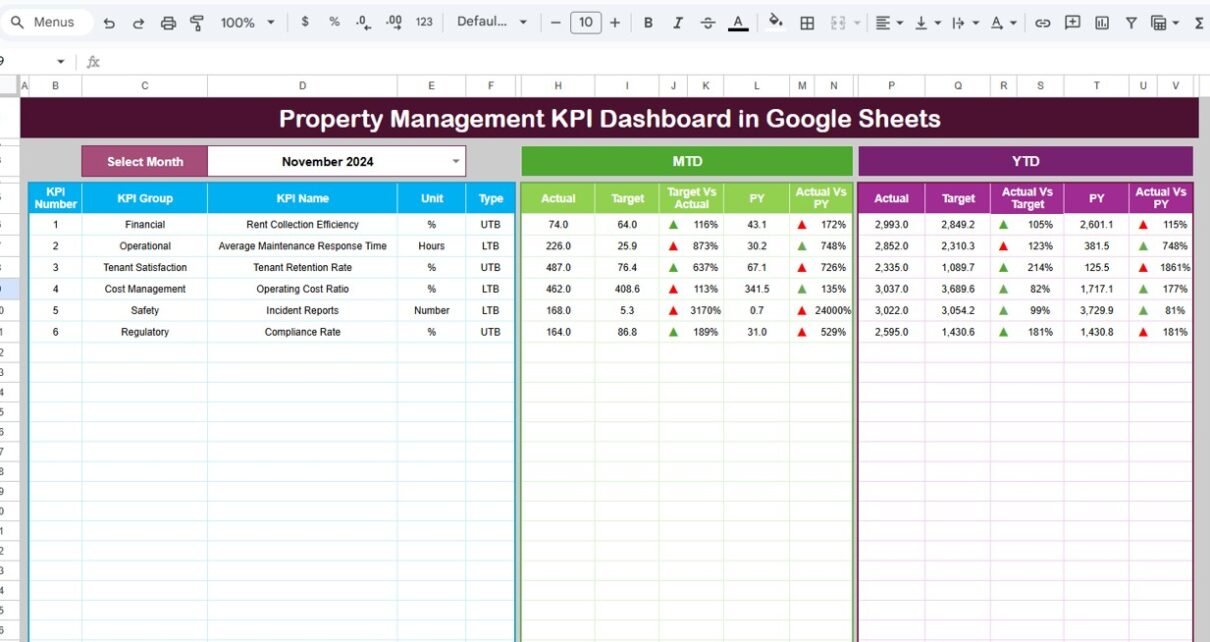
The Dashboard Sheet provides a consolidated overview of all property management KPIs.
🔹 Month Selector
-
Select the month from cell D3
-
All KPIs automatically update based on the selected month
🔹 KPI Comparison Display
MTD (Month-to-Date)
-
Actual
-
Target
-
Previous Year
-
Target vs Actual
-
Previous Year vs Actual
YTD (Year-to-Date)
-
Actual
-
Target
-
Previous Year
-
Target vs Actual
-
Previous Year vs Actual
Conditional formatting with up/down arrows highlights performance improvement or decline.

KPI Trend Sheet Tab
The KPI Trend Sheet allows deep KPI-level analysis.
-
Select the KPI from the dropdown in cell C3
This sheet displays:
-
KPI Group
-
Unit of Measurement
-
KPI Type (Lower the Better / Upper the Better)
-
KPI Formula
-
KPI Definition
-
Month-wise KPI trend

Actual Number Sheet Tab
This sheet captures actual performance data.
-
Select the first month of the year in cell E1
-
Enter MTD and YTD actual values for each KPI
The dashboard updates automatically once data is entered.

Target Sheet Tab
The Target Sheet stores KPI targets.
-
Monthly targets (MTD)
-
Annual targets (YTD)
Targets help align property operations with business goals.

Previous Year Number Sheet Tab
This sheet stores previous year KPI values.
It supports:
-
Year-over-year comparison
-
Seasonal trend analysis
-
Performance benchmarking

KPI Definition Sheet Tab
The KPI Definition Sheet acts as the foundation of the dashboard.
It includes:
- KPI Name
- KPI Group
- Unit
- Formula
- KPI Definition
- KPI Type (LTB / UTB)
This ensures KPI clarity and consistency.

Advantages of Property Management KPI Dashboard
-
Centralized property performance tracking
-
Clear financial visibility
-
Occupancy and vacancy trend analysis
-
Better maintenance cost control
-
Faster decision-making
-
Cost-effective Google Sheets solution
Opportunities for Improvement in Property Management
-
Add unit-level KPI tracking
-
Integrate rent payment systems
-
Track energy and utility efficiency
-
Add predictive vacancy alerts
-
Automate maintenance request imports
Best Practices for Using the Dashboard
-
Update property data regularly
-
Set realistic occupancy and income targets
-
Review maintenance KPIs monthly
-
Compare YoY performance quarterly
-
Share insights with stakeholders
-
Maintain consistent KPI definitions
Conclusion
A Property Management KPI Dashboard in Google Sheets provides a structured, visual, and actionable way to manage properties efficiently. By tracking MTD, YTD, targets, and historical data, property managers gain full control over financial, operational, and tenant performance. Because the dashboard runs in Google Sheets, it stays flexible, collaborative, and easy to maintain.
For property managers focused on maximizing returns and operational efficiency, this dashboard becomes an essential management tool.
For a step-by-step grounding in the reporting skills behind KPI dashboards, see the Excel Pivot Tables & Dashboards course on NextGenTemplates Academy, which comes with practice files.
Get the Property Management KPI Dashboard in Google Sheets
Frequently Asked Questions (FAQs)
1. Who should use this dashboard?
Property owners, real estate managers, and facility teams.
2. Can it manage multiple properties?
Yes, with property-level data structure.
3. Is the dashboard customizable?
Yes, KPIs, targets, and charts are editable.
4. Does it support YoY comparison?
Yes, using the Previous Year sheet.
5. Is Google Sheets secure?
Yes, with role-based access control.
6. Does it require technical skills?
No, basic Google Sheets knowledge is enough.