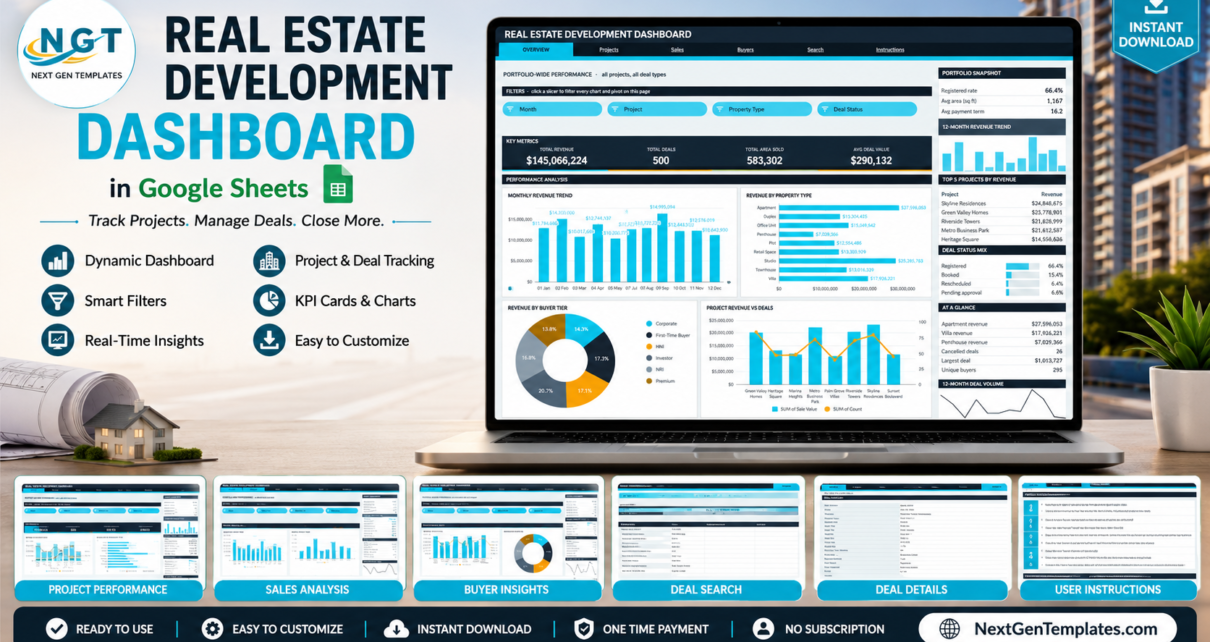
A six-page property development dashboard built on native Google Sheets pivot tables and slicers: 16 KPI cards, 16 charts, revenue per square foot, booking-type and agent analysis, plus a deal lookup page.
Online Tutorial for Data Analysis and Automation
A six-page property development dashboard built on native Google Sheets pivot tables and slicers: 16 KPI cards, 16 charts, revenue per square foot, booking-type and agent analysis, plus a deal lookup page.
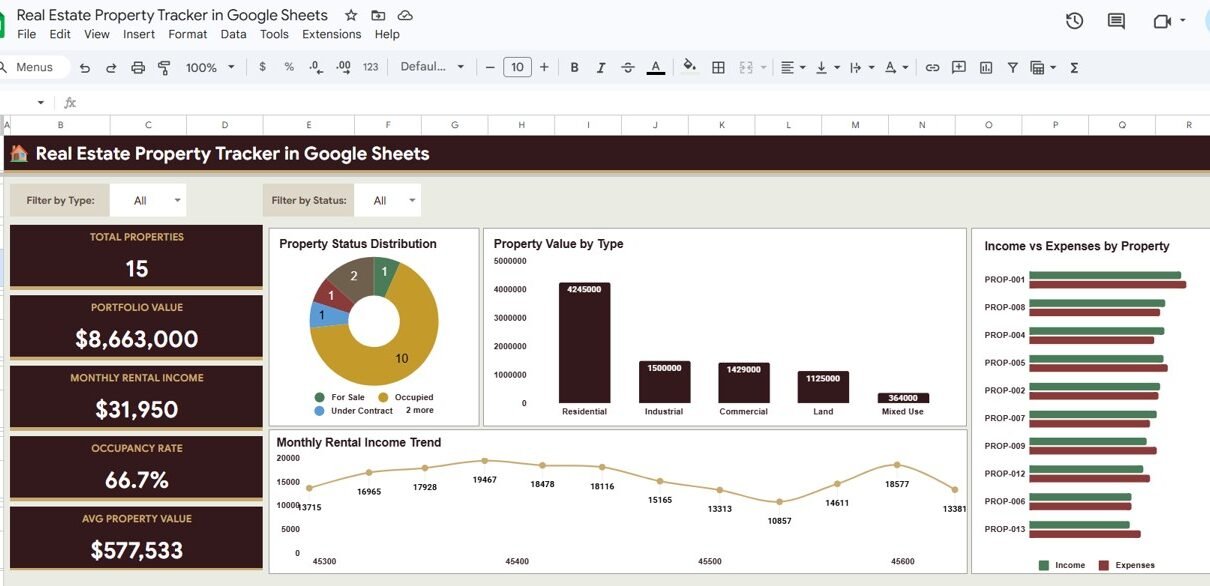
Track properties, tenants, income, expenses, and maintenance in one Google Sheets tracker with 7 pages, 14+ charts, slicer filters, an investment calculator, and instant property search.
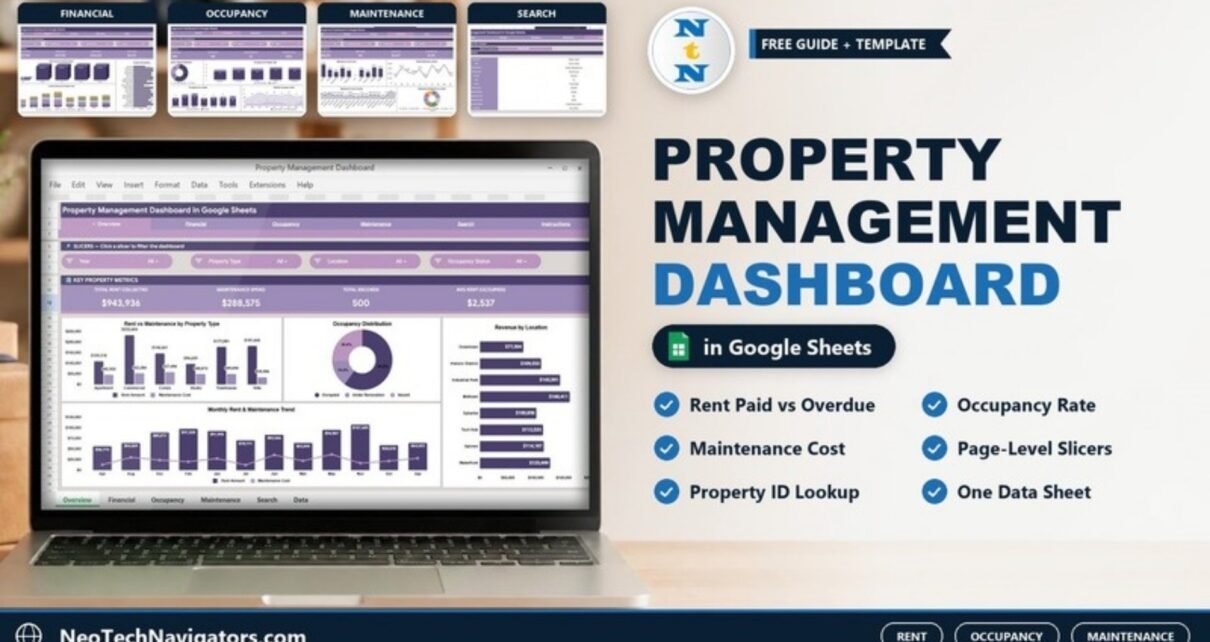
A Google Sheets property management dashboard with Overview, Financial, Occupancy and Maintenance pages, page-level slicers, a Property ID lookup and one Data sheet for rent, occupancy and repair records.
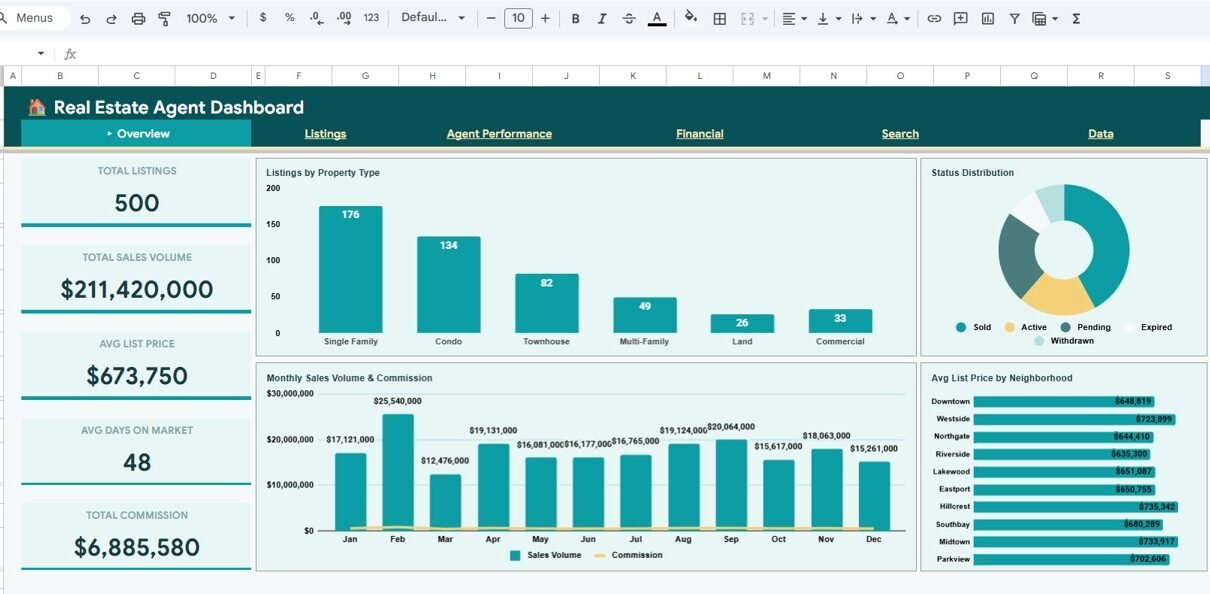
Track listings, agent performance, commissions, and financial KPIs with the Real Estate Agent Dashboard in Google Sheets. 6 interactive pages with auto-updating charts and a search sheet.
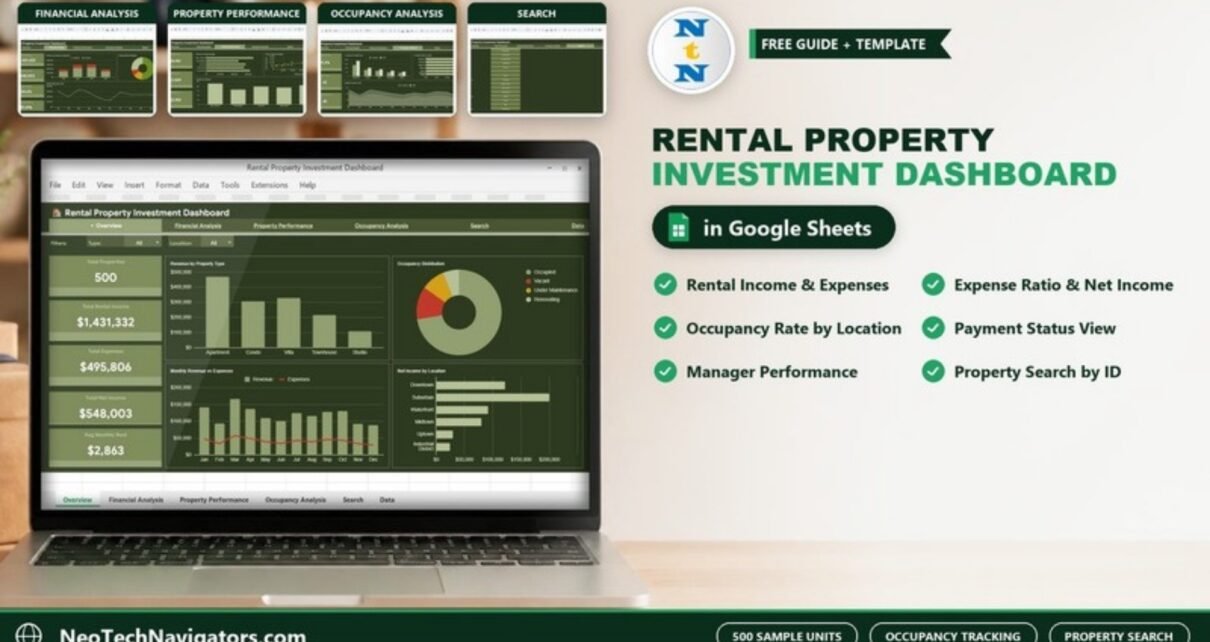
A page-by-page guide to the Rental Property Investment Dashboard in Google Sheets: rental income, expense ratio, net income, occupancy, payment status and manager performance, with KPI formulas and setup steps.
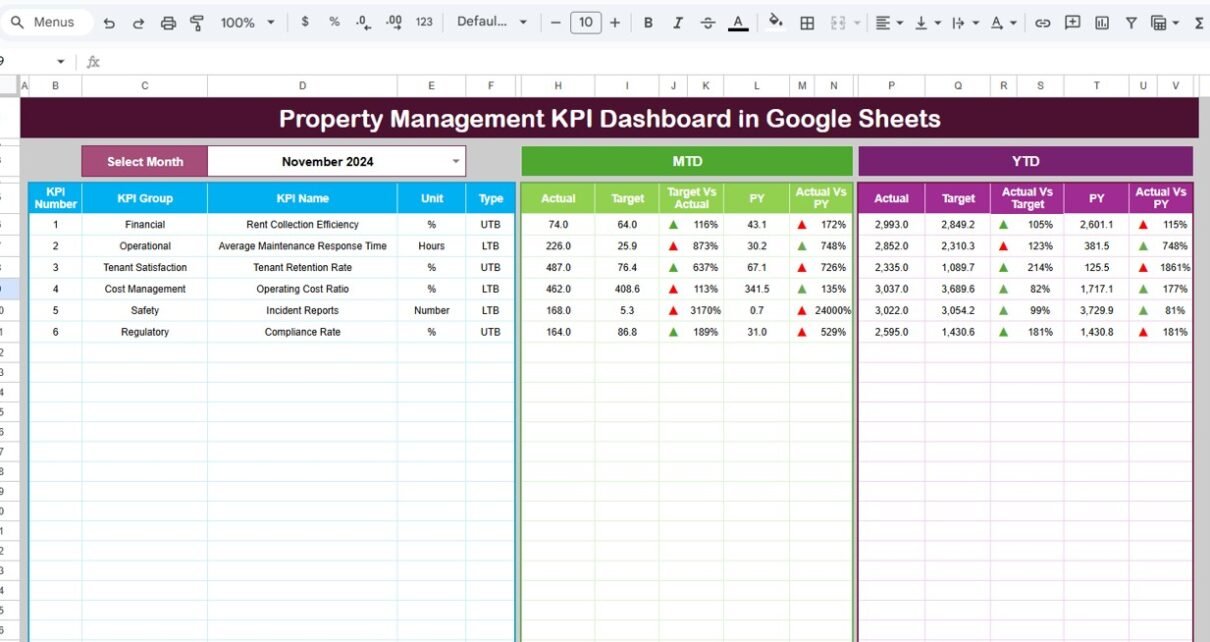
Managing residential or commercial properties involves tracking occupancy, rental income, expenses, maintenance efficiency, and tenant performance. However, many property managers still rely on scattered spreadsheets, manual calculations, and static reports. As a result, visibility reduces and decision-making slows down.Property Management KPI Dashboard in Google Sheets That is exactly where a Property Management KPI Dashboard in […]