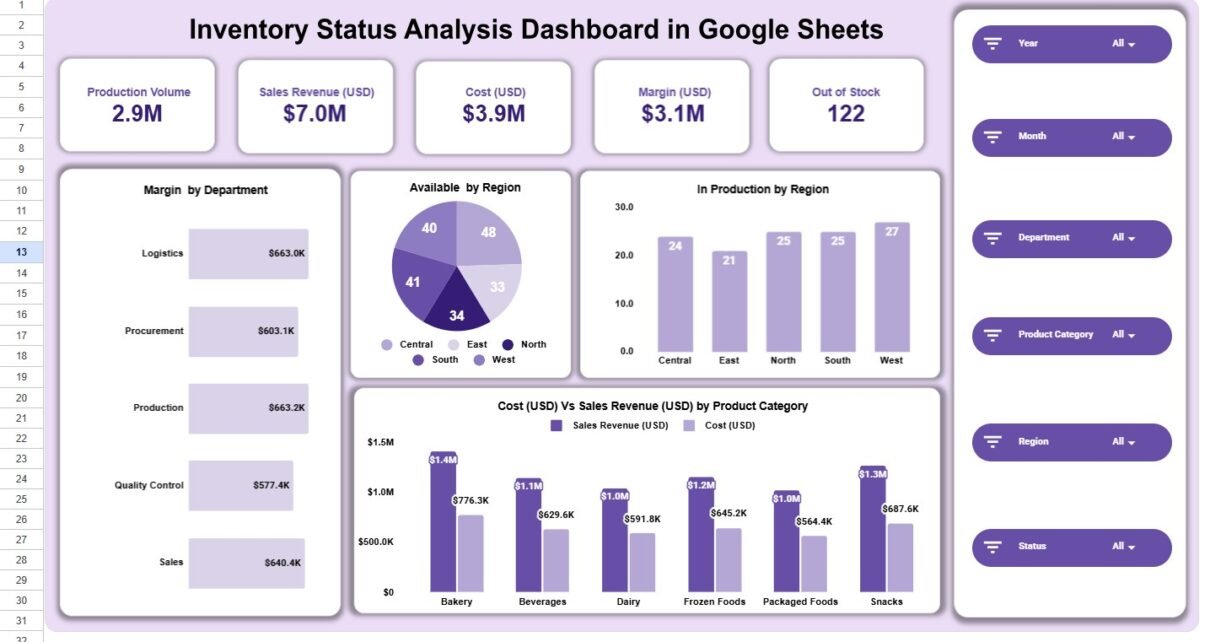
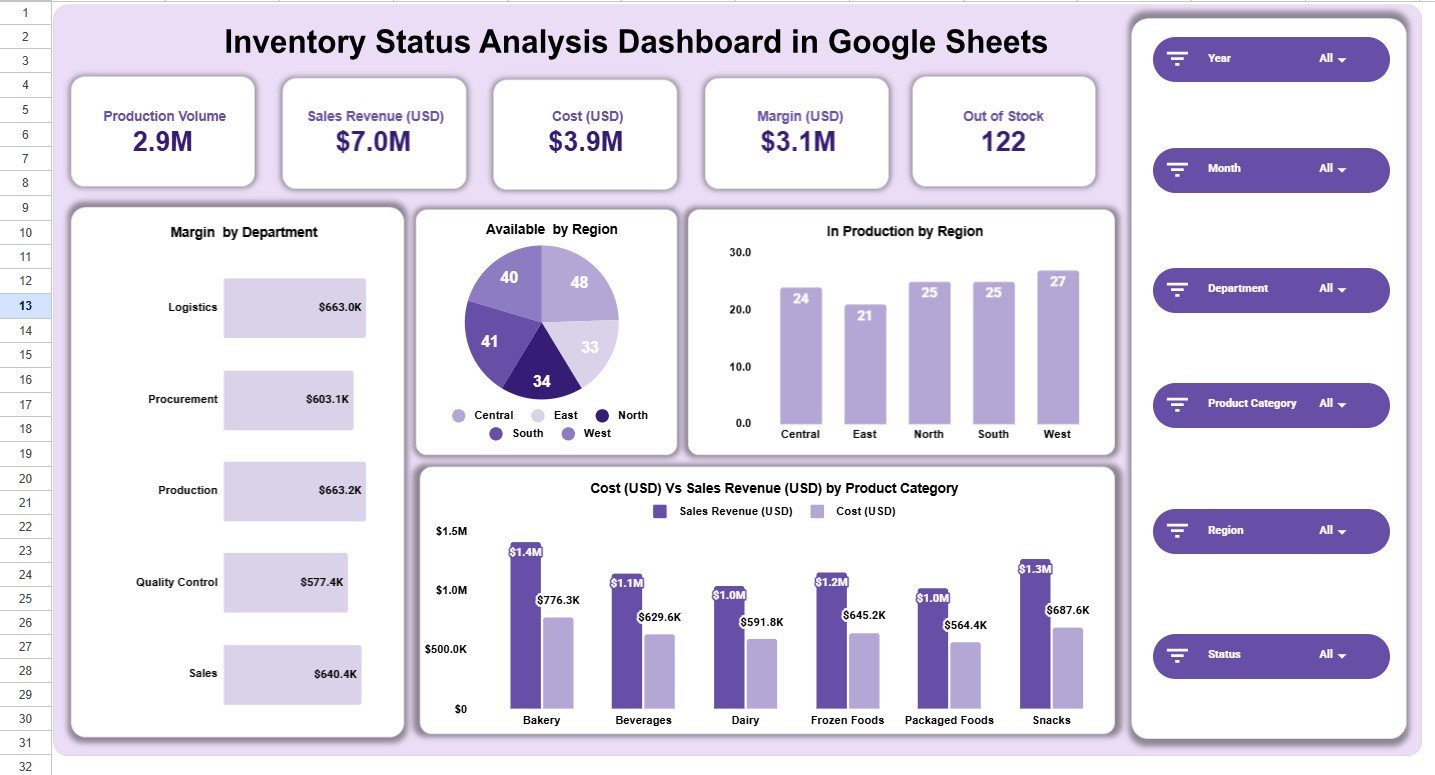
The Inventory Status Analysis Dashboard in Google Sheets is built for managers who need a fast answer to a practical question: what is available, what is in production, where costs are rising, and which products or regions need attention? In the sample dashboard, the top cards show 2.9M production volume, $7.0M sales revenue, $3.9M cost, $3.1M margin, and 122 out-of-stock items. Those five numbers alone give an inventory team a cleaner starting point than a raw spreadsheet with hundreds of rows.Inventory Status Analysis Dashboard in Google Sheets
This Google Sheets inventory dashboard is designed around daily operational review. Instead of switching between separate worksheets for production, stock status, sales, region, department, and month, the template brings those views into one structured reporting file. The dashboard includes overview reporting, region analysis, department analysis, product category analysis, monthly trends, and a data sheet that can be replaced with your own inventory records.Inventory Status Analysis Dashboard in Google Sheets
Download the Inventory Status Analysis Dashboard in Google Sheets from NextGenTemplates.
Key Features of Inventory Status Analysis Dashboard in Google Sheets
- Executive inventory overview: Track production volume, sales revenue, cost, margin, and out-of-stock count from one top-level dashboard page.
- Six slicer-style filters: Filter the dashboard by Year, Month, Department, Product Category, Region, and Status.
- Region analysis: Compare available stock, sales revenue, cost, and in-production quantity across Central, East, North, South, and West.
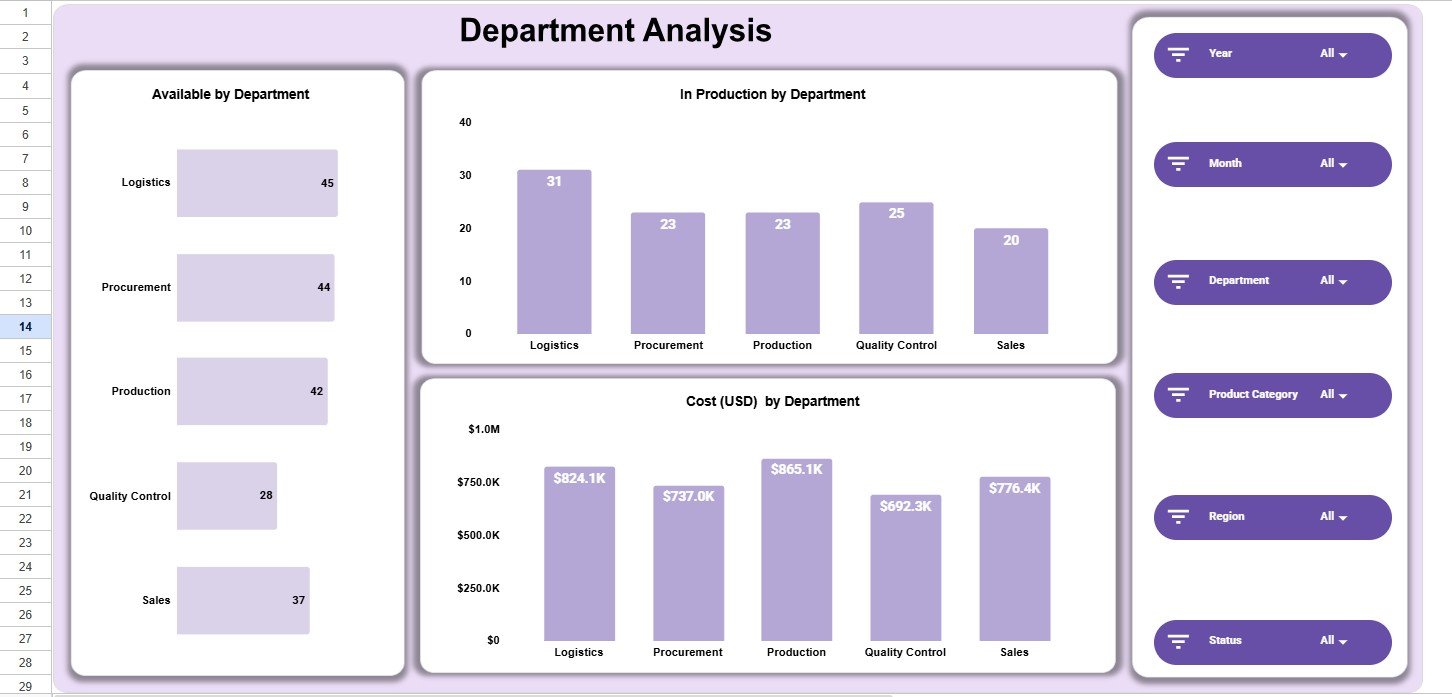
- Department analysis: Review Logistics, Procurement, Production, Quality Control, and Sales with availability, production, and cost views.
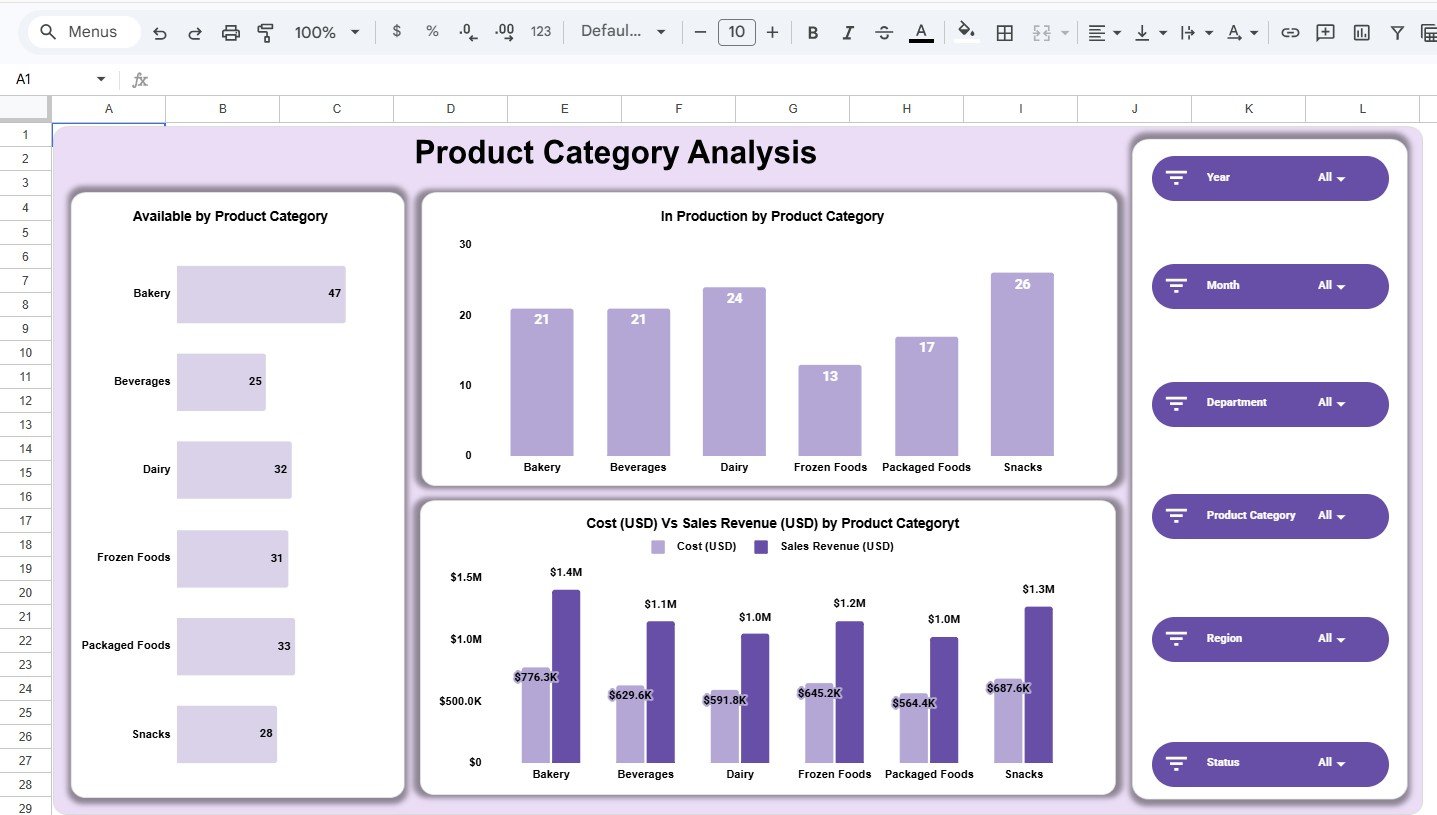
- Product category analysis: Compare Bakery, Beverages, Dairy, Frozen Foods, Packaged Foods, and Snacks by availability, production, cost, and sales revenue.
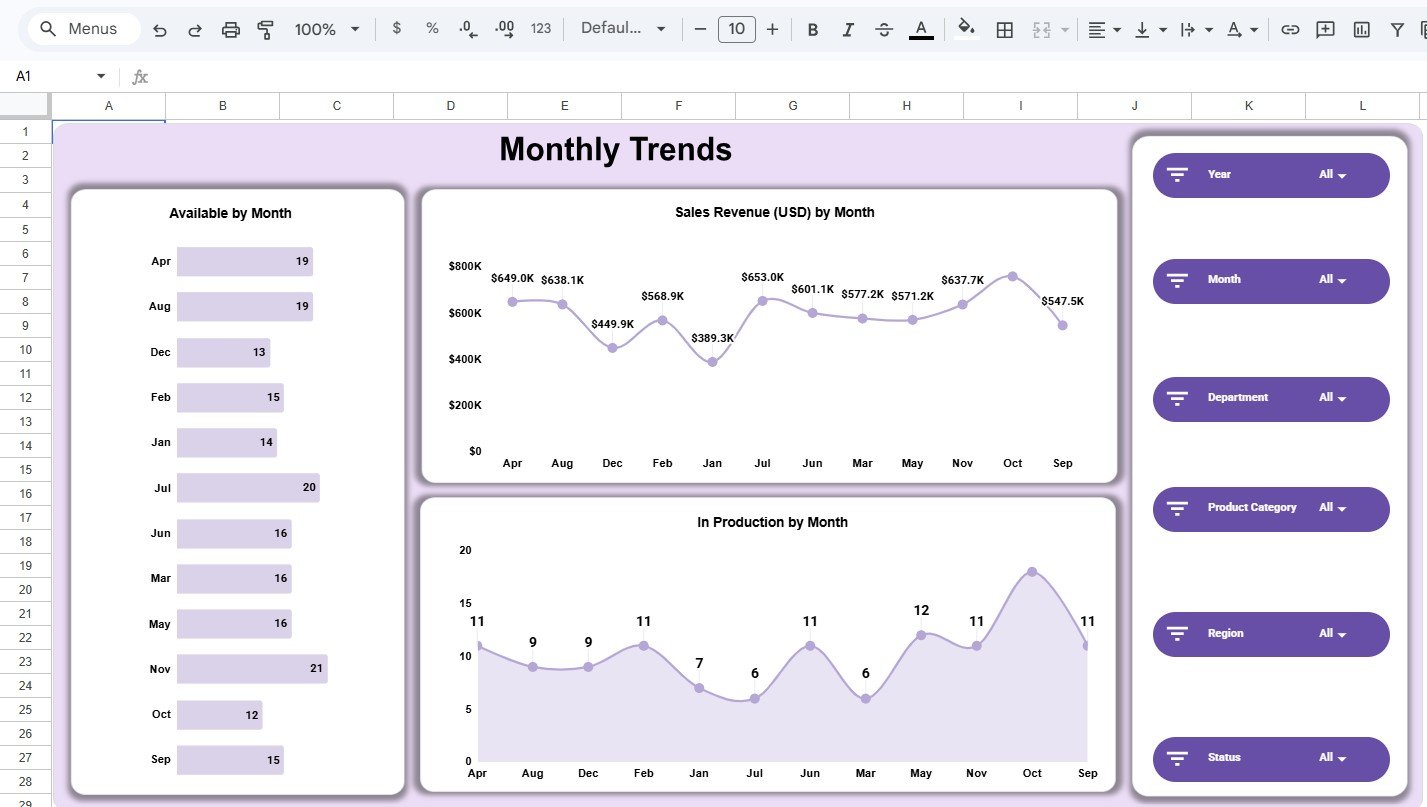
- Monthly trends: Monitor sales revenue and in-production movement by month for planning and performance reviews.
- Editable data sheet: Replace sample rows with your own structured inventory data while keeping the same column layout.
Because the file is built in Google Sheets, it can be copied to Google Drive, shared with team members, and reviewed in a browser. Google also maintains official guidance for using filters and slicers in Google Sheets, which is useful when you want to adapt the reporting experience for your own team.
Dashboard Pages Explanation
1. Overview Dashboard
The Overview Dashboard is the main decision page. It shows KPI cards for Production Volume, Sales Revenue, Cost, Margin, and Out of Stock. Below the cards, charts show Margin by Department, Available by Region, In Production by Region, and Cost versus Sales Revenue by Product Category.
This page is useful for weekly operations meetings because it combines financial and stock-status indicators. A manager can quickly see whether the biggest categories are also carrying high cost, whether any region has fewer available items, and whether out-of-stock pressure is becoming visible.
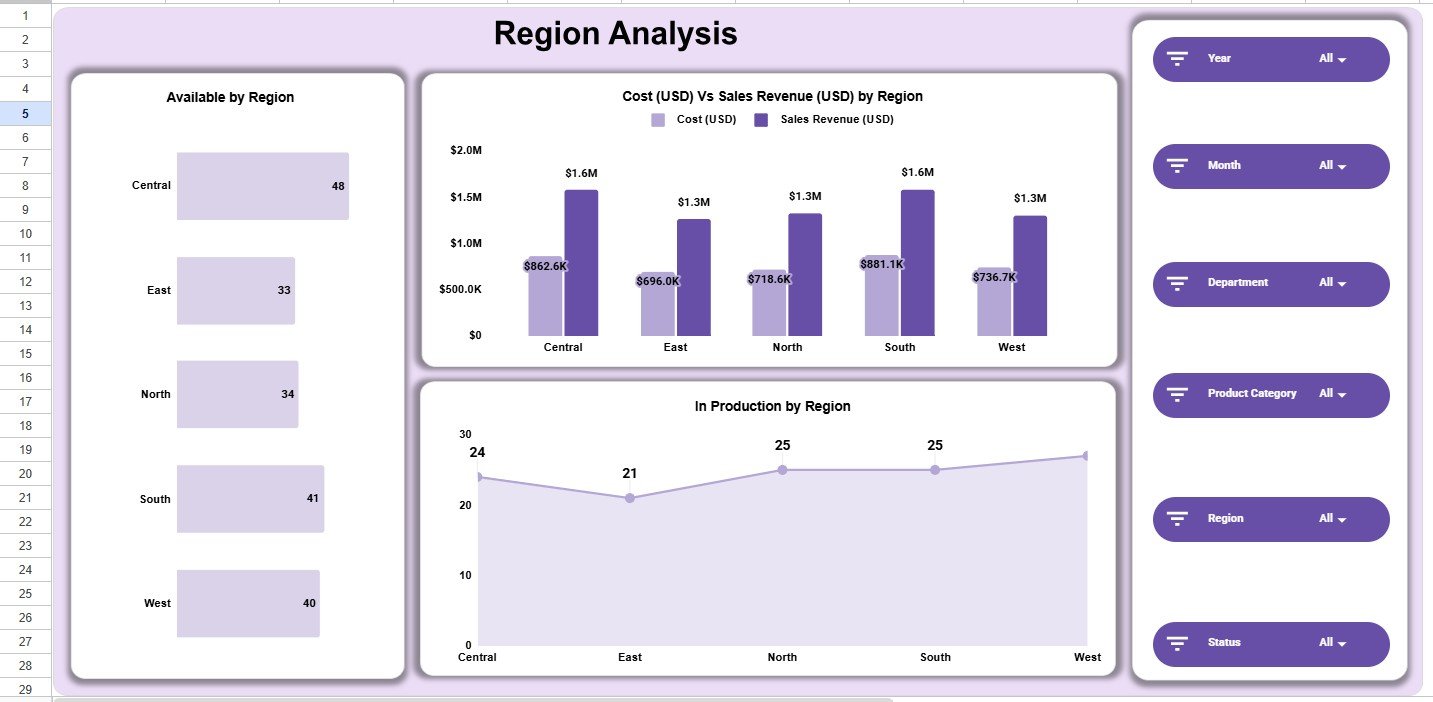
2. Region Analysis
The Region Analysis page focuses on Central, East, North, South, and West. It includes Available by Region, Cost versus Sales Revenue by Region, and In Production by Region. This helps teams compare where inventory is physically or operationally strongest and where production may need follow-up.
Download the Inventory Status Analysis Dashboard in Google Sheets
3. Department Analysis
The Department Analysis page compares Logistics, Procurement, Production, Quality Control, and Sales. It shows available inventory by department, in-production quantity by department, and cost by department. This is helpful when different teams are responsible for different parts of the inventory workflow.Inventory Status Analysis Dashboard in Google Sheets
4. Product Category Analysis
The Product Category Analysis page reviews Bakery, Beverages, Dairy, Frozen Foods, Packaged Foods, and Snacks. It includes available quantity, in-production count, and cost versus sales revenue by product category. This page is especially useful for food, retail, consumer goods, and warehouse teams that need category-level visibility.Inventory Status Analysis Dashboard in Google Sheets
Download the Inventory Status Analysis Dashboard in Google Sheets
5. Monthly Trends
The Monthly Trends page shows available inventory by month, sales revenue by month, and in-production quantity by month. This page supports month-end reporting, seasonal planning, and production trend review. It is also helpful for spotting months where revenue is strong but production movement or availability needs attention.Inventory Status Analysis Dashboard in Google Sheets
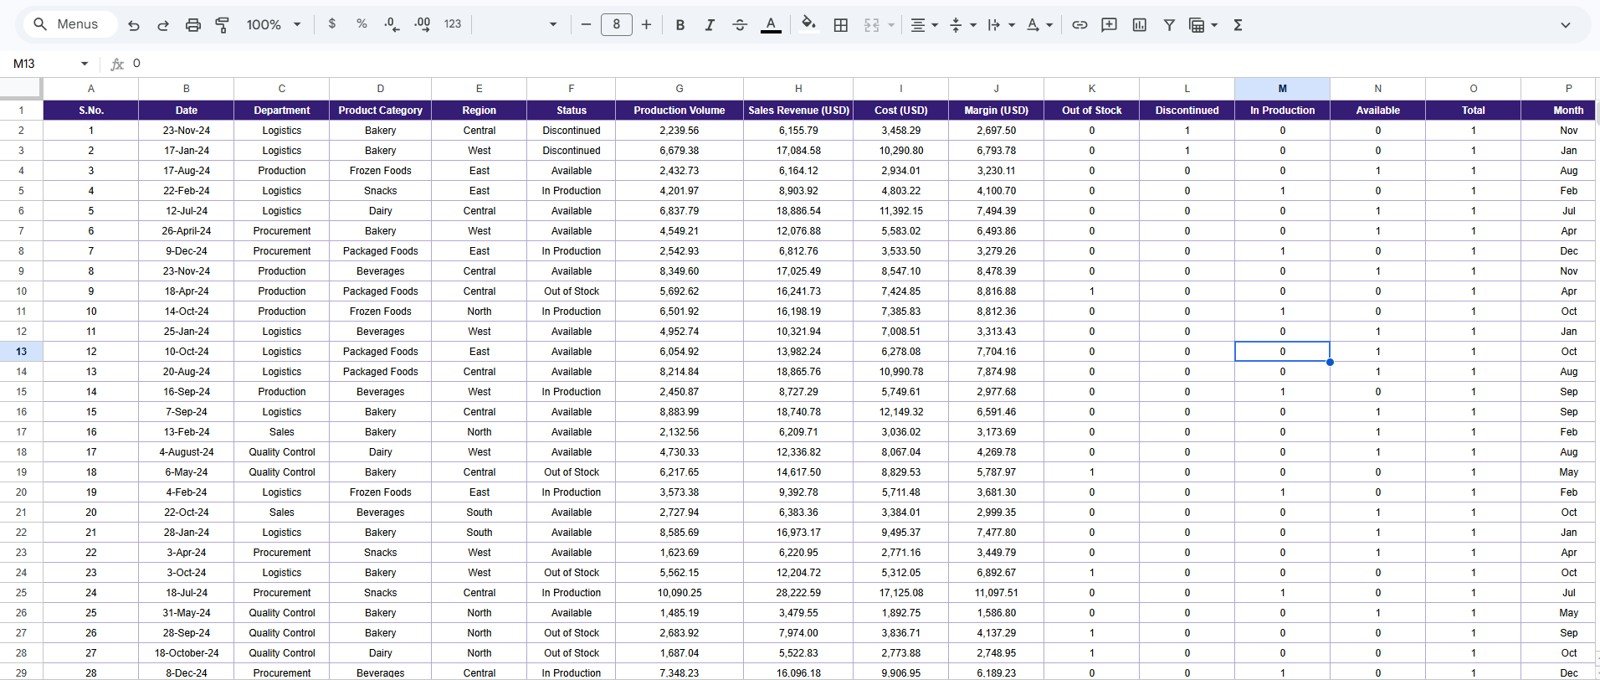
6. Data Sheet
The Data Sheet is the source table for the dashboard. It includes S.No., Date, Department, Product Category, Region, Status, Production Volume, Sales Revenue, Cost, Margin, Out of Stock, Discontinued, In Production, Available, Total, and Month. Replace the sample rows with your own inventory records and keep the same structure so the dashboard remains connected.Inventory Status Analysis Dashboard in Google Sheets
Inventory Status Analysis Dashboard in Google Sheets vs. Microsoft Excel vs. Paid Inventory SaaS – Feature Comparison
Download the Inventory Status Analysis Dashboard in Google Sheets
| Feature | Inventory Status Dashboard in Google Sheets | Microsoft Excel Dashboard | Paid Inventory SaaS |
|---|---|---|---|
| Cost | $9.99 one-time | Template cost plus Microsoft access | Monthly subscription |
| Platform | Google Sheets in browser | Excel desktop or web | Vendor-hosted system |
| Setup time | Copy file and replace data | Open workbook and replace data | Configuration and onboarding |
| Real-time collaboration | Native Google Drive sharing | Possible with OneDrive | Built in |
| Mobile access | Google Sheets app | Excel app | Vendor app |
| Custom fields | Editable sheet columns | Editable workbook | Depends on plan |
| Year-1 cost at 5 users | $9.99 total | Template cost plus licenses | Often hundreds to thousands of dollars |
| Inventory status reporting | Built around status, region, department, and category | Depends on workbook design | Usually included |
This template fits teams that want structured inventory status reporting without the cost or setup time of a full SaaS platform. It is not an ERP, but it is a practical reporting layer for teams already maintaining spreadsheet-based inventory data.
Who Should Use This Template
- Warehouse managers who need a quick overview of stock status and regional availability.
- Procurement teams that want to review out-of-stock signals before placing replenishment orders.
- Production planners who need to monitor in-production quantities across departments and categories.
- Food and beverage teams tracking categories such as Bakery, Beverages, Dairy, Frozen Foods, Packaged Foods, and Snacks.
- Small businesses that want Google Sheets reporting before investing in inventory software.
This is not the best fit for teams that need barcode scanning, real-time stock sync, purchase-order automation, accounting integration, or enterprise audit controls. Those needs usually require a web app, ERP module, or inventory SaaS.
Real-World Use Cases
Maria manages a regional warehouse network. She uses the Overview and Region Analysis pages every Monday to check available stock and out-of-stock pressure before talking to replenishment teams.
Daniel leads production planning for a packaged food company. He reviews Product Category Analysis to see which categories are in production, how cost compares with sales revenue, and where margin needs attention.
Aisha supports monthly operations reporting. She updates the Data Sheet with fresh records, uses the Monthly Trends page for management slides, and shares the Google Sheets file with the procurement team.
Advantages of Inventory Status Analysis Dashboard in Google Sheets
Download the Inventory Status Analysis Dashboard in Google Sheets
- Fast visibility: The top dashboard page gives five headline KPIs before anyone opens the data table.
- Operational structure: Pages are organized by region, department, product category, and month, matching common review workflows.
- Low ownership cost: The template is a one-time purchase instead of a recurring SaaS subscription.
- Shareable format: Google Sheets makes the file easy to copy, share, comment on, and review from a browser.
- Editable source data: The Data Sheet can be adapted as long as the core dashboard fields are preserved.
Opportunities for Improvement
The template uses manual or pasted data, so it does not automatically sync from ERP, POS, Shopify, Amazon, barcode scanners, or accounting tools. If your inventory changes minute by minute, you may need an automated connector or a custom Google Apps Script workflow. The dashboard is also designed for reporting, not transaction processing, so it does not create purchase orders or enforce stock movement approvals.
Best Practices
- Keep department and region names consistent so charts group records correctly.
- Update the Data Sheet on a fixed schedule, such as weekly or month-end, to keep trend analysis meaningful.
- Use the Status field consistently for Available, In Production, Out of Stock, and Discontinued items.
- Review out-of-stock count alongside sales revenue so fast-moving categories are not missed.
- Make a backup copy before changing formulas, chart ranges, or sheet structure.
Explore Relevant Templates
If you need a broader inventory reporting file, see the Inventory Management Dashboard in Google Sheets. For a more app-like inventory workflow, review the Web-based Advanced Inventory Management System. For stock across multiple locations, the Multi-Location Inventory Management in Google Sheets is also relevant.
You can also browse the Google Sheets Dashboard category and the Inventory Management templates category on NextGenTemplates.
Frequently Asked Questions
Download the Inventory Status Analysis Dashboard in Google Sheets
Is the Inventory Status Analysis Dashboard built in Google Sheets?
Yes. The dashboard is built for Google Sheets. After purchase, use the included guide to create your own editable copy in Google Drive.
What pages are included?
The template includes an Overview Dashboard, Region Analysis, Department Analysis, Product Category Analysis, Monthly Trends, and Data Sheet.
What KPIs does the overview page show?
The overview page shows Production Volume, Sales Revenue, Cost, Margin, and Out of Stock. The sample dashboard displays 2.9M production volume, $7.0M revenue, $3.9M cost, $3.1M margin, and 122 out-of-stock items.
Can I use my own product categories?
Yes. Replace the sample categories in the Data Sheet with your own categories, then keep naming consistent so the charts group records properly.
Does this dashboard support filters?
Yes. It includes slicer-style filters for Year, Month, Department, Product Category, Region, and Status.
Can this replace inventory management software?
It can replace manual reporting for many teams, but it does not replace inventory software features such as barcode scanning, transaction approvals, purchase orders, or automatic integrations.
About the Author
Built by PK – Microsoft Certified Professional with 15+ years of Excel, Google Sheets, and Power BI experience. Founder of NextGenTemplates, reaching 300K+ subscribers across YouTube channels. Every template is hand-built and tested before release.
Conclusion
The Inventory Status Analysis Dashboard in Google Sheets gives inventory teams a clean way to review stock status, production, cost, margin, out-of-stock items, regions, departments, product categories, and monthly movement without building a report from scratch.
Download the Inventory Status Analysis Dashboard in Google Sheets and start turning raw inventory records into a more useful operating view.
For more spreadsheet and automation tutorials, visit YouTube.com/@NeoTechNavigators.
Last updated: June 13, 2026.