Campaign reporting becomes harder when revenue, leads, conversions, cost, department ownership, and channel activity live in separate exports. The Channel Performance Analytics Dashboard in Google Sheets is built to solve that reporting gap with 5 headline KPI cards, 20 chart views, 5 analysis pages, a Search sheet, and a structured Data sheet. Instead of manually rebuilding campaign reports every week, teams can update the data table and review campaign progress by channel, campaign name, department, and month.Channel Performance Analytics Dashboard in Google Sheets
This template is useful for marketing teams, agencies, founders, and department leaders who need campaign visibility without paying for a full SaaS reporting stack. It runs inside Google Sheets, supports team sharing through Google Drive, and uses slicer-style filtering for quick analysis. Google also documents slicers as a native way to filter charts and tables in Sheets, which makes this format practical for shared dashboard work. See Google’s official help page on filtering charts and tables with slicers.
Click here to view the Channel Performance Analytics Dashboard in Google Sheets product page.
Key Features of Channel Performance Analytics Dashboard in Google Sheets
- 5 KPI cards: Total Campaigns, Revenue (USD), Leads Generated, Conversions, and Cost (USD).
- 20 chart views: Completed, In Progress, Revenue, and Conversions across key business dimensions.
- Interactive slicers: Quickly filter dashboard views without editing formulas.Channel Performance Analytics Dashboard in Google Sheets
- Channel Analysis page: Compare performance by marketing or sales channel.
- Campaign Analysis page: See which campaigns are active, completed, high revenue, or conversion-heavy.
- Department Analysis page: Compare department contribution and campaign workload.
- Monthly Trends page: Review campaign movement over time.
- Search sheet: Select a column, type a keyword, and return matching records with a total record count.
- Data sheet: Add your own records in the same format to keep the dashboard updating.Channel Performance Analytics Dashboard in Google Sheets
Dashboard Pages Explanation
Page 1: Overview Page
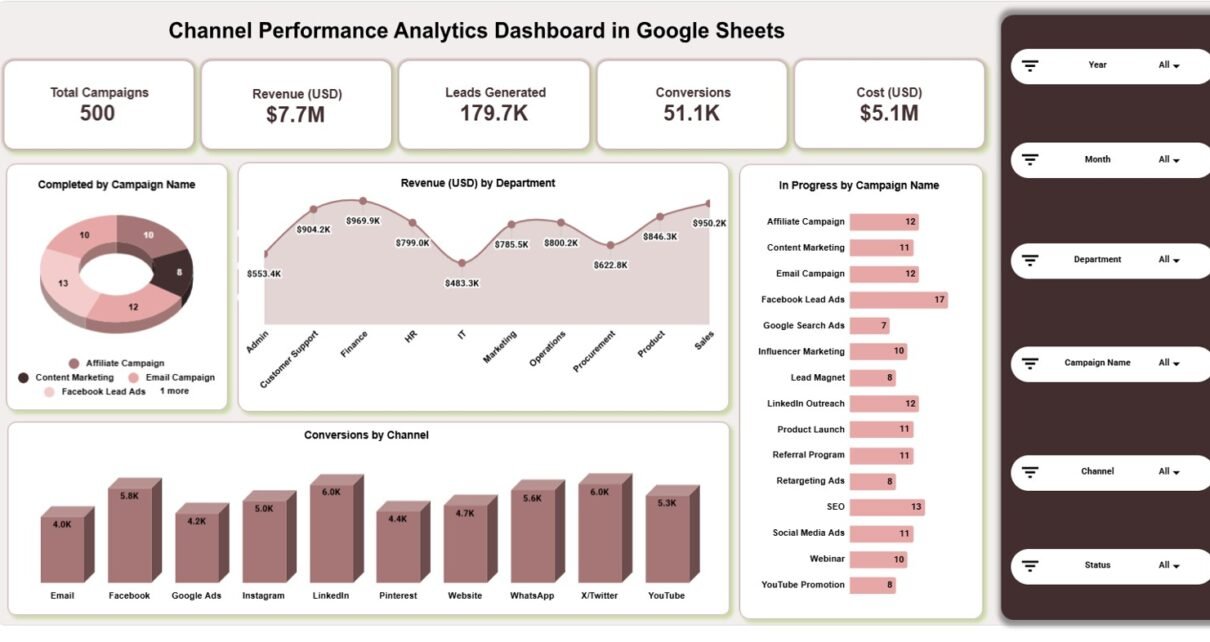
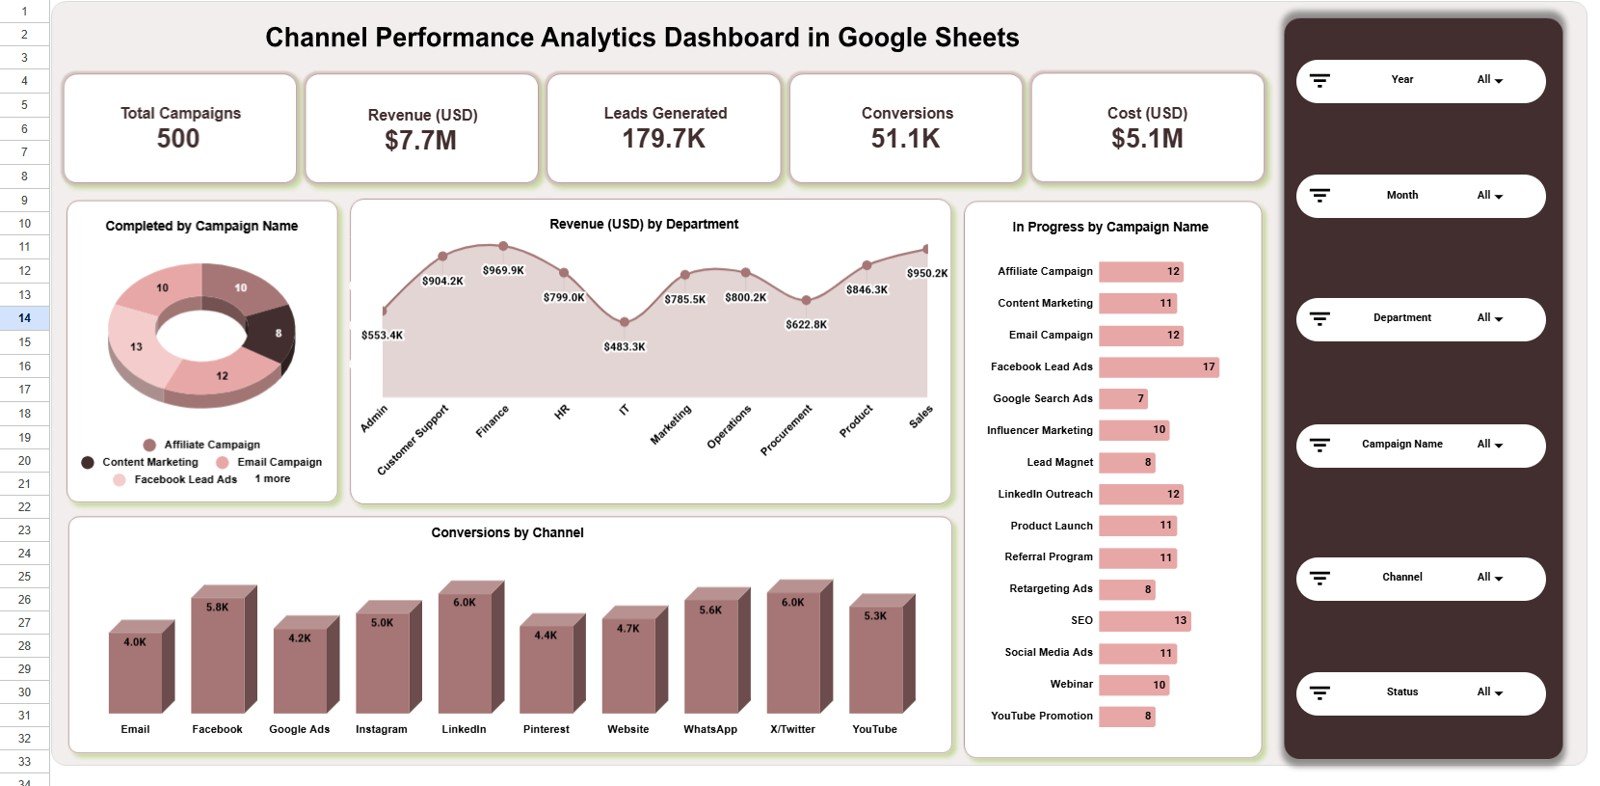
The Overview page shows the high-level story of the dashboard. At the top, it displays Total Campaigns, Revenue (USD), Leads Generated, Conversions, and Cost (USD). These cards help managers quickly understand whether campaign volume, financial return, lead creation, conversion activity, and spending are moving in the right direction.Channel Performance Analytics Dashboard in Google Sheets
The page also includes four charts: Completed by Campaign Name, Revenue (USD) by Department, In Progress by Campaign Name, and Conversions by Channel. Completed by Campaign Name helps identify finished campaigns and closed activity. Revenue (USD) by Department shows which departments are contributing the most campaign revenue. In Progress by Campaign Name highlights open workload. Conversions by Channel reveals which channels are producing the strongest outcomes.Channel Performance Analytics Dashboard in Google Sheets
Page 2: Channel Analysis
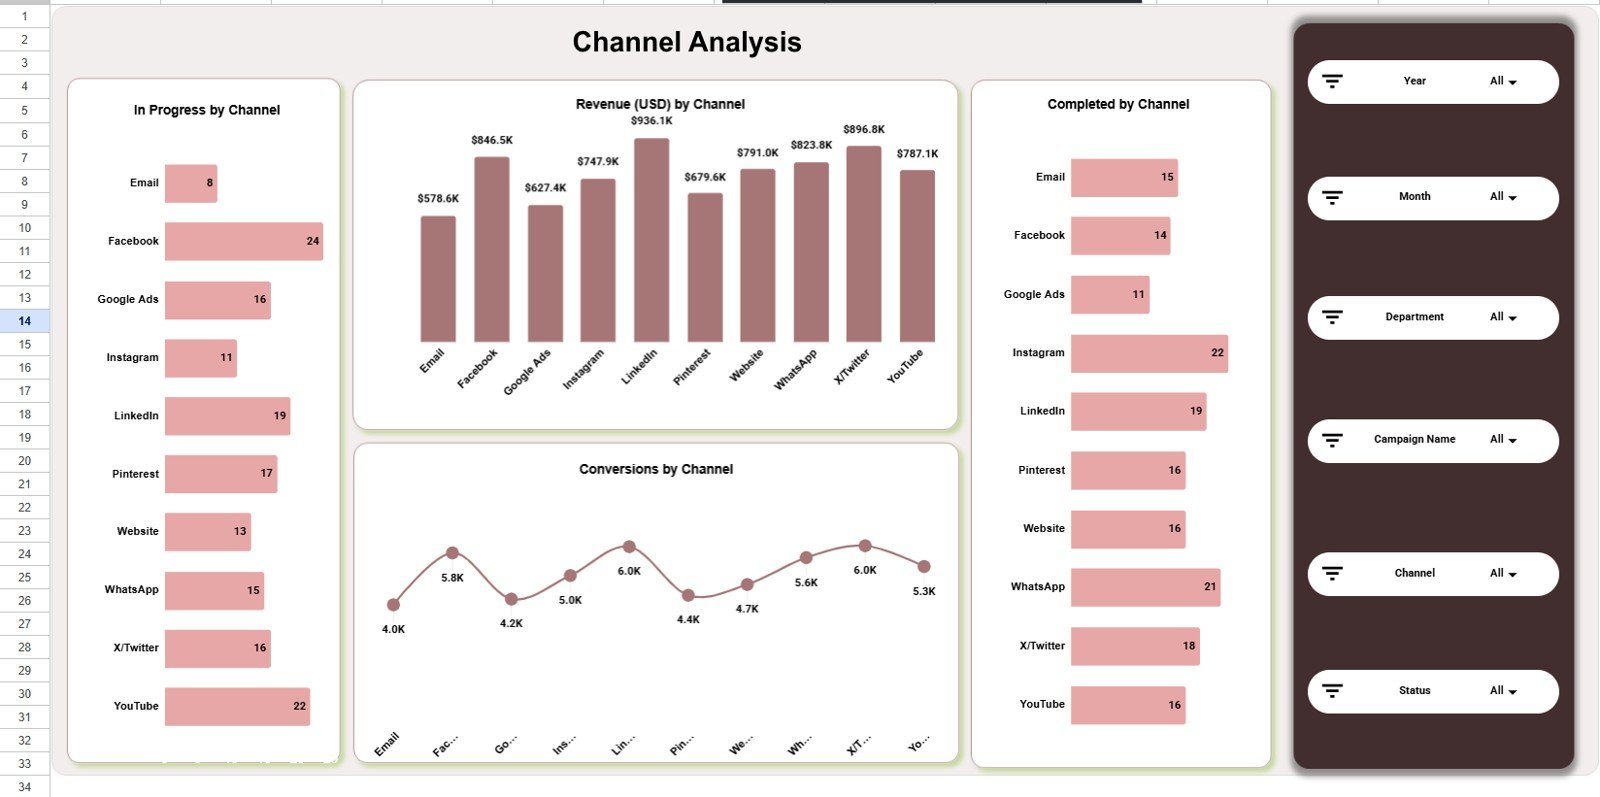
The Channel Analysis tab focuses on channel-level performance. It includes In Progress by Channel, Revenue (USD) by Channel, Completed by Channel, and Conversions by Channel. This helps teams compare which channels are still carrying active work, which ones produce more completed campaigns, and which ones generate more conversion volume.Channel Performance Analytics Dashboard in Google Sheets
For a marketing team, this page can answer practical questions: Are paid channels creating more conversions than organic channels? Is one channel carrying too many in-progress campaigns? Are completed campaigns matching revenue contribution?Channel Performance Analytics Dashboard in Google Sheets
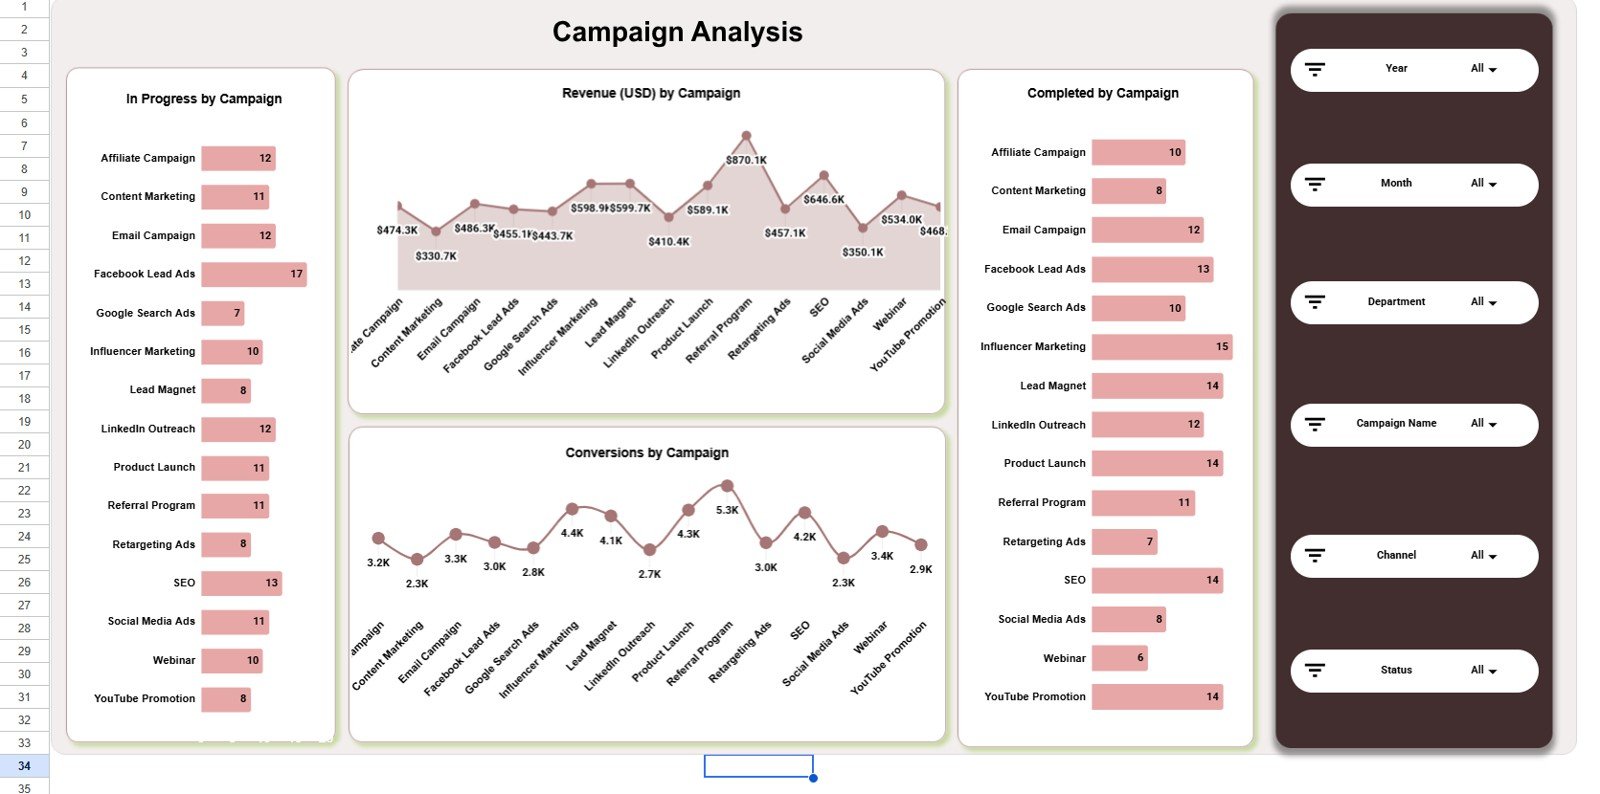
Page 3: Campaign Analysis
The Campaign Analysis tab shows In Progress by Campaign, Revenue (USD) by Campaign, Completed by Campaign, and Conversions by Campaign. It is built for campaign owners who need to compare individual campaigns rather than only channels or departments.Channel Performance Analytics Dashboard in Google Sheets
This page is useful when a team needs to decide which campaign deserves more budget, which campaign should be closed, and which campaign is producing conversion output without matching revenue.Channel Performance Analytics Dashboard in Google Sheets
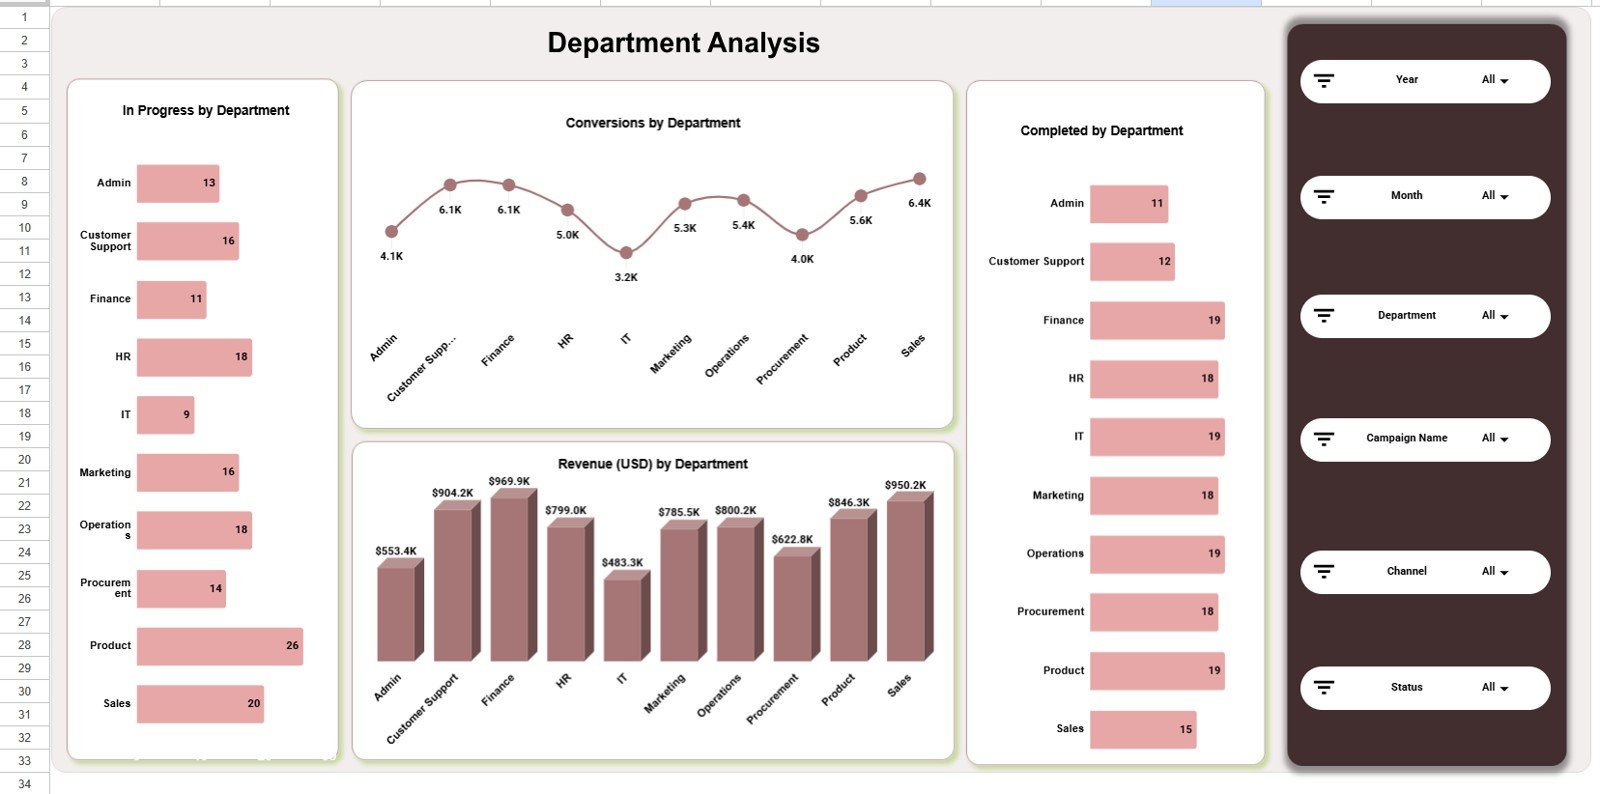
Page 4: Department Analysis
The Department Analysis tab reviews In Progress by Department, Conversions by Department, Completed by Department, and Revenue (USD) by Department. It gives leaders a simple way to see which departments own active work, which departments are completing campaigns, and where revenue is being generated.
Use this page during department review meetings, marketing operations reviews, or leadership updates where campaign ownership and business contribution need to be visible side by side.
Channel Performance Analytics Dashboard in Google Sheets product page.
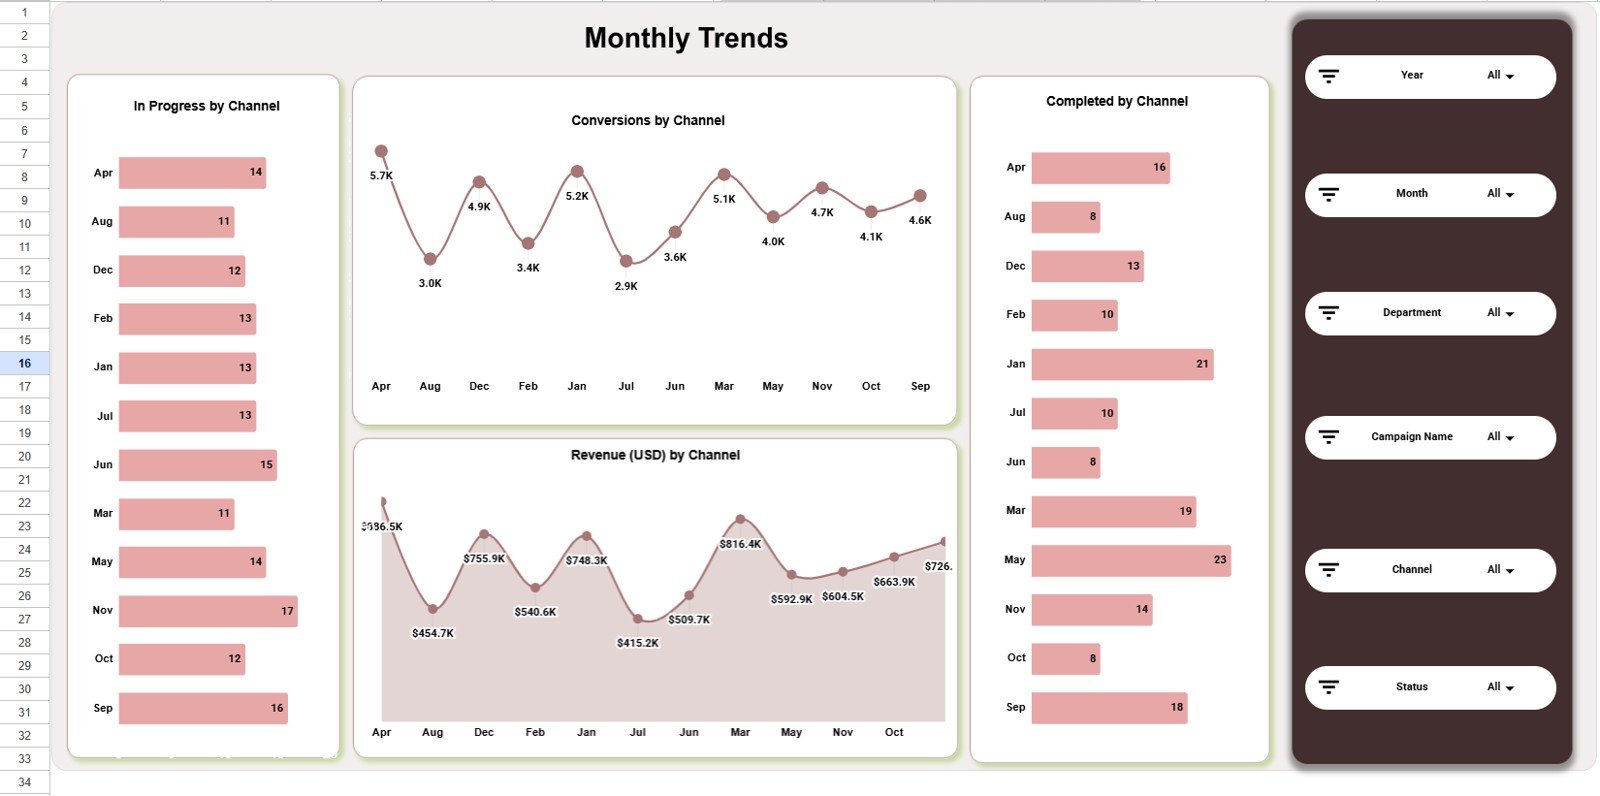
Page 5: Monthly Trends
The Monthly Trends tab includes In Progress by Month, Conversions by Month, Completed by Month, and Revenue (USD) by Month. This page helps teams understand whether campaign activity is growing, slowing, or becoming seasonal.
Monthly trend analysis is helpful for planning next-month budget, setting realistic campaign targets, and comparing revenue movement against work-in-progress and completion patterns.
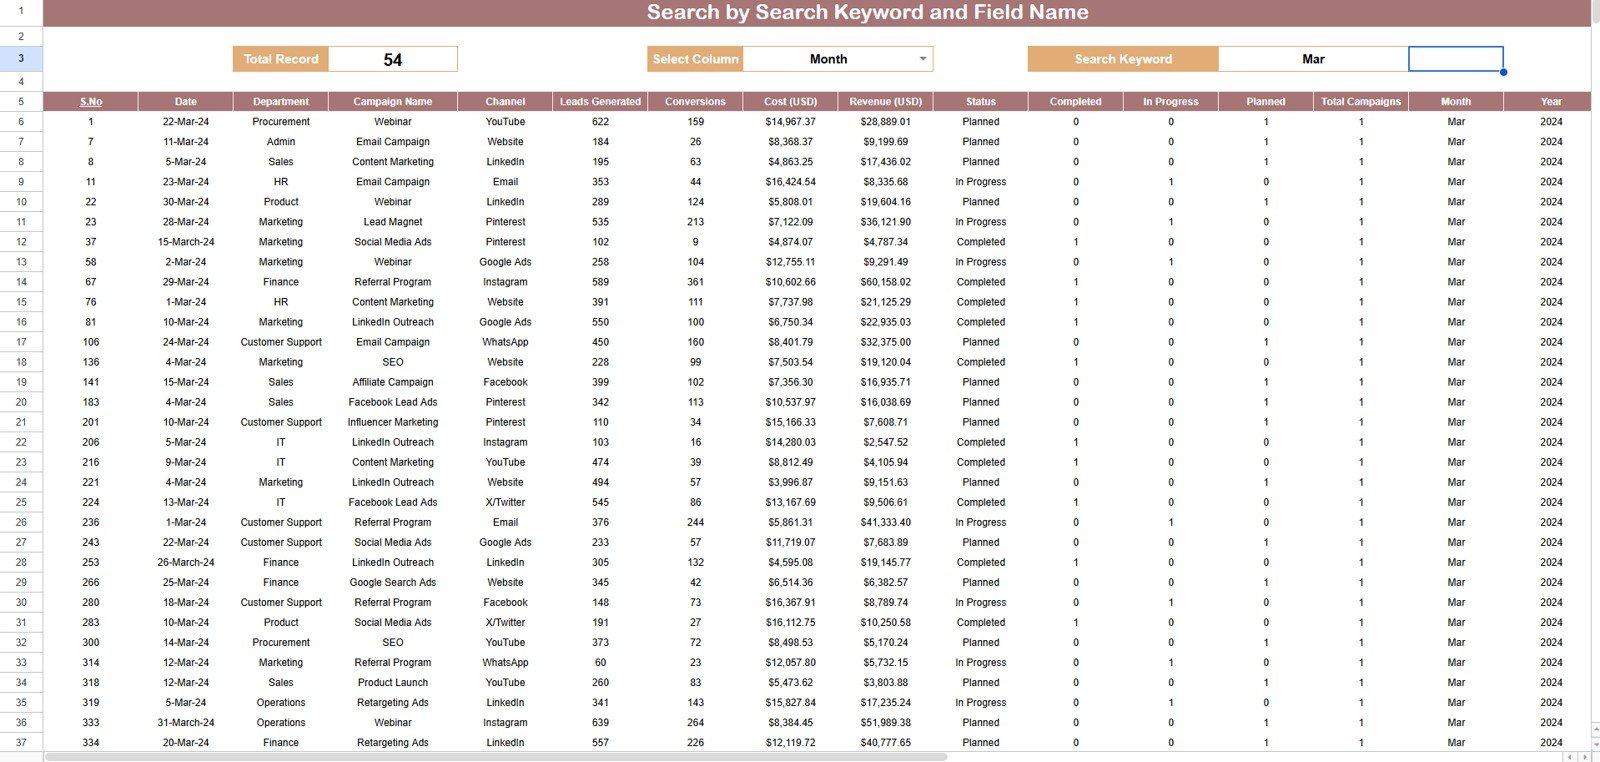
Search Sheet
The Search sheet is designed for quick record lookup. You can select any column from the dropdown, type a search keyword, and instantly see all matching records along with the total record count. This saves time when a user needs to locate a specific campaign, channel, department, or status without manually scanning the Data sheet.
Data Sheet
Channel Performance Analytics Dashboard in Google Sheets product page.
The Data sheet is the input area for campaign records. Add data in the same format as the sample table and keep the headers consistent. Once the data is updated, the dashboard cards, slicers, and charts can continue reflecting the campaign performance structure.
Channel Performance Analytics Dashboard in Google Sheets vs. Microsoft Excel vs. Paid CRM/SaaS – Feature Comparison
| Feature | Google Sheets Dashboard | Microsoft Excel Dashboard | Paid CRM/SaaS |
|---|---|---|---|
| Cost | $9.99 one-time | Usually one-time file cost | Monthly subscription |
| Platform | Browser-based Google Sheets | Desktop Excel or Microsoft 365 | Vendor-hosted web app |
| Setup time | Copy file and replace data | Open workbook and replace data | Needs configuration |
| Real-time team collaboration | Native Google Drive sharing | Possible with OneDrive | Built in |
| Mobile access | Google Sheets mobile app | Excel mobile app | Vendor app |
| Customizable fields | Editable spreadsheet structure | Editable workbook structure | Plan and admin dependent |
| Share with link | Yes | Yes, with Microsoft sharing | Role-based access |
| Year-1 cost at 5 users | $9.99 total | Template cost plus software access | Often hundreds or thousands of dollars |
| Best for | Fast campaign and channel reporting | Offline spreadsheet teams | Full CRM and marketing automation |
Who Should Use This Template
This template is a good fit for marketing managers, digital marketing teams, channel owners, agency analysts, founders, sales operations teams, and department leaders who track campaign results in spreadsheets. It works well when you already have campaign data but need cleaner visuals for review meetings.
It is not the right tool if you need automatic ad-platform data import, CRM pipeline automation, real-time API refresh, user-level permissions, or advanced attribution modeling. In those cases, a BI tool or CRM system may be a better investment.
Real-World Use Cases
Riya, a marketing manager, uses the Overview and Monthly Trends pages during weekly planning to compare campaign volume, revenue, cost, leads, and conversions before deciding where to focus the team.
Marcus, an agency reporting analyst, uses the Channel Analysis and Campaign Analysis pages to prepare client updates. He can show active campaigns, completed campaigns, revenue contribution, and conversion output without rebuilding slides every week.
Elena, a department lead, uses the Department Analysis page to compare campaign workload and revenue contribution across departments before leadership review meetings.
Advantages of Channel Performance Analytics Dashboard in Google Sheets
- Low setup effort: Replace sample data and start reviewing the dashboard.
- Shareable reporting: Google Drive makes it easy to share the same file with teammates.
- Clear performance structure: The dashboard separates channel, campaign, department, and month analysis.
- No subscription: It is a one-time template purchase, not a recurring platform fee.
- Search built in: The Search sheet helps users find matching records quickly.
Opportunities for Improvement
- No direct API connection: Data must be added or pasted into the Data sheet unless you build a custom integration.
- No CRM workflow automation: It reports performance but does not trigger follow-ups or sales tasks.
- Requires clean data: The dashboard works best when campaign names, departments, channels, and statuses are entered consistently.
- No missing Data Sheet screenshot supplied: The template includes a Data sheet, but the supplied product images only include the overview, four analysis pages, and search sheet.
Best Practices
Channel Performance Analytics Dashboard in Google Sheets product page.
- Keep column headers unchanged in the Data sheet.
- Use consistent campaign names, channel names, department labels, and status values.
- Review the Overview page first, then drill into Channel, Campaign, Department, and Monthly Trends pages.
- Use slicers for meeting-specific analysis instead of creating duplicate tabs.
- Make a backup copy before changing formulas, chart ranges, or dashboard layout.
- Use the Search sheet when you need to validate a specific campaign record quickly.
Explore Relevant Templates
If you want to build a wider marketing analytics system, these related templates may also help:
- Digital Marketing Campaign Dashboard in Google Sheets
- PPC Campaign KPI Dashboard in Google Sheets
- Marketing and Social Media Analytics Kit
- Digital Marketing Campaign Dashboard in Excel
You can get the complete Channel Performance Analytics Dashboard in Google Sheets from NextGenTemplates.
Frequently Asked Questions
Is the Channel Performance Analytics Dashboard built in Google Sheets?
Yes. It is designed for Google Sheets and can be copied into Google Drive from the guide included with the product.
What KPI cards are included?
The dashboard includes Total Campaigns, Revenue (USD), Leads Generated, Conversions, and Cost (USD).
How many chart views are included?
The dashboard includes 20 chart views across the Overview, Channel Analysis, Campaign Analysis, Department Analysis, and Monthly Trends pages.
Can I filter the dashboard?
Yes. The dashboard uses slicers so users can filter visuals quickly without editing formulas.
What does the Search sheet do?
The Search sheet lets you select any column, type a search keyword, and see all matching records with a total record count.
Does this replace CRM software?
No. It is a reporting and analytics dashboard. It does not replace CRM workflows, marketing automation, or ad-platform integrations.
About the Author
Built by PK – Microsoft Certified Professional with 15+ years of Excel, Google Sheets, and Power BI experience. Founder of NextGenTemplates, reaching 300K+ subscribers across YouTube channels. Every template is hand-built and tested before release.
Conclusion
The Channel Performance Analytics Dashboard in Google Sheets gives teams a clean way to review campaign performance across channels, campaigns, departments, and months. With 5 KPI cards, 20 chart views, slicers, a Search sheet, and an editable Data sheet, it is a practical reporting template for teams that need fast visibility without building a dashboard from scratch
.
To use the template, visit the Channel Performance Analytics Dashboard in Google Sheets product page.
For more dashboard tutorials and Google Sheets resources, visit the NeoTechNavigators YouTube channel.