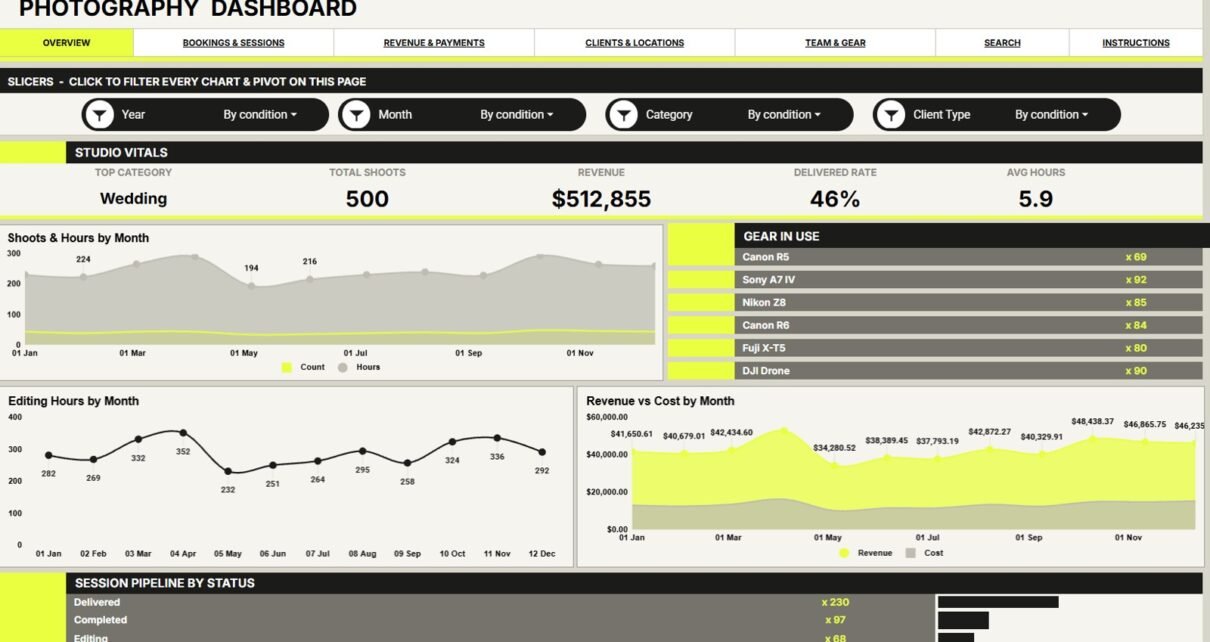
The Photography Dashboard in Google Sheets is built for photographers and studio teams that need a simple way to track shoots, revenue, costs, hours, delivery status, gear, photographers, clients, and locations. The U.S. Bureau of Labor Statistics projects about 12,700 photographer openings each year from 2024 to 2034, which means many small teams need clearer ways to manage work without adding another subscription tool.
This dashboard gives users 7 sheet tabs, 5 high-level KPI cards, 17 chart views, slicer-based filtering, a Search Sheet lookup, and a structured Data Sheet. It is designed for teams that already use spreadsheets and want a clean reporting layer inside Google Drive.
Click here to purchase the Photography Dashboard in Google Sheets.
Key Features of Photography Dashboard in Google Sheets
7 focused sheet tabs: The workbook includes Overview, Bookings & Sessions, Revenue & Payments, Clients & Locations, Team & Gear, Search Sheet, and Data Sheet. This keeps high-level reporting, operational analysis, lookup, and data entry separated.
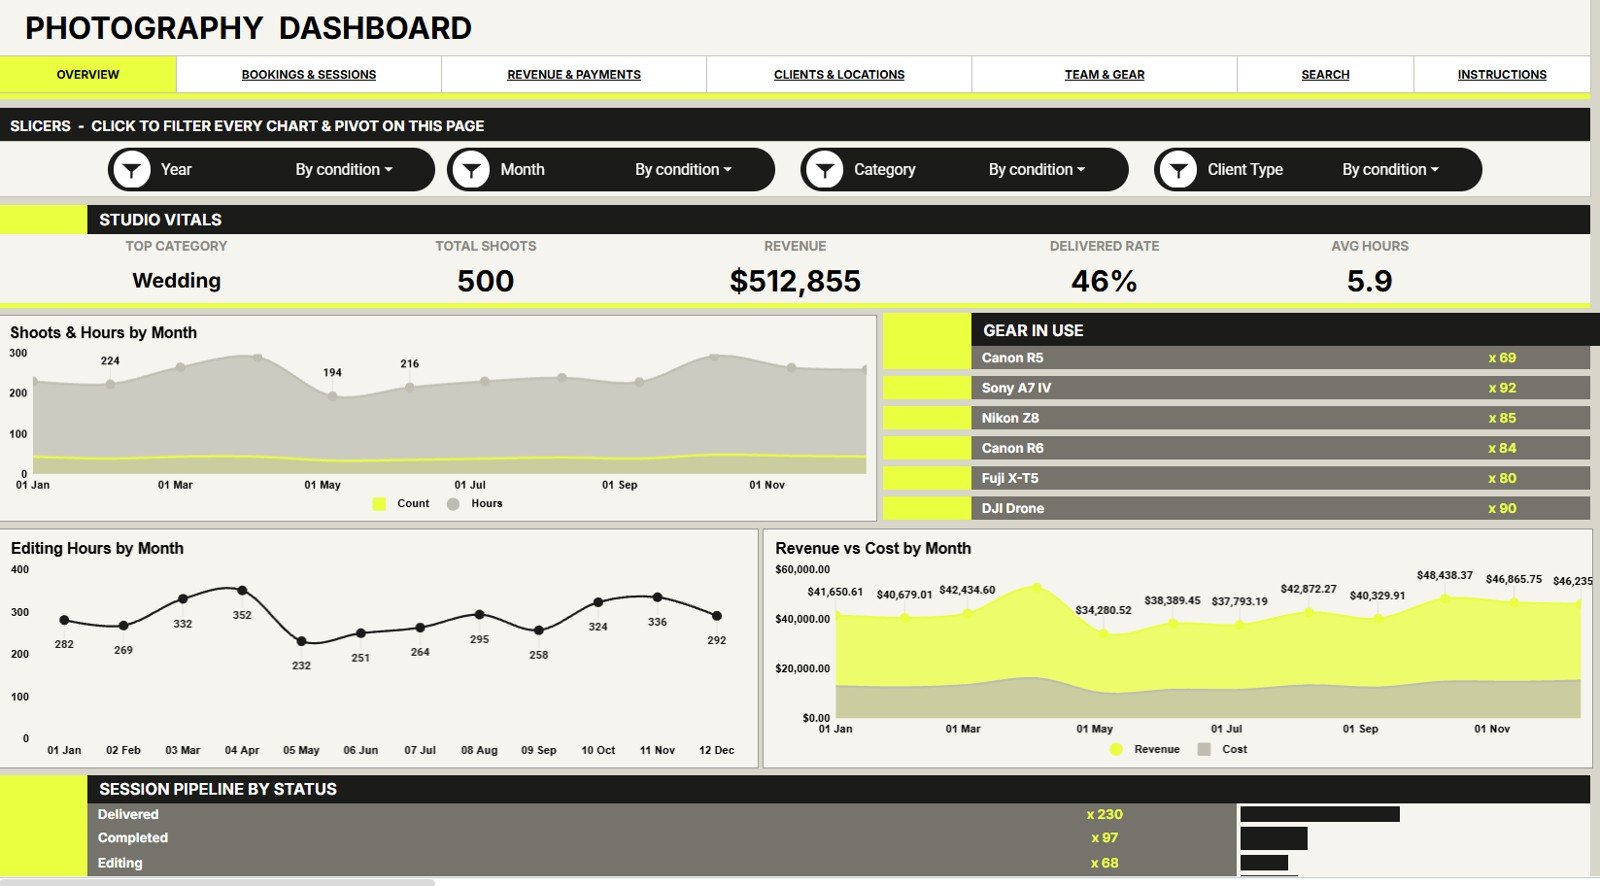
5 headline KPI cards: The Overview page shows Top Category, Total Shoots, Revenue, Delivered Rate, and Avg Hours. These cards help users read the business quickly before reviewing individual charts.
17 chart views: The dashboard analyzes monthly shoots, hours, gear usage, editing workload, revenue, cost, session status, booking category, client type, weekday, location, and photographer performance. That makes it useful for recurring business reviews.
Slicer-based filtering: The dashboard includes slicers so users can apply filters quickly. Google explains that slicers can filter charts and tables in Sheets, which is useful for dashboard review workflows: Google Sheets slicer help.
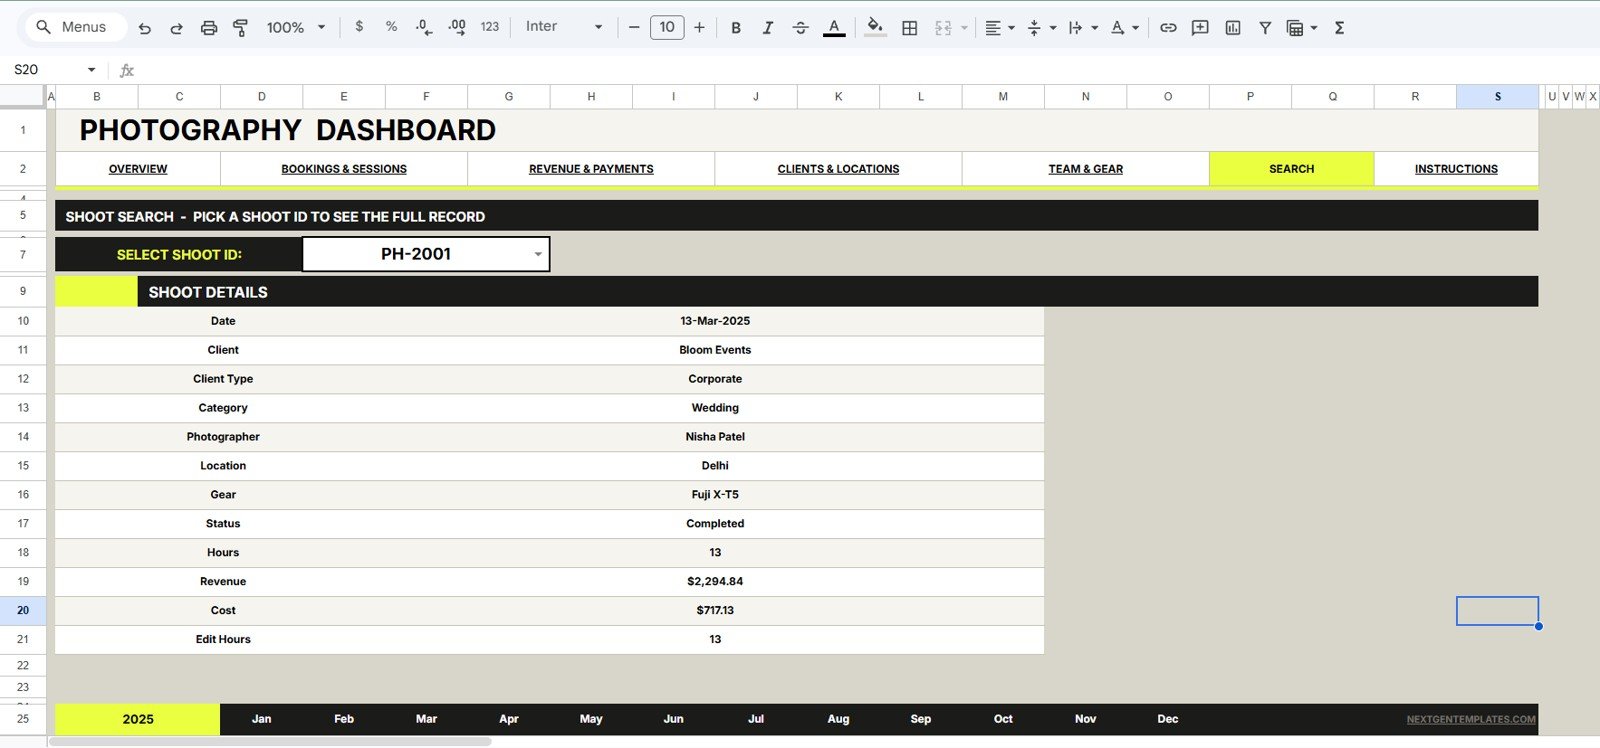
Search Sheet lookup: Select a Shoot ID and see the full shoot record in one place. This is helpful when a client, photographer, or manager needs details without scrolling through the Data Sheet.
Editable Data Sheet: Add your records in the same format as the sample data. When the structure stays consistent, charts, cards, slicers, and lookup areas stay easier to maintain.
Dashboard Pages Explanation
1 – Overview Page
The Overview page gives the main performance summary for the Photography Dashboard in Google Sheets. At the top, it shows Top Category, Total Shoots, Revenue, Delivered Rate, and Avg Hours.
Shoots and Hours by Month: This chart compares how many shoots happened each month with the total hours worked. It helps identify months where workload is increasing faster than shoot count.
Gear in Use by Gear: This chart shows which gear types are used most often. It helps owners plan purchases, rentals, maintenance, and backup equipment.
Editing Hours by Month: This chart tracks post-production workload by month. It is useful for checking whether editing capacity matches the shooting calendar.
Revenue and Cost by Month: This chart compares income and cost across months. It helps reveal whether busy months are also profitable months.
Session Pipeline by Status: This chart groups sessions by status. It helps teams see how much work is booked, delivered, pending, cancelled, or still in progress.
2 – Bookings & Sessions
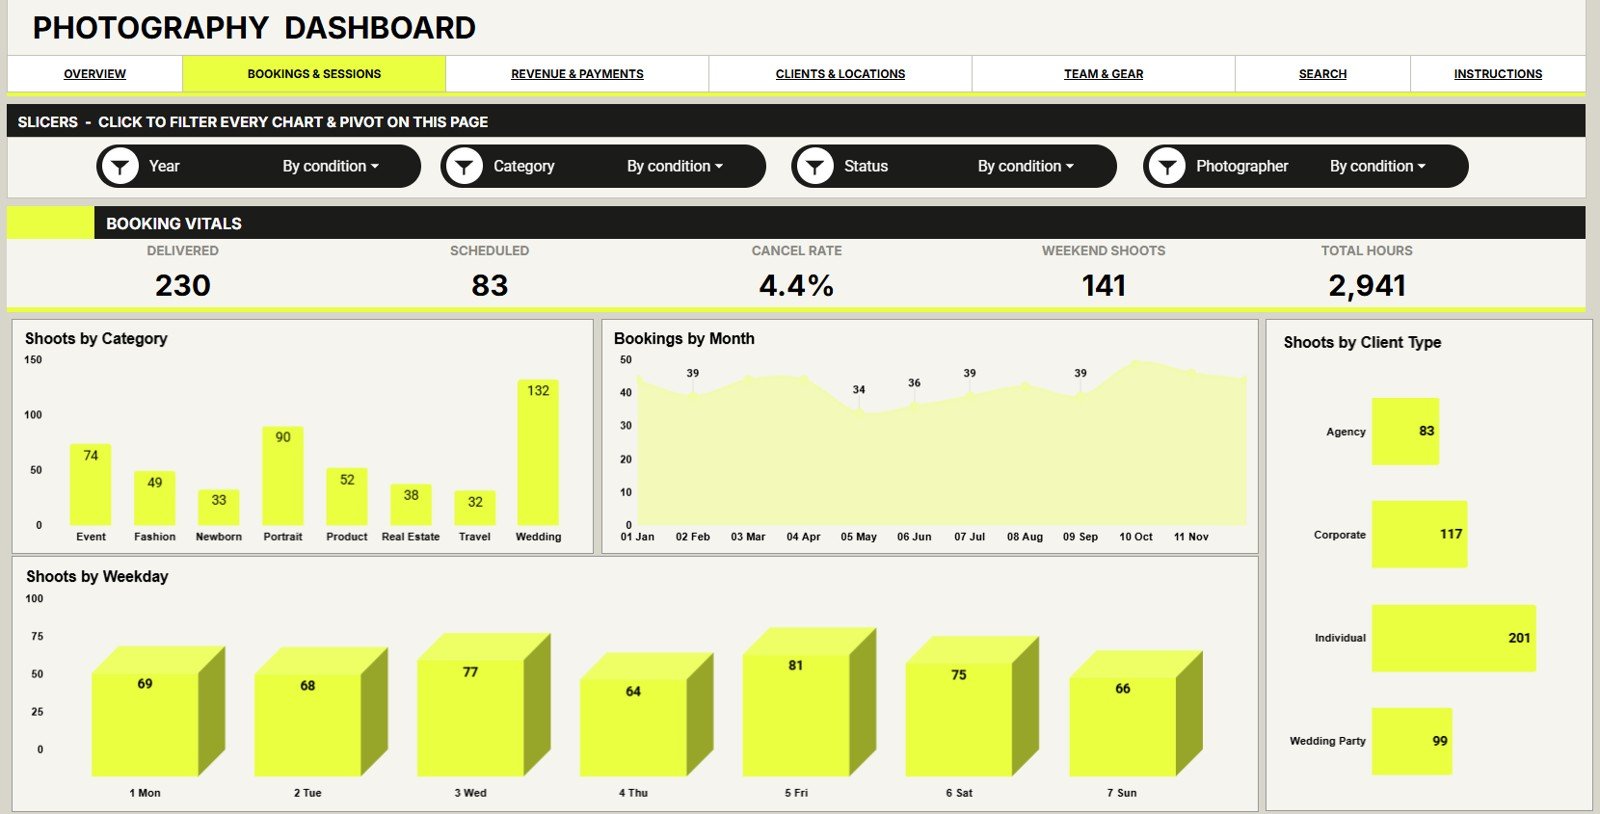
The Bookings & Sessions tab focuses on booking patterns and session mix. It is useful for planning marketing, staffing, weekday availability, and service category strategy.
Shoots by Category: This chart shows which photography categories create the most sessions. It helps decide which services deserve more promotion or package refinement.
Bookings by Month: This chart tracks booking volume over time. It helps identify peak months, slower periods, and seasonal booking patterns.
Shoots by Client Type: This chart compares session volume by client type. It helps distinguish individual, corporate, event, repeat, or custom client demand.
Shoots by Weekday: This chart shows which days carry the most shoot activity. It helps with staffing, studio scheduling, and weekend capacity planning.
3 – Revenue & Payments
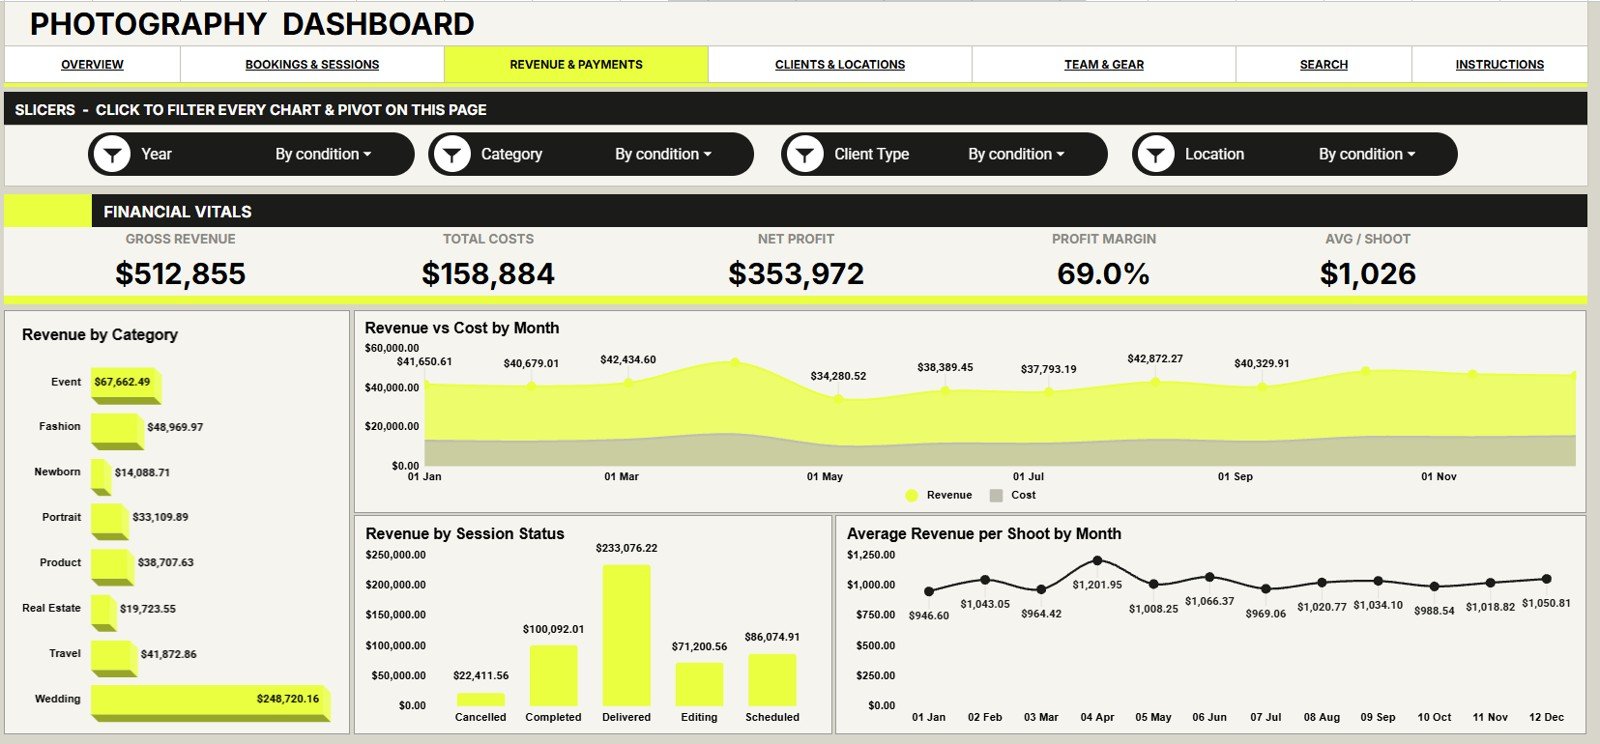
The Revenue & Payments tab focuses on money movement and session value. It helps users review both revenue performance and cost pressure.
Revenue by Category: This chart shows which photography categories generate the most income. It helps users compare service popularity with financial contribution.
Revenue and Cost by Month: This chart compares monthly revenue and cost. It is useful for checking whether revenue growth is being protected by healthy margins.
Revenue by Session Status: This chart connects revenue with session progress. It helps teams see how much revenue sits in completed, delivered, pending, or cancelled statuses.
Average Revenue per Shoot by Month: This chart tracks average shoot value across months. It helps identify pricing changes, package mix shifts, or months with lower-value work.
4 – Clients & Locations
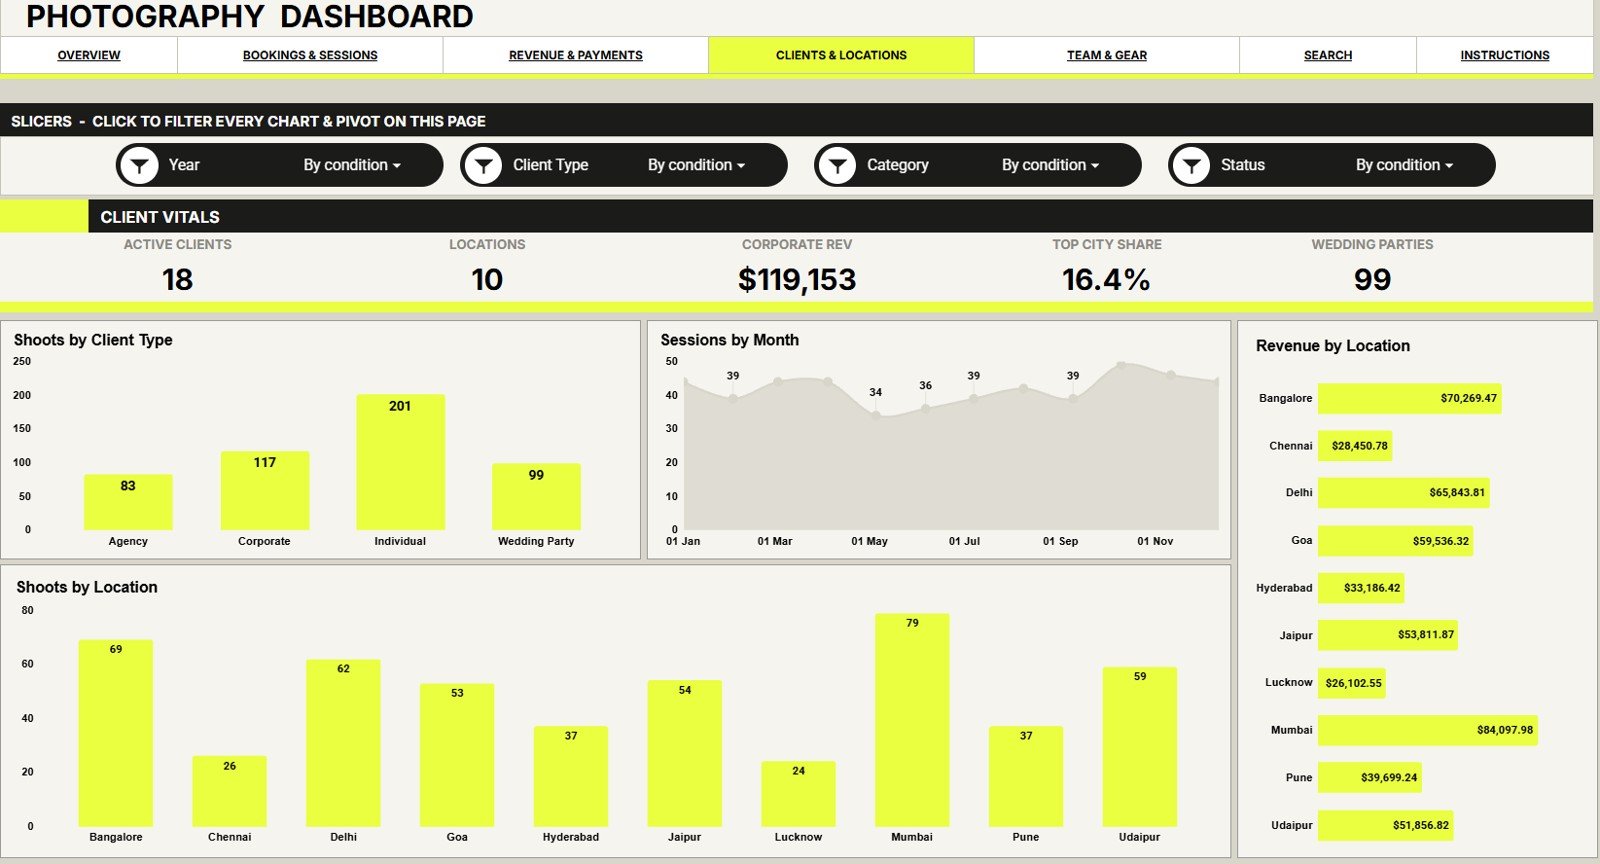
The Clients & Locations tab helps users understand where demand and revenue are coming from. It is useful for client mix review, local advertising, travel planning, and location-level performance checks.
Shoots by Client Type: This chart shows how shoot count differs by client type. It helps clarify whether the business leans toward private, corporate, event, or repeat clients.
Sessions by Month: This chart shows monthly session activity. It helps users compare client demand with calendar capacity.
Revenue by Location: This chart highlights the locations that produce the most revenue. It can guide local marketing, travel decisions, and studio expansion discussions.
Shoots by Location: This chart shows where shoots happen most often. It helps separate high-volume locations from high-revenue locations.
5 – Team & Gear
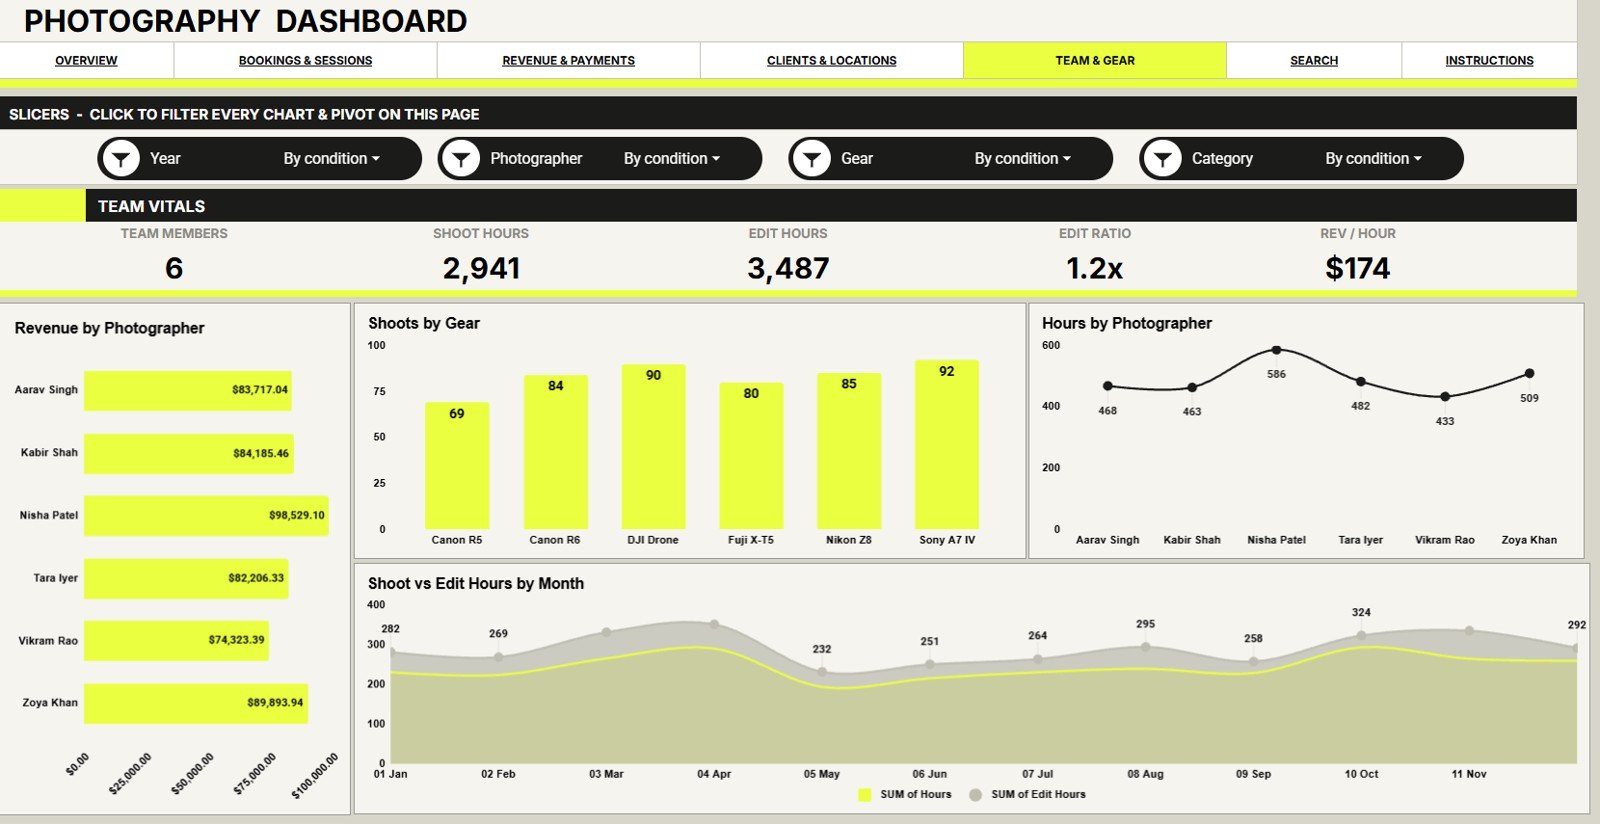
The Team & Gear tab connects people, equipment, revenue, and time. It is useful for studios that need to balance photographer workload with gear usage and editing capacity.
Revenue by Photographer: This chart compares revenue contribution by photographer. It supports team planning, assignment review, and performance conversations.
Shoots by Gear: This chart shows which gear is used across shoots. It helps track equipment demand and decide what needs maintenance or backup coverage.
Hours by Photographer: This chart compares working hours by photographer. It helps managers identify overloaded team members or unused capacity.
Shoot Hours and Edit Hours by Month: This chart compares time spent shooting with time spent editing. It helps reveal whether post-production is becoming the bottleneck.
6 – Search Sheet Tab
The Search Sheet helps users pick a Shoot ID and return the full shoot record in one place. It displays date, client, client type, category, photographer, location, gear, status, hours, revenue, cost, and edit hours.
This makes daily support work easier. Instead of scrolling through the Data Sheet, a team member can choose one ID and review the key details immediately.
7 – Data Sheet Tab
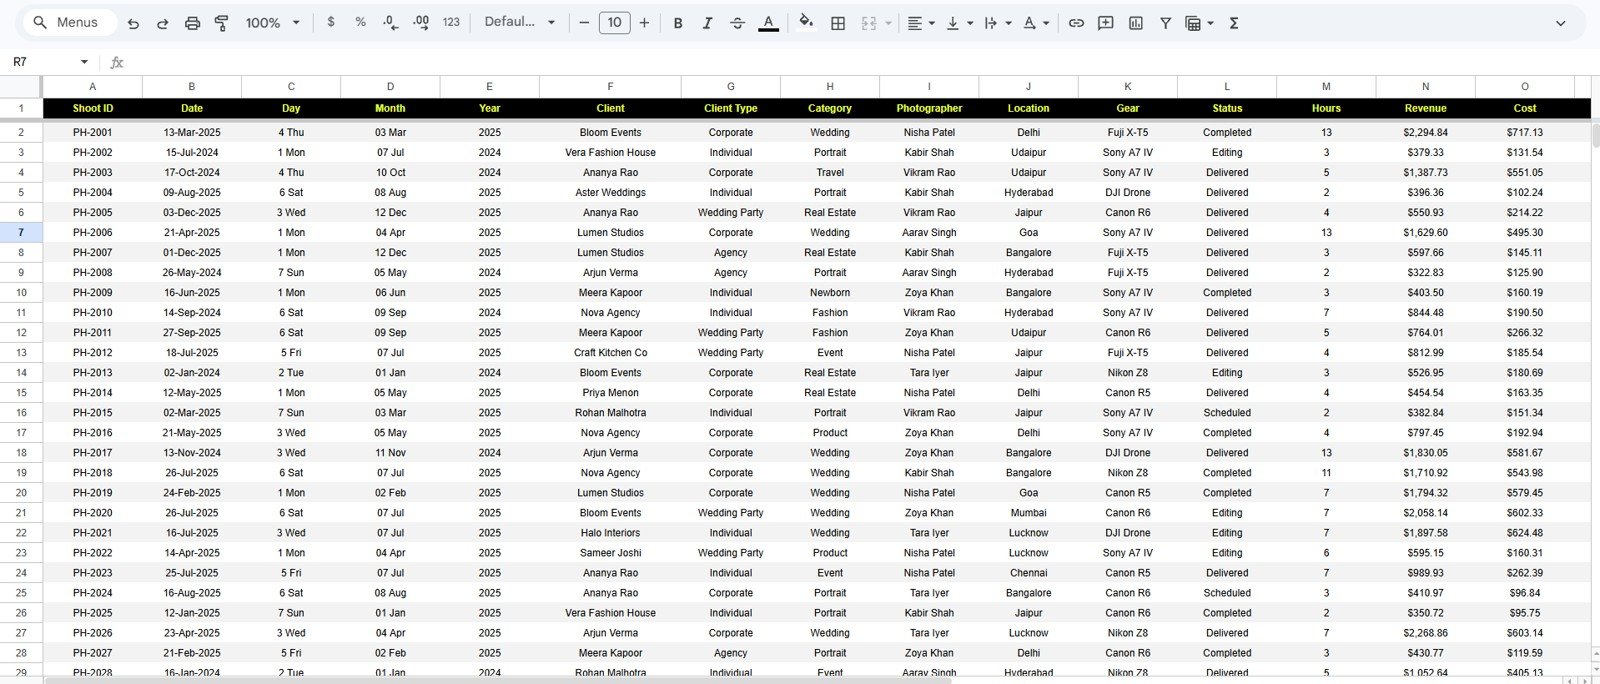
The Data Sheet is the source layer for the entire dashboard. Add your data in the same format so the dashboard can read the records correctly.
Clean data entry matters. Consistent categories, photographer names, location names, dates, revenue, costs, and status values make the charts more reliable.
Photography Dashboard in Google Sheets vs. Microsoft Excel Dashboard vs. Paid CRM/SaaS – Feature Comparison
| Feature | Photography Dashboard in Google Sheets | Microsoft Excel dashboard | Paid CRM/SaaS |
|---|---|---|---|
| Cost | $9.99 one-time sale price | One-time template cost or Microsoft subscription | Monthly or annual subscription |
| Platform | Google Sheets in Google Drive | Excel desktop or web | Vendor-hosted cloud app |
| Setup time | Copy the Sheet and replace sample data | Open workbook and refresh pivots | Account setup, migration, and configuration |
| Real-time team collaboration | Native Google Sheets sharing | Best with OneDrive or SharePoint | Usually included by paid seat |
| Mobile access | Google Sheets app or browser | Excel app with some limits | Usually included |
| Customizable fields | Editable rows, labels, formulas, and charts | Editable workbook structure | Limited by vendor workflow |
| Share with link | Yes, through Google Drive permissions | Yes, through Microsoft cloud sharing | Usually login controlled |
| Year-1 cost at 5 users | $9.99 template price | Template cost plus licensing if needed | Often hundreds of dollars per year |
| Shoot ID lookup | Included through Search Sheet | Requires workbook setup | Usually included |
| Photography analytics | Built around shoots, clients, gear, photographers, hours, revenue, and cost | Depends on template | Often broad CRM reporting |
Who Should Use This Template
This dashboard is a good fit for freelance photographers, portrait studios, wedding photography teams, event photographers, commercial photography teams, creative agencies, studio assistants, and operations managers who track work in Google Sheets.
It is also useful for small teams that want to collaborate without buying a paid CRM seat for every person. Since the file is copied into Google Drive, the owner can control who can view, comment, or edit.
Real-World Use Cases
Wedding studio monthly review: A studio owner reviews Revenue and Cost by Month, Shoots by Category, and Session Pipeline by Status before deciding whether to promote weekend packages.
Portrait studio capacity planning: A manager checks Hours by Photographer and Editing Hours by Month to see whether the team has enough production capacity for a campaign period.
Commercial photographer location review: A photographer compares Revenue by Location and Shoots by Location to decide where to focus local outreach and travel planning.
Advantages of Photography Dashboard in Google Sheets
- Low setup friction: Copy the file, replace sample rows, and start reviewing dashboard pages.
- Clear operational visibility: Track shoots, hours, status, clients, photographers, gear, revenue, and cost in one workbook.
- Fast lookup: The Search Sheet helps users pull one Shoot ID without scanning raw rows.
- Team-friendly sharing: Google Drive permissions make collaboration practical for small teams.
- One-time template purchase: Use a spreadsheet dashboard without a recurring SaaS subscription.
Opportunities for Improvement
- The template is not a full CRM, so it does not handle contracts, invoices, client portals, galleries, or automated emails.
- Automated imports from booking tools are not included by default.
- Reporting depends on clean Data Sheet entry, especially for category, status, location, and photographer names.
- Advanced studios may later connect Google Forms, Apps Script, or automation tools for data entry.
Best Practices
- Use one unique Shoot ID for every shoot.
- Keep category, gear, location, photographer, and status names consistent.
- Update the Data Sheet after each completed or rescheduled shoot.
- Review the Overview page weekly and the detailed tabs monthly.
- Use slicers during meetings instead of duplicating dashboard tabs.
- Keep a backup copy before making structural edits.
Explore Relevant Templates
- Photography Dashboard in Google Sheets
- Photography Business Dashboard in Google Sheets
- Photography Studios Dashboard in Excel
- Photography Studios Dashboard in Power BI
- Photography Business KPI Dashboard in Google Sheets
- Browse more Google Sheets dashboard templates
Frequently Asked Questions
What does the Photography Dashboard in Google Sheets track?
It tracks Top Category, Total Shoots, Revenue, Delivered Rate, Avg Hours, monthly shoots, hours, gear use, editing hours, revenue, cost, session status, client type, locations, photographers, and shoot-level details.
Does it include a Search Sheet?
Yes. The Search Sheet lets users pick a Shoot ID and review the full shoot record in one place.
Can I use it with my own photographers and gear?
Yes. Replace the sample records with your own photographer names, gear names, locations, categories, and statuses while keeping the column structure consistent.
Can my team collaborate in the dashboard?
Yes. Because it runs in Google Sheets, you can share the copied file through Google Drive and control access permissions.
Is this a replacement for a photography CRM?
No. It is a reporting and lookup dashboard. Use it alongside your booking, invoicing, contract, or gallery workflow.
Do I need advanced Google Sheets skills?
No. Basic spreadsheet comfort is enough for normal use. Advanced users can customize charts, labels, formulas, and layout if needed.
About the Author
Built by PK – Microsoft Certified Professional with 15+ years of Excel, Google Sheets, and Power BI experience. Founder of NextGenTemplates, reaching 300K+ subscribers across YouTube channels. Every template is hand-built and tested before release.
Conclusion
The Photography Dashboard in Google Sheets gives photography teams a practical way to track shoots, revenue, cost, delivery rate, hours, gear, clients, locations, photographers, and editing workload from one shareable workbook. It is not a full CRM, but it gives spreadsheet-first teams a clearer operating view without adding a monthly analytics subscription.
Click here to purchase the Photography Dashboard in Google Sheets.
Visit our YouTube channel for step-by-step tutorials: Youtube.com/@NeotechNavigators
Last updated: July 29, 2026