The Inventory Tracker in Google Sheets is a ready-made spreadsheet for keeping stock levels, stock value and reorder points under control without buying inventory software. It is built for small business owners, retail shops, office managers and online sellers who manage a few dozen to a few hundred products and want one shared file the whole team can update.
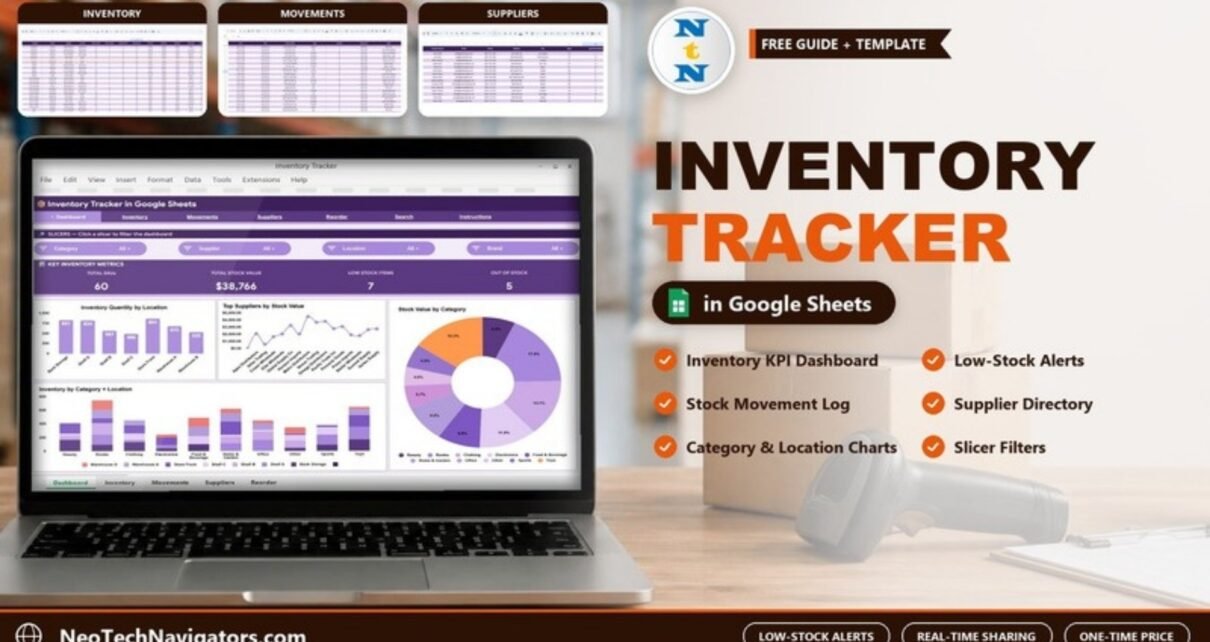
The file is organised into seven tabs reached from a navigation bar: Dashboard, Inventory, Movements, Suppliers, Reorder, Search and Instructions. The Dashboard shows four KPIs – Total SKUs, Total Stock Value, Low Stock Items and Out of Stock – with Category, Supplier, Location and Brand slicers. The sample file ships with 60 products and uses no macros, so it works in any browser and on the Google Sheets mobile app.
This guide walks through each tab, the KPIs it calculates, how to load your own items step by step, practical use cases and the honest limits of tracking inventory in a spreadsheet.
🎥 Watch the Video Tutorial
Get the Inventory Tracker in Google Sheets
What Problem Does an Inventory Tracker Solve?
Most small businesses do not lose money on inventory because of one big mistake. They lose it slowly: an item runs out and a sale is missed, another is over-ordered and sits on the shelf, a delivery is never recorded, or two people keep separate lists that disagree. A simple inventory tracker in Google Sheets fixes the basics:
- Everyone sees the same, current stock count.
- Low-stock and out-of-stock products are counted on the Dashboard before they cost you sales.
- Every purchase, sale, return, transfer and damaged item is recorded with a date, reference number and note.
- Stock value by category, supplier and location is summarised automatically.
Inside the Inventory Tracker in Google Sheets
1. Dashboard
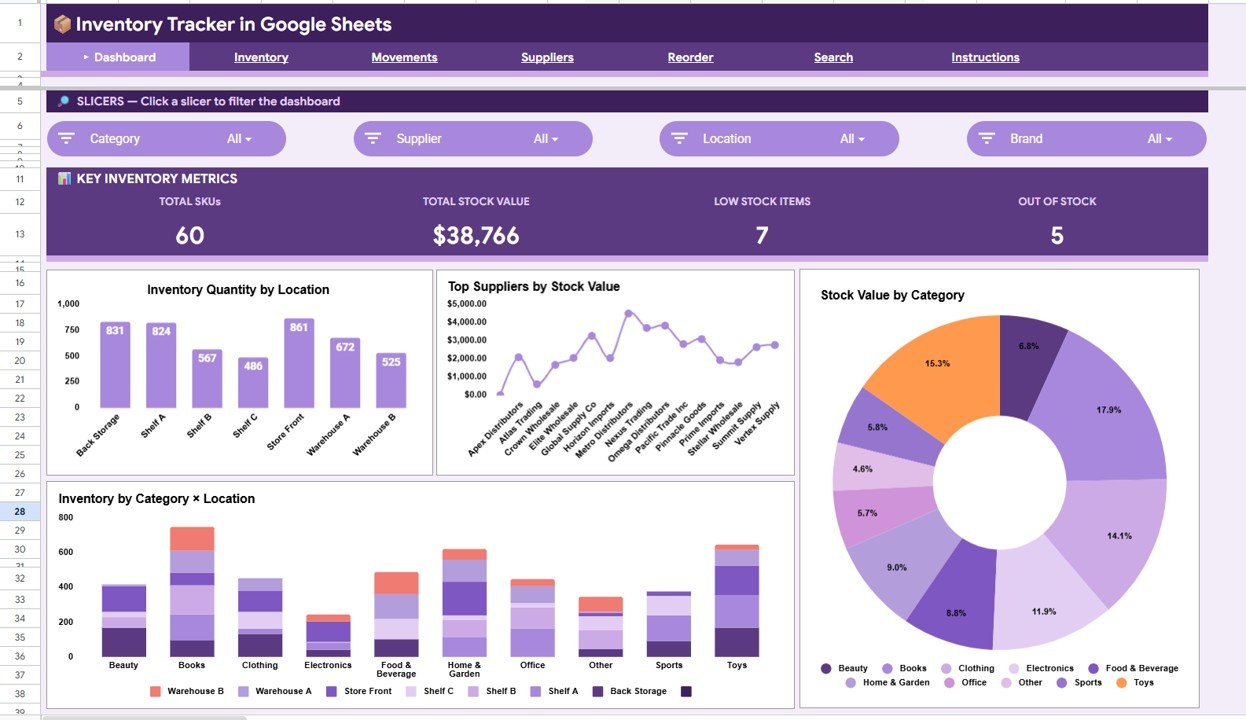
The Dashboard gives a one-screen view of inventory health. Four slicers at the top – Category, Supplier, Location and Brand – filter everything below them. The Key Inventory Metrics band shows four KPIs; with the sample data they read Total SKUs 60, Total Stock Value $38,766, Low Stock Items 7 and Out of Stock 5.
Four charts sit underneath:
- Inventory Quantity by Location – a column chart across Back Storage, Shelf A, Shelf B, Shelf C, Store Front, Warehouse A and Warehouse B.
- Top Suppliers by Stock Value – a line chart of stock value held per supplier.
- Stock Value by Category – a doughnut chart across the ten categories (Beauty, Books, Clothing, Electronics, Food & Beverage, Home & Garden, Office, Other, Sports and Toys).
- Inventory by Category × Location – a stacked column chart showing where each category’s units are stored.
2. Inventory
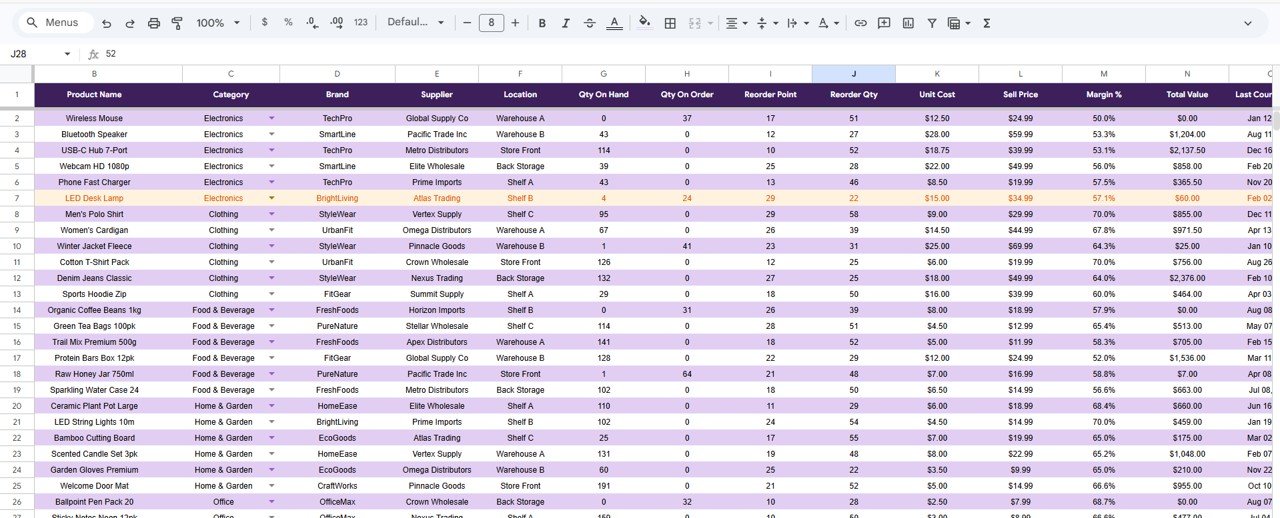
The Inventory tab is the master list of everything you stock, one product per row. The visible columns are Product Name, Category, Brand, Supplier, Location, Qty On Hand, Qty On Order, Reorder Point, Reorder Qty, Unit Cost, Sell Price, Margin %, Total Value and a last-count date. Category is chosen from a dropdown.
The calculated columns are easy to check against the sample rows. Total Value is Qty On Hand × Unit Cost (Bluetooth Speaker: 43 × $28.00 = $1,204.00), and Margin % is (Sell Price − Unit Cost) ÷ Sell Price (Wireless Mouse: ($24.99 − $12.50) ÷ $24.99 = 50.0%).
3. Movements
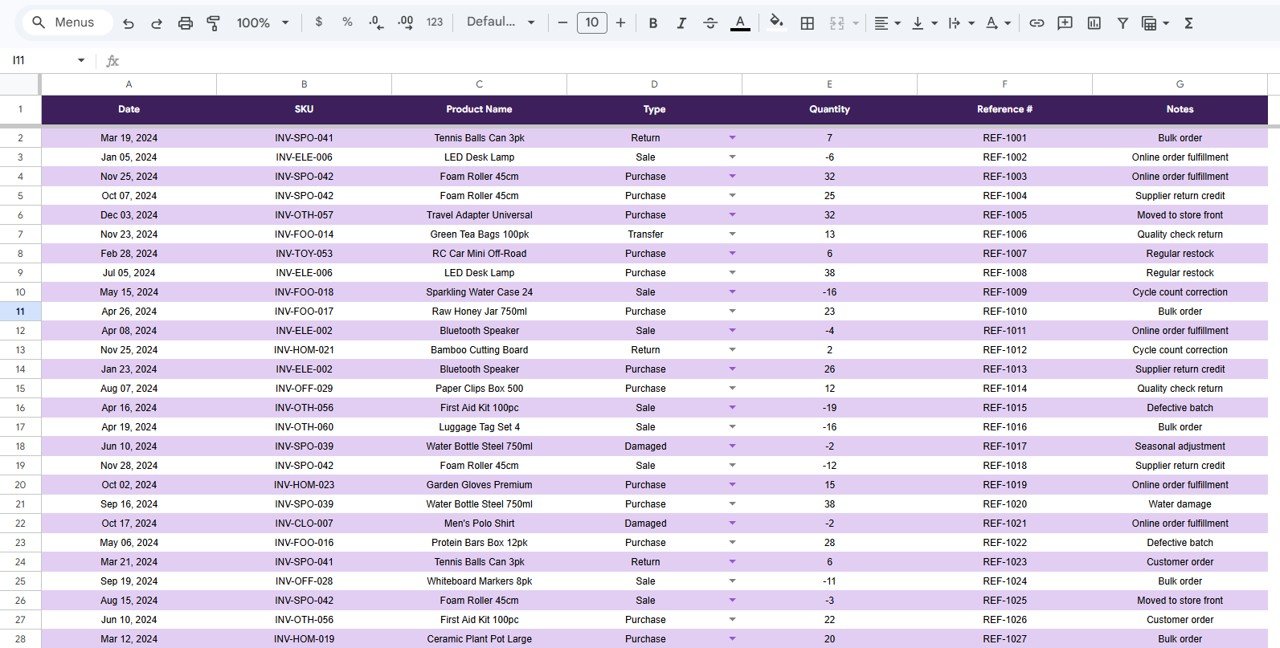
Every change in stock is written to the Movements tab with Date, SKU, Product Name, Type, Quantity, Reference # and Notes. Type is picked from a dropdown with five values in the sample data: Purchase, Sale, Return, Transfer and Damaged. Sales and damaged stock are entered as negative quantities (for example LED Desk Lamp, Sale, −6), purchases and returns as positive ones. This is your audit trail: when a physical count does not match the sheet, the log shows exactly which movements to check.
4. Suppliers
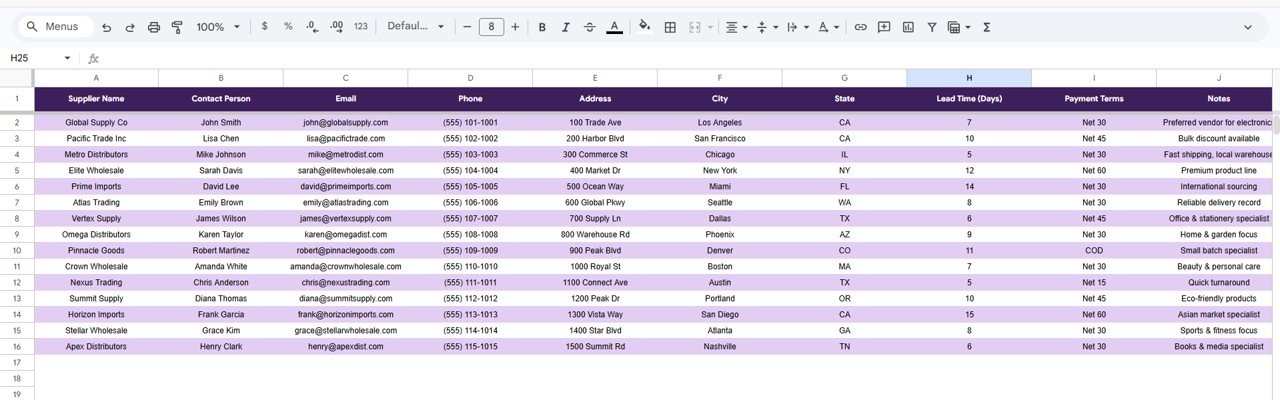
The Suppliers tab is a contact directory with Supplier Name, Contact Person, Email, Phone, Address, City, State, Lead Time (Days), Payment Terms and Notes. The sample lists 15 suppliers with payment terms such as Net 15, Net 30, Net 45, Net 60 and COD. The lead-time column is useful when you set reorder points.
5. Reorder, Search and Instructions
The navigation bar also links to a Reorder tab for products that need restocking, a Search tab for looking up a product, and an Instructions tab that explains how to use the file.
Inventory KPIs Explained
| KPI | What it measures | How it is worked out | Better when |
|---|---|---|---|
| Total SKUs | Number of distinct products tracked | Count of products in the Inventory tab (60 in the sample) | Matches your real catalogue |
| Total Stock Value | Money tied up in inventory | Sum of Total Value (Qty On Hand × Unit Cost) | Lower for the same service level |
| Low Stock Items | Products running low against their Reorder Point | Count of products whose stock has fallen to the reorder level | Lower |
| Out of Stock | Products you cannot sell right now | Count of products with zero Qty On Hand | Lower |
If you want to understand the logic, these are typical Google Sheets formulas for this kind of calculation (adjust ranges to your columns; the template’s own formulas may be written differently):
Total stock value:   =SUMPRODUCT(QtyOnHand_Range, UnitCost_Range)
Out of stock:        =COUNTIF(QtyOnHand_Range, 0)
Net movement of SKU: =SUMIFS(Mov_Qty_Range, Mov_SKU_Range, "INV-ELE-006")
The last formula is the core idea of a movement log: adding all signed quantities for one SKU tells you how much stock has come in or gone out.
How to Use It with Your Own Data
- Make your copy of the file in Google Drive with File > Make a copy.
- Read the Instructions tab once so you know which columns are inputs and which are calculated.
- Enter your suppliers in the Suppliers tab, including lead time and payment terms.
- Clear the sample products in the Inventory tab, keeping headers and formula columns (Margin %, Total Value).
- Add your products one per row with category, brand, supplier, location, Qty On Hand, Reorder Point, Reorder Qty, Unit Cost and Sell Price.
- Record every movement in the Movements tab from now on – purchases and returns as positive quantities, sales and damaged stock as negative – with a Reference # and note.
- Review the Dashboard daily or weekly, use the slicers to focus on one supplier or location, and work through the Reorder tab.
- Share with Share > Editor for staff who update stock and Viewer for managers.
Google Sheets Tracker vs Excel Template vs Inventory Software
| Feature | Inventory Tracker in Google Sheets | Desktop Excel template | Dedicated inventory software |
|---|---|---|---|
| Pricing model | One-time purchase | One-time purchase | Usually a monthly subscription |
| Real-time collaboration | Yes, built into Google Sheets | Limited (file-based) | Yes |
| Mobile access | Any browser or the Sheets app | Excel mobile app | Usually a dedicated app |
| Customisation | Fully editable | Fully editable | Limited to the vendor’s fields |
| Barcode scanning | No | No | Usually yes |
| Purchase orders and e-commerce sync | Manual | Manual | Built in |
| Best for | Small teams, up to a few hundred SKUs | Single user on a PC | High-volume or multi-channel operations |
Real-World Use Cases
Online seller with several storage spots
A seller on Shopify and Amazon keeps stock on shelves at home and in a small rented unit. Each product’s Location is set in the Inventory tab, every shipment is logged as a Sale in Movements, and the Inventory Quantity by Location chart shows how many units sit in each place. The Low Stock Items and Out of Stock counts tell them what to reorder before a listing goes dark.
Office supplies for a growing team
An office manager tracks paper, toner, stationery and pantry items. The office coordinator logs what is taken each week, both work in the same shared file, and the monthly order is built from the Reorder tab using each supplier’s lead time.
Small café or bakery ingredients
A café owner records coffee beans, tea, milk and packaging. Deliveries go into Movements as Purchases, spoiled stock as Damaged, and the Supplier slicer on the Dashboard shows how much stock value each supplier accounts for.
Best Practices
- Log movements the same day. A tracker is only as accurate as its last update.
- Use the dropdowns for Category and Type instead of typing freehand, so charts and counts group correctly.
- Base reorder points on lead time: average daily usage × the supplier’s Lead Time (Days), plus a safety buffer.
- Do a physical count monthly or quarterly and record differences with a clear note.
- Archive old movement rows each year to a separate tab to keep the file fast.
- Give view-only access to people who only need to see the numbers.
Who Should Not Use This Template
A spreadsheet is the wrong tool if you manage thousands of SKUs, need barcode scanning at the counter, want purchase orders generated automatically, or need stock synced in real time with Shopify, WooCommerce or Amazon. Businesses that require lot or serial-number traceability for regulatory reasons should also use dedicated inventory software. Google Sheets has a 10-million-cell limit per file, so very long movement histories will eventually slow down.
Related Inventory Guides and Templates
Want to go deeper? Learn the formulas behind stock tracking in how to calculate stock levels in Google Sheets, see a fuller system in the inventory management system in Google Sheets, handle several warehouses with multi-location inventory management, plan counts with the inventory audit checklist, and report on stock with the inventory management dashboard in Google Sheets.
Related template on NextGenTemplates: the Inventory Audit Calendar in Google Sheets for scheduling physical counts through the year.
If you want to write formulas like SUMIFS, SUMPRODUCT and lookups with confidence, the Excel AI Mastery 100 Formulas course on NextGenTemplates Academy teaches them with practical exercises that carry over to Google Sheets.
Frequently Asked Questions
How many items can the Inventory Tracker in Google Sheets handle?
It is designed for small and mid-sized catalogues – comfortably hundreds of products with their movement history. The sample file contains 60 SKUs that you replace with your own.
Does it work on a phone?
Yes. It runs in Google Sheets, so you can view and update it from the Google Sheets app or a mobile browser. It contains no macros.
Can several people update stock at the same time?
Yes. Google Sheets supports real-time multi-user editing, so warehouse staff and office staff can work in the same file.
How does it show low stock?
Each product has a Reorder Point and Reorder Qty in the Inventory tab. Products that have run low are counted in the Low Stock Items KPI, products with nothing on hand in Out of Stock, and the Reorder tab collects what needs restocking.
Can I filter the dashboard?
Yes. The Dashboard has four slicers – Category, Supplier, Location and Brand – that filter the KPIs and charts.
Is it better than inventory software?
For small teams with simple needs it is faster to set up and has no monthly fee. If you need barcode scanning, automated purchase orders or e-commerce sync, dedicated software is the better choice.
Wrapping Up
An inventory tracker does not have to be complicated. With a Dashboard for the big picture, an Inventory tab for every product, a Movements log for the audit trail, a Suppliers directory with lead times and a Reorder tab for what to buy next, the Inventory Tracker in Google Sheets covers what most small businesses need. Add your suppliers, load your products, log every movement, and check the Low Stock and Out of Stock numbers each week.
Get the Inventory Tracker in Google Sheets
📅 Last updated: October 2026