The Cleaning Service Dashboard in Google Sheets tracks 4 KPIs across 6 interactive pages, with 12 pre-built charts and slicer-based filters. According to IBISWorld industry data, the janitorial and cleaning services market generates over $90 billion annually in the US alone — yet most small cleaning businesses still track jobs in notebooks or basic spreadsheets with no analytics layer. This template closes that gap for $9.99, one time.
Whether you run a residential crew, a commercial cleaning agency, or a specialized move-in/move-out service, this Google Sheets dashboard gives you instant visibility into revenue trends, staff performance, service profitability, and client patterns — all without a monthly SaaS subscription.

Key Features of Cleaning Service Dashboard in Google Sheets
This dashboard delivers a full analytics layer for cleaning businesses. The Overview page displays 4 KPI cards — Total Revenue, Completed Jobs, Average Rating, and Average Job Value — alongside 4 charts covering revenue by month, service area, service type, and staff member. Multiple slicers let you filter every visual by date range, staff, area, or job status in one click.
The template includes 6 sheets total: Overview, Services Analysis, Staff Analysis, Clients Analysis, Search Sheet, and Data Sheet. Every chart and KPI references the Data Sheet as the single source of truth, so adding a new job record automatically updates all 12 charts and all 4 KPI cards across the entire template. Setup takes under 10 minutes — just paste your data and start analyzing.
Dashboard Pages Explanation
Cleaning Service Dashboard in Google Sheets
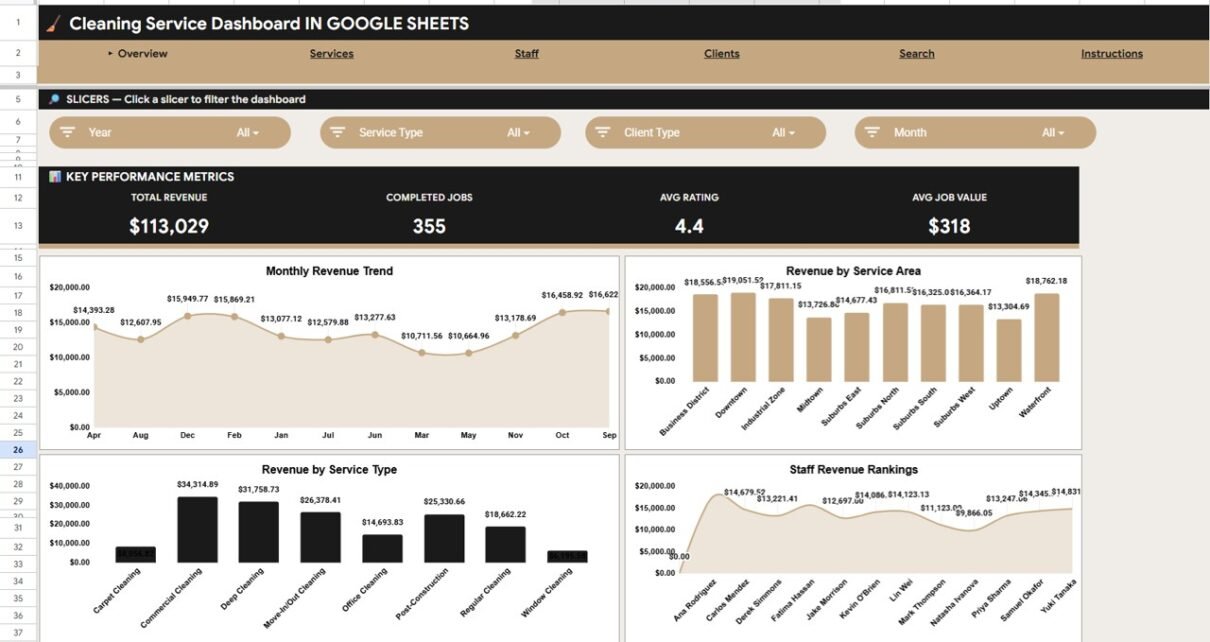
1. Overview Page
The Overview page is the main landing view. At the top, 4 KPI cards show Total Revenue, Completed Jobs, Average Rating, and Average Job Value. Below the cards, 4 charts display Revenue by Month, Revenue by Service Area, Revenue by Service Type, and Revenue by Staff. Slicers along the top or side let you filter the entire page by any combination of date range, staff member, service area, or status.
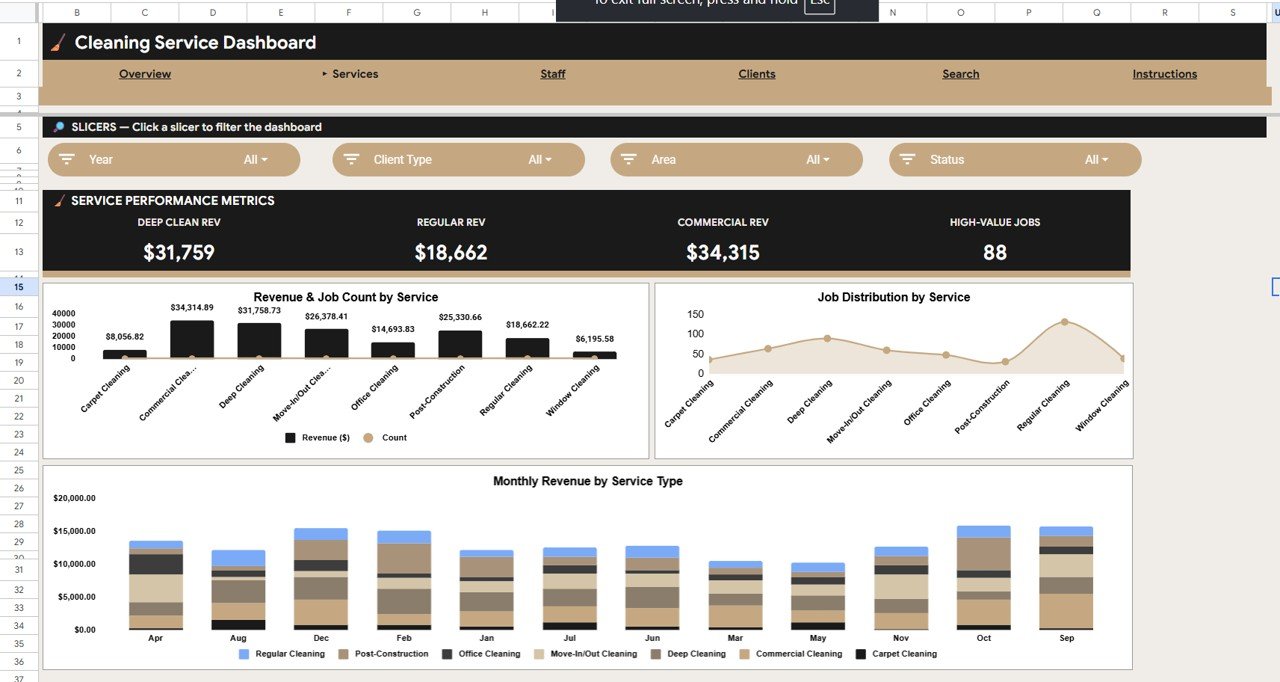
2. Services Analysis
The Services Analysis page focuses on service-level profitability. It includes Revenue and Job Count by Service Type, Job Distribution by Service Type (showing percentage shares), and Monthly Revenue by Service Type to track seasonal patterns. This helps you identify which services — deep cleaning, standard maintenance, window cleaning, carpet shampooing — generate the most revenue and volume.
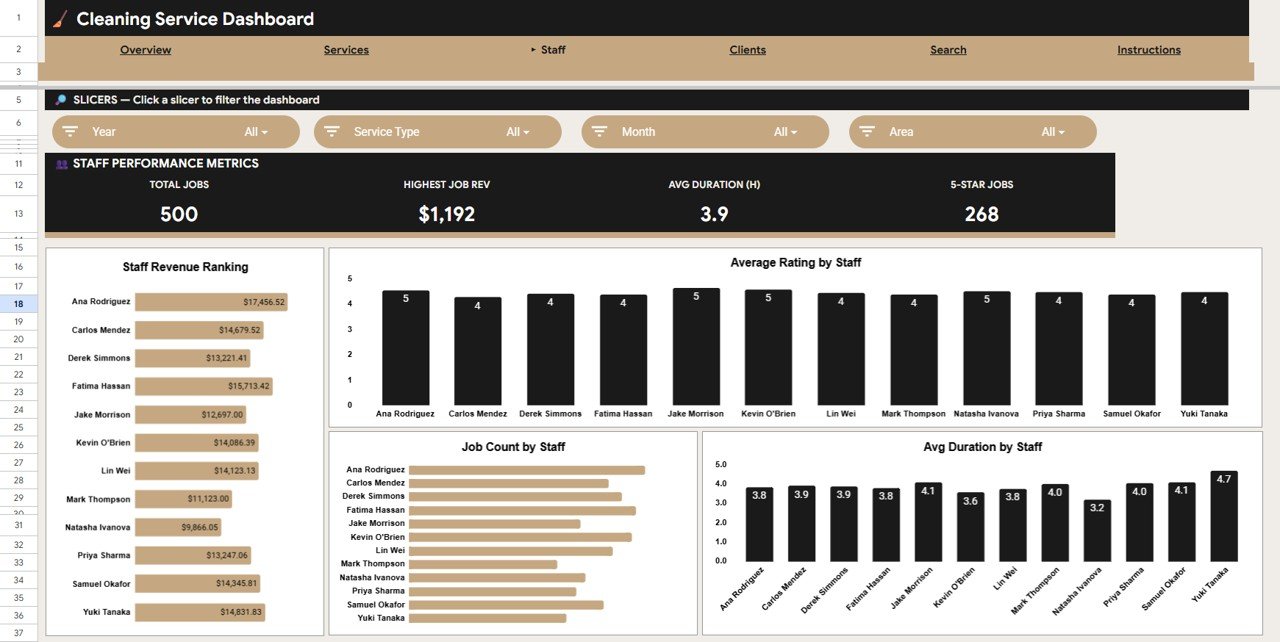
3. Staff Analysis
Cleaning Service Dashboard in Google Sheets
The Staff Analysis page ranks each team member across 4 dimensions: Revenue by Staff, Average Rating by Staff, Job Count by Staff, and Average Duration by Staff. Managers can instantly spot who generates the most revenue, who earns the highest customer ratings, and who completes jobs fastest — making it easy to assign the right staff to the right jobs.
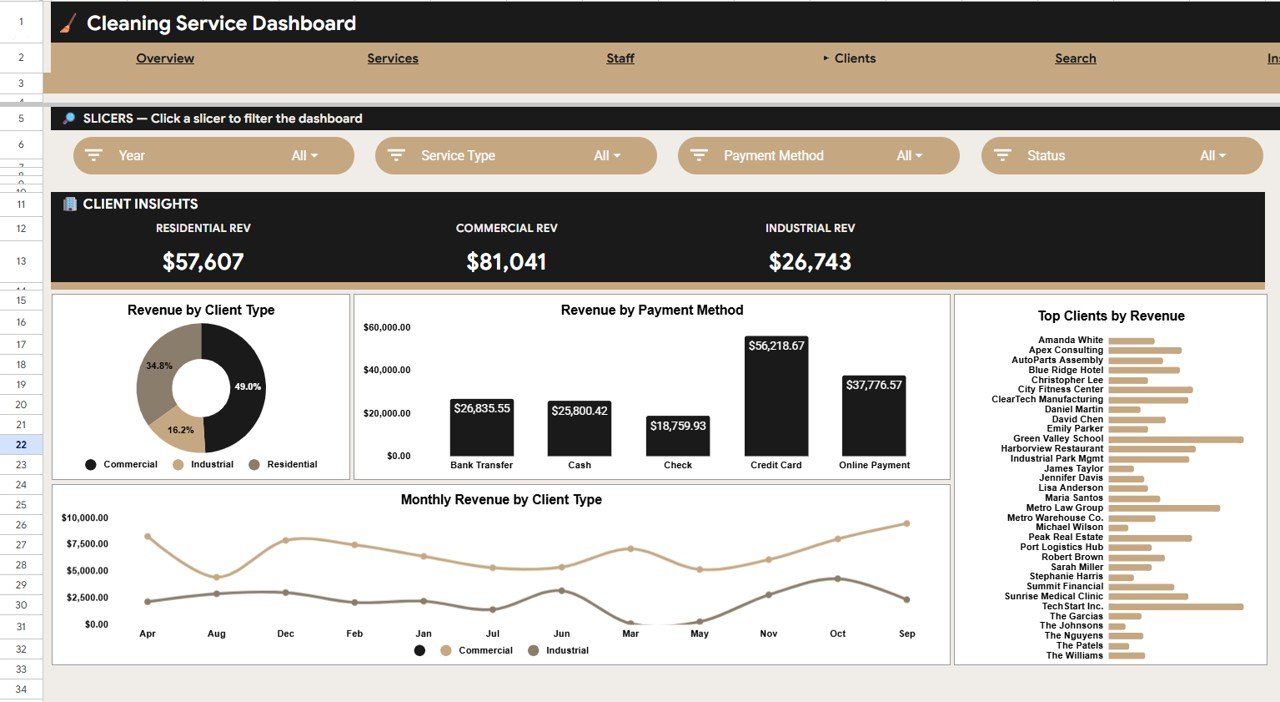
4. Clients Analysis
The Clients Analysis page segments your customer base with 4 charts: Revenue by Client Type, Revenue by Payment Method, Top Clients by Revenue, and Monthly Revenue by Client Type. This helps you understand whether residential or commercial clients drive more revenue, which payment methods are most common, and who your highest-value accounts are.
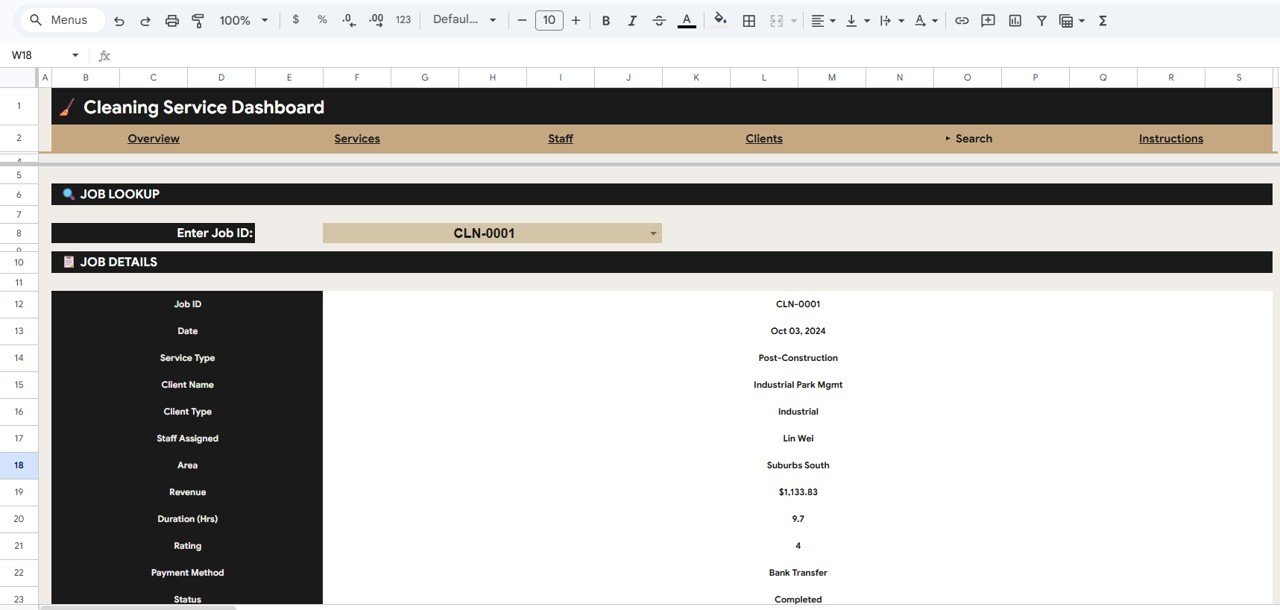
5. Search Sheet
Cleaning Service Dashboard in Google Sheets
The Search Sheet lets you look up any individual job record instantly. Select a Job ID from the dropdown and the dashboard shows complete details — Date, Service Type, Client Name, Client Type, Staff Assigned, Area, Revenue, Duration, Rating, Payment Method, and Status. No scrolling through the data sheet needed.
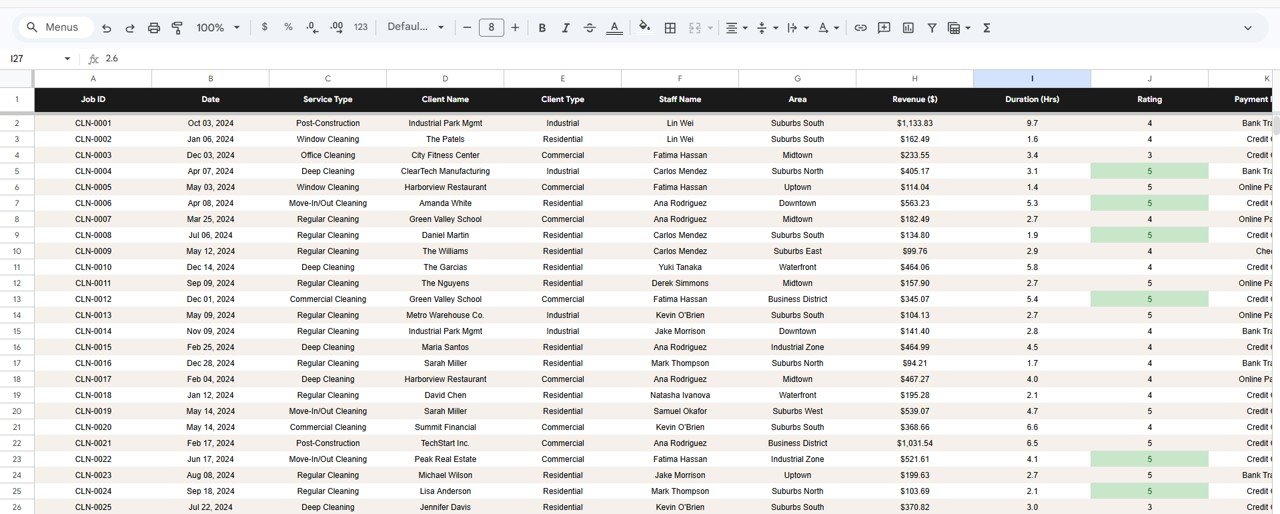
6. Data Sheet
The Data Sheet is the central data repository. Enter your cleaning job records here — date, service type, client name, client type, staff assigned, area, revenue, duration, rating, payment method, and status. Every other page in the dashboard references this sheet, so new entries update all charts and KPIs automatically.
Cleaning Service Dashboard vs. Microsoft Excel Dashboard vs. Jobber — Feature Comparison
| Feature | Cleaning Service Dashboard in Google Sheets | Microsoft Excel Dashboard | Jobber (Paid SaaS) |
|---|---|---|---|
| Cost | $9.99 one-time | $14.99–$19.99 one-time | $49–$149/month |
| Platform | Google Sheets (free, browser-based) | Requires MS Excel license | Web + Mobile app |
| Setup Time | Under 10 minutes | Under 10 minutes | 1–3 hours |
| Real-time Team Collaboration | ✅ Built-in | Limited (OneDrive needed) | ✅ Yes |
| Mobile Access | ✅ Google Sheets app (free) | Requires Excel mobile license | ✅ Yes |
| Customizable Fields | ✅ Fully editable | ✅ Fully editable | Limited to plan tier |
| Share with Link | ✅ One-click sharing | Requires OneDrive/SharePoint | Requires team seats ($) |
| Year-1 Cost at 5 Users | $9.99 total | $14.99 + Excel licenses | $588–$1,788 |
| Staff Performance Tracking | ✅ 4 staff metrics | Manual setup | ✅ Advanced reporting |
For cleaning businesses that want revenue tracking, staff analytics, and client insights without paying $49–$149/month, the Cleaning Service Dashboard in Google Sheets sits in the sweet spot.
Who Should Use This Template
Cleaning Service Dashboard in Google Sheets
Perfect for:
- Independent cleaning service owners tracking 50–500 jobs per month
- Cleaning agency managers who need staff performance visibility across multiple team members
- Operations coordinators monitoring service areas, client types, and payment patterns
- Small business owners who want analytics without learning new software or paying monthly fees
Not a fit if:
- You run an enterprise cleaning firm with 100+ staff needing automated job dispatch, GPS routing, and field service management
- You need integrated invoicing, online booking, customer portals, and CRM functionality in a single platform
Real-World Use Cases
Priya runs a 6-person residential cleaning crew in Bangalore. She uses the Cleaning Service Dashboard to track which staff members earn the highest customer ratings and which service areas generate the most revenue — helping her assign the right people to the right jobs without a ₹5,000/month Jobber subscription.
Carlos operates a commercial cleaning company in Miami with 15 active clients. He uses the Clients Analysis page to identify top-spending accounts and spot declining revenue from specific client types. The Payment Method breakdown helps him push clients toward faster-paying methods like digital transfers.
Aisha manages a move-in/move-out cleaning service in London. She uses the Services Analysis page to compare deep clean vs. standard clean profitability per month, then adjusts her pricing and marketing focus toward the higher-margin service lines.
Advantages of Cleaning Service Dashboard in Google Sheets
The biggest advantage is cost: $9.99 one-time versus $49–$149/month for SaaS tools like Jobber or ZenMaid. For a 5-person team, that’s a savings of $578–$1,778 in the first year alone. Google Sheets also provides real-time collaboration out of the box — your entire team can view dashboards simultaneously from any device without additional licenses.
The slicer-based filtering system means you can slice data by staff, date range, service area, or status without knowing any formulas. And since the template runs in Google Sheets, you get free mobile access via the Google Sheets app, automatic cloud backups, and version history — features that paid SaaS tools charge extra for.
Opportunities for Improvement
This dashboard does not include automated job scheduling, dispatch, or route optimization. If you need to assign jobs to staff and track them in real-time on a map, a dedicated field service tool like Jobber or Housecall Pro is a better fit. The template also lacks built-in invoicing and payment collection — you would still need a separate tool for billing clients. For teams larger than 20–30 staff, the manual data entry approach may become time-consuming; at that scale, consider integrating with Google Forms for automated data collection.
Best Practices
Enter job data consistently — use the same spelling for staff names, service types, and client names to keep charts clean. Update the Data Sheet daily or after each job to maintain accurate KPI cards. Use the slicers on the Overview page during weekly team meetings to review performance by staff member or service area. Archive completed months by saving a copy of the file at month-end to preserve historical snapshots.
Also explore related templates like the Facility Cleaning and Sanitization Calendar in Excel for scheduling, or the Office Cleaning Request Tracker in Google Sheets for managing incoming cleaning requests.
Explore Relevant Templates
📌 Cleaning Services KPI Dashboard in Power BI — Track cleaning KPIs with advanced Power BI visuals and drill-through filters.
📌 Dry Clean Service Management System V1.0 — A complete VBA-based management system for dry cleaning businesses in Excel.
📌 Facility Cleaning and Sanitization Calendar in Excel — Schedule and track facility cleaning tasks.
📌 Office Cleaning Request Tracker in Google Sheets — Manage and track cleaning service requests.
📌 Browse all Google Sheets Dashboard Templates
Frequently Asked Questions
Cleaning Service Dashboard in Google Sheets
What KPIs does the Cleaning Service Dashboard track?
The Cleaning Service Dashboard in Google Sheets tracks 4 key performance indicators: Total Revenue, Completed Jobs, Average Rating, and Average Job Value. All metrics update automatically when you replace the sample data with your own records.
How long does it take to set up?
Setup takes under 10 minutes. Click the Google Sheets copy link from the PDF guide, paste your cleaning job data into the Data Sheet, and every dashboard page — Overview, Services, Staff, and Clients — updates instantly.
Can I use this on my phone or tablet?
Yes. The Cleaning Service Dashboard works on any device with the free Google Sheets app. You can view KPIs, filter charts with slicers, and look up individual jobs on mobile or tablet browsers.
How does this compare to Jobber or ZenMaid?
Jobber starts at $49/month and ZenMaid at $49/month. The Cleaning Service Dashboard in Google Sheets costs $9.99 one-time with no monthly fees. It covers revenue analytics, staff tracking, and client insights — areas where SaaS tools charge premium tiers.
Can I customize the charts and add new metrics?
Yes, every chart, formula, and layout is fully editable in Google Sheets. You can add new columns to the Data Sheet, create additional charts, or modify existing KPI calculations to match your business needs.
Does it support multiple staff members?
Yes. The Staff Analysis page tracks revenue, average rating, job count, and average duration per staff member. There is no limit on how many staff entries you can add to the Data Sheet.
Is the data secure in Google Sheets?
Your copy lives in your personal Google Drive with Google’s enterprise-grade security. Only people you explicitly share the file with can access your data. No third-party servers are involved.
About the Author
Built by PK — Microsoft Certified Professional with 15+ years of Excel, Google Sheets, and Power BI experience. Founder of NextGenTemplates, reaching 300K+ subscribers across YouTube channels. Every template is hand-built and tested before release.
Conclusion
The Cleaning Service Dashboard in Google Sheets gives cleaning business owners and managers a clear, data-driven view of revenue, staff performance, service profitability, and client insights — all for a $9.99 one-time purchase with no monthly fees.
✅ Instant download · One-time payment · No subscription · Lifetime access
👉 Youtube.com/@NeoTechNavigators