Petroleum Industry KPI Scorecard in Google Sheets is a ready-to-use performance tracking template for oil, gas, refining, and energy operations teams that need a clear monthly view of operational, safety, capacity, and revenue KPIs. The workbook brings 10 petroleum KPIs, 5 working sheet pages, 4 KPI trend comparison views, and 3 Red-Amber-Green status levels into one editable Google Sheets scorecard.Petroleum Industry KPI Scorecard in Google Sheets
This template is built for teams that want a practical scorecard without building formulas, slicers, KPI definitions, and chart layouts from scratch. It supports MTD and YTD review, actual vs target analysis, actual vs previous year analysis, and monthly KPI trend monitoring from the same structured data model.Petroleum Industry KPI Scorecard in Google Sheets
Get the Petroleum Industry KPI Scorecard in Google Sheets
View the Petroleum Industry KPI Scorecard in Google Sheets to use it as a petroleum operations scorecard, refinery KPI tracker, oil and gas performance dashboard, or executive reporting template.Petroleum Industry KPI Scorecard in Google Sheets
Key Features of Petroleum Industry KPI Scorecard in Google Sheets
- 10 executive KPI cards: Track Total Oil Production, Refining Utilization Rate, Gas Production, Production Downtime, Energy Consumption, Refining Margin, Capacity Utilization Rate, LTIFR, TRIR, and Revenue Generated.
- MTD and YTD performance views: Switch between monthly performance and year-to-date performance for a faster operating review.Petroleum Industry KPI Scorecard in Google Sheets
- Actual vs Target and Actual vs PY analysis: Compare petroleum KPIs against targets or previous-year values depending on the review meeting.Petroleum Industry KPI Scorecard in Google Sheets
- Red, Amber, and Green status indicators: Identify strong, moderate, and weak performance quickly using configurable RAG thresholds.
- KPI definition master: Maintain KPI Group, KPI Name, Unit, Formula, Definition, and Type in one settings sheet.
- Structured data sheet: Enter KPI values in repeatable monthly blocks using MTD Actual, MTD Target, MTD PY, YTD Actual, YTD Target, and YTD PY columns.
- Google Sheets-native workflow: Use familiar spreadsheet controls and apply your own sharing, filtering, and collaboration processes. Google also provides an official helpPetroleum Industry KPI Scorecard in Google Sheets guide for sorting and filtering data in Google Sheets.
Dashboard Pages Explanation
Overview Page
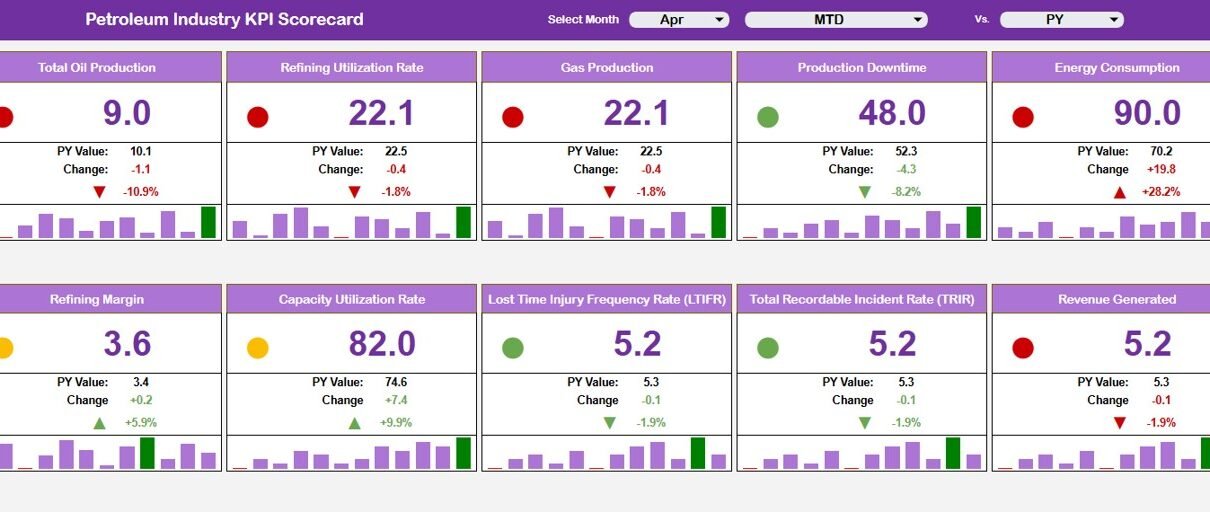
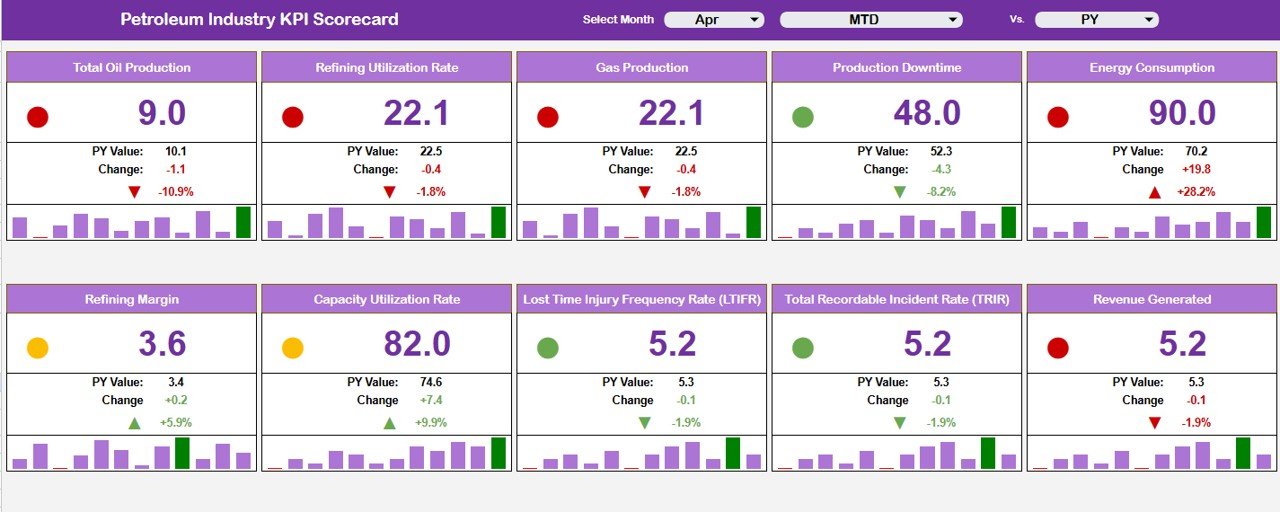
The Overview page gives a high-level performance snapshot for petroleum operations. At the top of the sheet, the scorecard displays KPI cards for Total Oil Production, Refining Utilization Rate, Gas Production, Production Downtime, Energy Consumption, Refining Margin, Capacity Utilization Rate, Lost Time Injury Frequency Rate, Total Recordable Incident Rate, and Revenue Generated.Petroleum Industry KPI Scorecard in Google Sheets
Each card shows the current value, PY value, change, change percentage, monthly trend, and a Red, Amber, or Green status indicator. The page also includes slicers for Select Month, MTD or YTD, and Vs. PY or Target, so managers can filter the dashboard quickly without editing formulas.Petroleum Industry KPI Scorecard in Google Sheets
Overview Page Charts
- Monthly Trend by Total Oil Production: This chart shows how oil production changes across months. It helps teams spot production dips, recoveries, and seasonal movement before they become larger performance issues.Petroleum Industry KPI Scorecard in Google Sheets
- Monthly Trend by Refining Utilization Rate: This chart tracks how effectively refining capacity is being used. It helps compare utilization patterns against operating expectations and maintenance periods.Petroleum Industry KPI Scorecard in Google Sheets
- Monthly Trend by Gas Production: This chart highlights monthly gas production performance. It supports quick comparison of production growth, volatility, and underperformance by period.
- Monthly Trend by Production Downtime: This chart shows downtime movement month by month. Because downtime is usually a lower-the-better KPI, spikes can trigger follow-up on maintenance, reliability, or operational interruptions.
- Monthly Trend by Energy Consumption: This chart tracks energy consumption across the selected months. It helps teams monitor efficiency pressure and review whether production activity is consuming more energy than expected.
- Monthly Trend by Refining Margin: This chart shows the monthly direction of refining margin. It helps commercial and operations teams understand whether margins are improving, declining, or remaining stable.
- Monthly Trend by Capacity Utilization Rate: This chart displays how total available capacity is being used over time. It helps identify idle capacity, constraint periods, and utilization improvements.
- Monthly Trend by Lost Time Injury Frequency Rate (LTIFR): This chart tracks lost-time injury frequency by month. Since safety KPIs are usually lower-the-better, rising movement should prompt immediate safety review.
- Monthly Trend by Total Recordable Incident Rate (TRIR): This chart monitors total recordable incidents over time. It helps safety teams review incident trends alongside production and utilization activity.
- Monthly Trend by Revenue Generated: This chart shows monthly revenue performance. It helps connect operational performance with commercial results and revenue movement.
KPI Trend Page
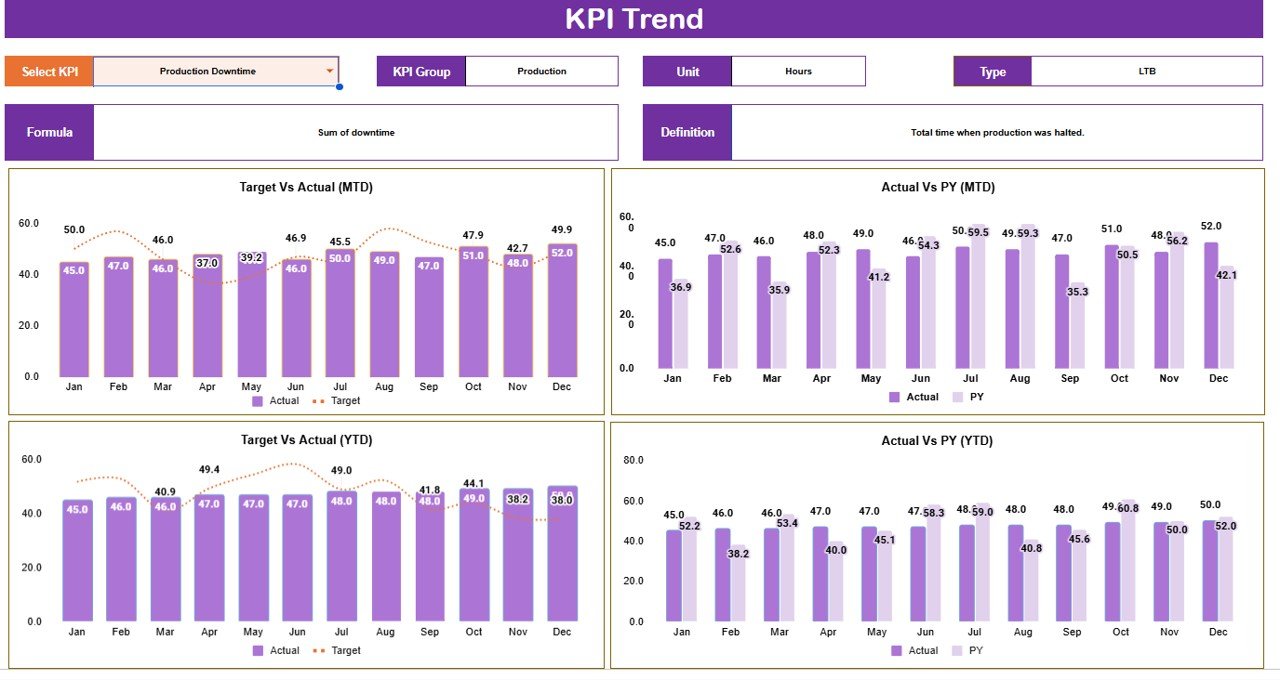
The KPI Trend sheet provides a focused view for one selected KPI at a time. At the top of the page, a Select KPI dropdown automatically displays the KPI Group, Unit, Type, Formula, and Definition for the chosen metric.
The page includes Actual vs Target by Month for MTD, Actual vs PY by Month for MTD, Actual vs Target by Month for YTD, and Actual vs PY by Month for YTD. This makes it easier to review both short-term movement and year-to-date performance in the same tab.
Data Sheet Tab
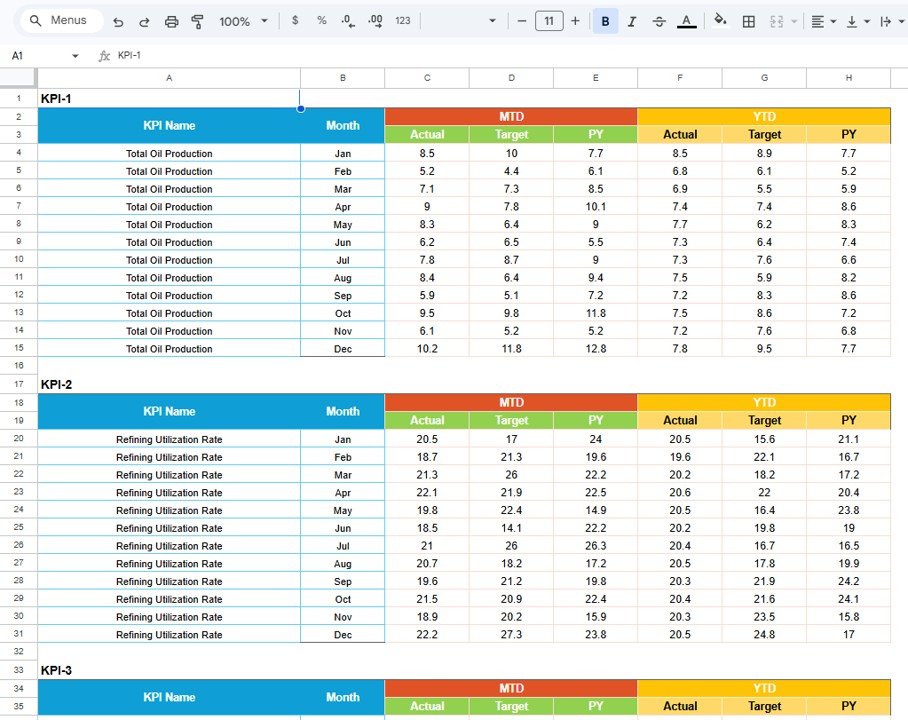
The Data sheet is where users enter and maintain the scorecard values. Every KPI has its own block, with the month listed down the side and columns for MTD Actual, MTD Target, MTD PY, YTD Actual, YTD Target, and YTD PY.
This block-based layout keeps the scorecard easy to update and audit. It also helps users separate monthly actuals, targets, and prior-year benchmarks without mixing different KPI structures.
KPI Setting Sheet
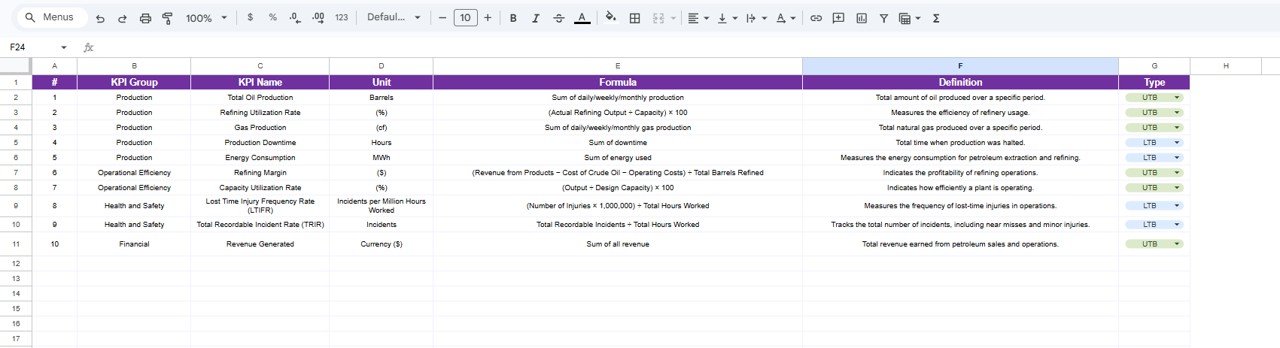
The KPI Setting sheet works as the KPI master for the full scorecard. Users can maintain KPI Group, KPI Name, Unit, Formula, Definition, and Type for every petroleum performance indicator.
The Type field supports Upper the Better and Lower the Better logic. This is important because a higher refining margin is usually favorable, while a higher downtime, LTIFR, or TRIR value is usually unfavorable.
RAG Setting Sheet
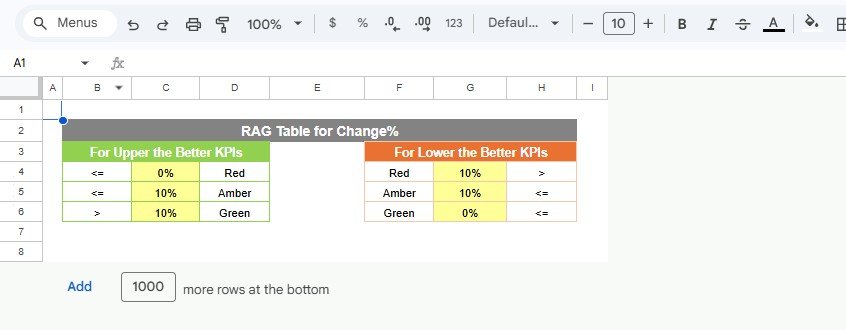
The RAG Setting sheet controls the Red, Amber, and Green thresholds for Change %. Users can set different rules for Upper the Better KPIs and Lower the Better KPIs.
Once the thresholds are adjusted, the scorecard status indicators follow the updated performance rules automatically. This gives teams flexibility to align the template with their own operating targets, risk tolerance, and reporting standards.
Petroleum Industry KPI Scorecard in Google Sheets vs. Excel KPI Workbook vs. Paid Operations SaaS – Feature Comparison
| Feature | Google Sheets KPI Scorecard | Excel KPI Workbook | Paid Operations SaaS |
|---|---|---|---|
| Best for | Collaborative KPI tracking and cloud-based review | Offline spreadsheet reporting and local analysis | Enterprise workflows with system integrations |
| Setup speed | Fast, template-based setup | Fast if Excel is the main reporting tool | Longer onboarding and configuration |
| Cost model | One-time template purchase | One-time template purchase | Recurring subscription or implementation cost |
| Customization | Editable KPI settings, formulas, thresholds, and data tabs | Editable workbook formulas and reports | Usually configurable, sometimes limited by plan |
| Collaboration | Strong for shared online review | Depends on file storage and sharing setup | Strong for larger teams with role workflows |
| Technical requirement | Google Sheets knowledge | Excel knowledge | Admin setup, implementation, and user training |
Who Should Use This Template
- Petroleum operations managers who need a monthly KPI scorecard.
- Refinery teams tracking utilization, margins, downtime, safety, and capacity.
- Oil and gas analysts preparing MTD and YTD reporting packs.
- Energy business owners who want an editable Google Sheets performance tracker.
- Consultants creating KPI dashboards for petroleum, refining, or industrial clients.
Real-World Use Cases
- Monthly operations review: Use the Overview page to discuss production, utilization, safety, and revenue in one meeting.
- Safety performance monitoring: Track LTIFR and TRIR with lower-the-better RAG rules and monthly trends.
- Refining performance review: Compare refining utilization, capacity utilization, and refining margin across MTD and YTD views.
- Executive reporting: Share a concise scorecard with current values, previous-year comparison, and trend direction.
- Target tracking: Review whether each KPI is ahead of or behind target for the selected month or year-to-date period.
Advantages
- Reduces manual dashboard setup time for petroleum KPI reporting.
- Combines operational, safety, capacity, energy, and revenue KPIs in one scorecard.
- Allows teams to adjust KPI definitions and RAG rules without rebuilding the dashboard.
- Works well for recurring performance reviews because the structure is consistent month after month.
- Uses Google Sheets, making it accessible for teams that prefer cloud-based spreadsheet reporting.
Opportunities for Improvement
- Connect the data sheet to an internal source system if your team wants automated refreshes.
- Add site, plant, refinery, or business unit slicers if the scorecard is used across multiple locations.
- Include comments or action-owner columns if the template becomes part of a formal review process.
- Add variance explanations for large changes so each monthly review includes context, not only numbers.
Best Practices
- Confirm every KPI definition with operations, finance, and safety stakeholders before publishing the first scorecard.
- Review whether each KPI should be Upper the Better or Lower the Better before setting RAG thresholds.
- Update data on a consistent monthly schedule so MTD and YTD views remain reliable.
- Keep a protected master copy before making structural changes to formulas or sheet layouts.
- Use the KPI Trend tab during review meetings when one metric needs deeper analysis.
Explore Relevant Templates
- Petroleum Industry KPI Scorecard in Google Sheets
- Energy Trading KPI Dashboard in Google Sheets
- Petroleum Industry KPI Dashboard in Excel
- Oil and Gas Analysis Dashboard in Excel
- Industrial Gas Production Dashboard in Excel
Want to build skills like this step by step? The Excel Pivot Tables & Dashboards course on NextGenTemplates Academy walks you through it with practice files.
Get the Petroleum Industry KPI Scorecard in Google Sheets
FAQs
What is included in the Petroleum Industry KPI Scorecard in Google Sheets?
The template includes an Overview page, KPI Trend page, Data sheet tab, KPI Setting sheet, and RAG Setting sheet. It tracks 10 petroleum KPIs with MTD, YTD, target, previous-year, trend, and RAG status views.
Can I edit the KPI names and definitions?
Yes. The KPI Setting sheet lets you maintain the KPI group, KPI name, unit, formula, definition, and KPI type for the scorecard.
Does the scorecard support actual vs target comparison?
Yes. The KPI Trend page includes Actual vs Target by Month for both MTD and YTD views.
Can I compare current KPI performance against previous year?
Yes. The scorecard includes PY comparison fields and Actual vs PY trend views for MTD and YTD reporting.
Can I change the Red, Amber, and Green rules?
Yes. The RAG Setting sheet lets you adjust Change % thresholds separately for Upper the Better and Lower the Better KPIs.
Is this template suitable for refinery performance reporting?
Yes. It includes refining utilization, capacity utilization, refining margin, energy consumption, downtime, safety, production, and revenue KPIs that are useful for petroleum and refinery reporting.
About Author
NextGenTemplates creates practical Excel and Google Sheets templates for business dashboards, KPI scorecards, trackers, calendars, and reporting workflows. The goal is to help teams save setup time and start with clean, editable spreadsheet systems that can be adapted to real business operations.
Conclusion
The Petroleum Industry KPI Scorecard in Google Sheets is a useful template for petroleum, oil and gas, refinery, and energy teams that need a structured scorecard without starting from a blank spreadsheet. With 10 KPI cards, MTD and YTD views, KPI trend analysis, editable settings, and configurable RAG thresholds, it gives teams a clear way to review operational performance month after month.
Get the Petroleum Industry KPI Scorecard in Google Sheets from NextGenTemplates.