AI and machine learning teams often have strong technical reporting but weak KPI visibility. Model accuracy, precision, recall, F1 score, training time, inference time, data imbalance, MAE, MSE and RMSE may live in separate notebooks, experiment logs, BI reports or ad hoc updates. The AI and Machine Learning KPI Scorecard In Google Sheets brings those measures into one editable scorecard built for monthly review.
This template includes 5 structured Google Sheets tabs, 10 high-level KPI cards, 10 monthly overview charts, 4 target/prior-year trend comparisons and 2 RAG status rule sets. It is priced at $8.99 during the sale, compared with the regular price of $16.99, making it a lightweight option for teams that need KPI discipline without buying a full MLOps platform for every stakeholder.
Get the AI and Machine Learning KPI Scorecard In Google Sheets
Key Features of AI and Machine Learning KPI Scorecard In Google Sheets
The scorecard is designed for AI leads, machine learning engineers, data science managers, analytics teams and founders who need a practical performance view. Instead of building KPI review tabs from scratch, users can update monthly values and immediately review scorecard cards, trend charts, target gaps and status colors.
- Google Sheets format: easy to edit, share and duplicate for different models, teams or business units.
- 10 core AI/ML KPI cards: quick visibility into model quality, error, speed and data health.
- Monthly trend charts: track whether model metrics are improving, declining or becoming unstable over time.
- Target vs actual views: compare current performance against KPI targets for both MTD and YTD analysis.
- Prior-year comparisons: show how current performance compares with the same period from the previous year.
- RAG status setup: classify change percentages using red, amber and green rules for higher-is-better and lower-is-better KPIs.
- KPI definition setup: document group, unit, formula, definition and metric type so users understand what each KPI means.
Dashboard Pages Explanation
1. Overview Page
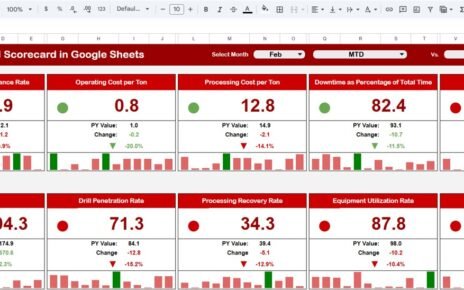
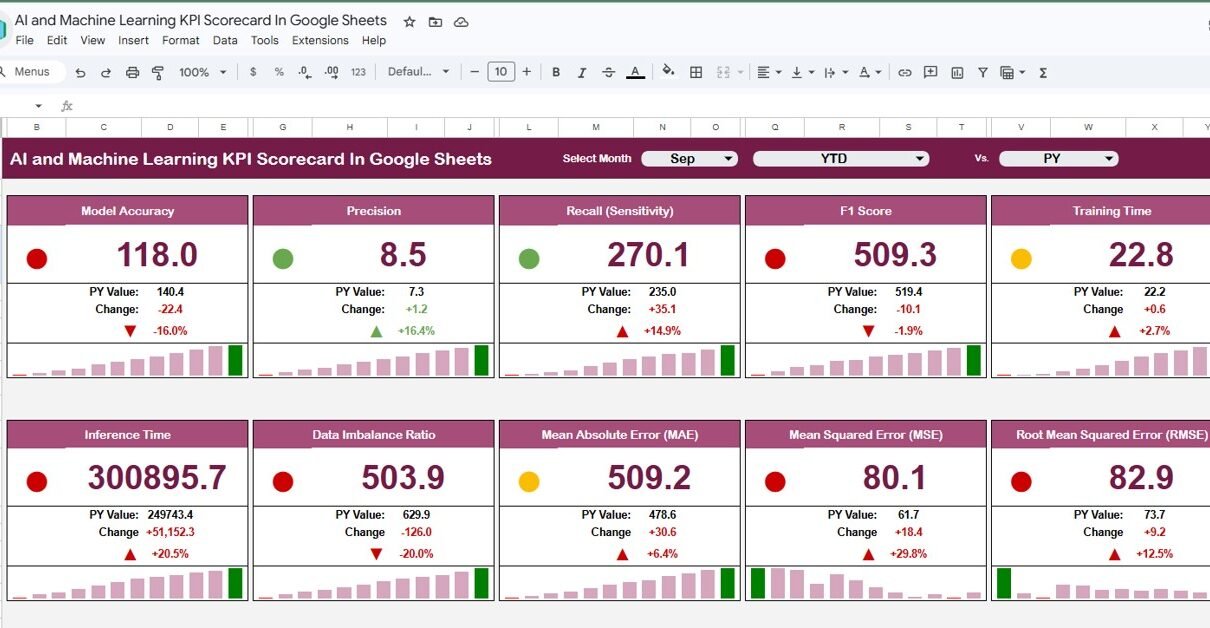
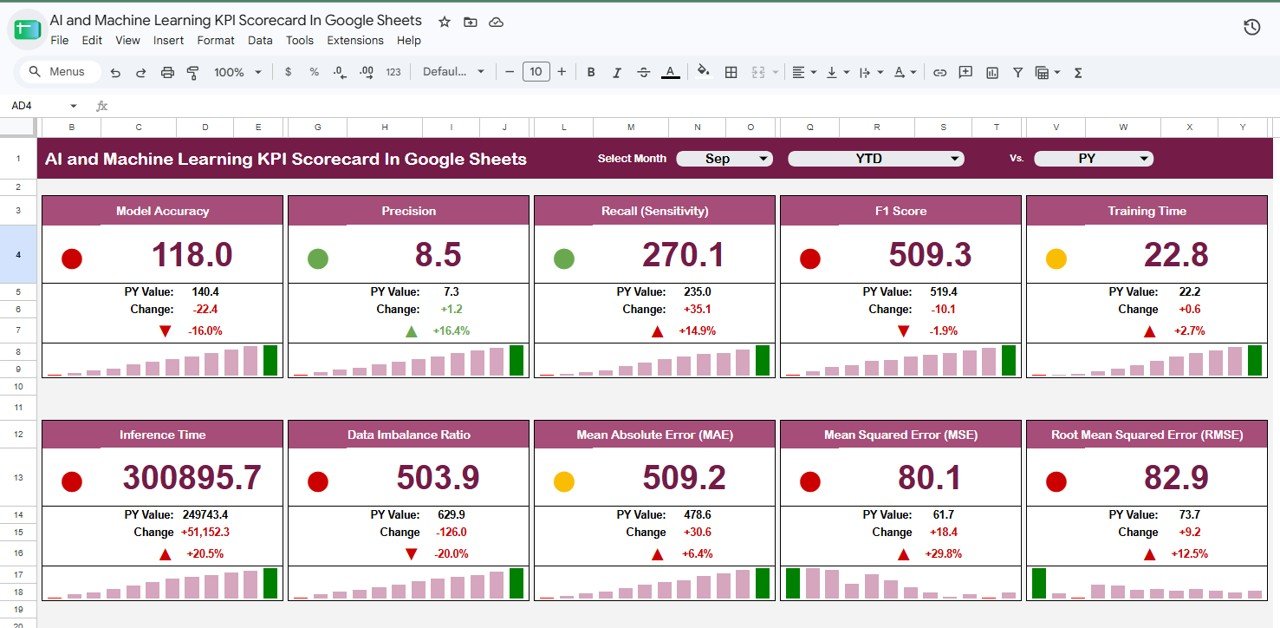
The Overview page is the executive-facing tab for quick performance review. At the top of the sheet, the scorecard displays KPI cards for Model Accuracy, Precision, Recall (Sensitivity), F1 Score, Training Time, Inference Time, Data Imbalance Ratio, Mean Absolute Error (MAE), Mean Squared Error (MSE) and Root Mean Squared Error (RMSE).
The chart section turns those cards into monthly movement. Model Accuracy by Month shows whether the model is becoming more reliable over time, while Precision by Month highlights how consistently positive predictions are correct. Recall (Sensitivity) by Month helps teams monitor missed positive cases, and F1 Score by Month balances precision and recall in a single review metric.
Training Time by Month and Inference Time by Month help teams watch efficiency as model size, data volume or infrastructure changes. Data Imbalance Ratio by Month flags whether the training or evaluation population is drifting toward uneven class distribution. MAE, MSE and RMSE by Month give regression teams a clean view of error movement and whether prediction quality is improving.
2. KPI Trend
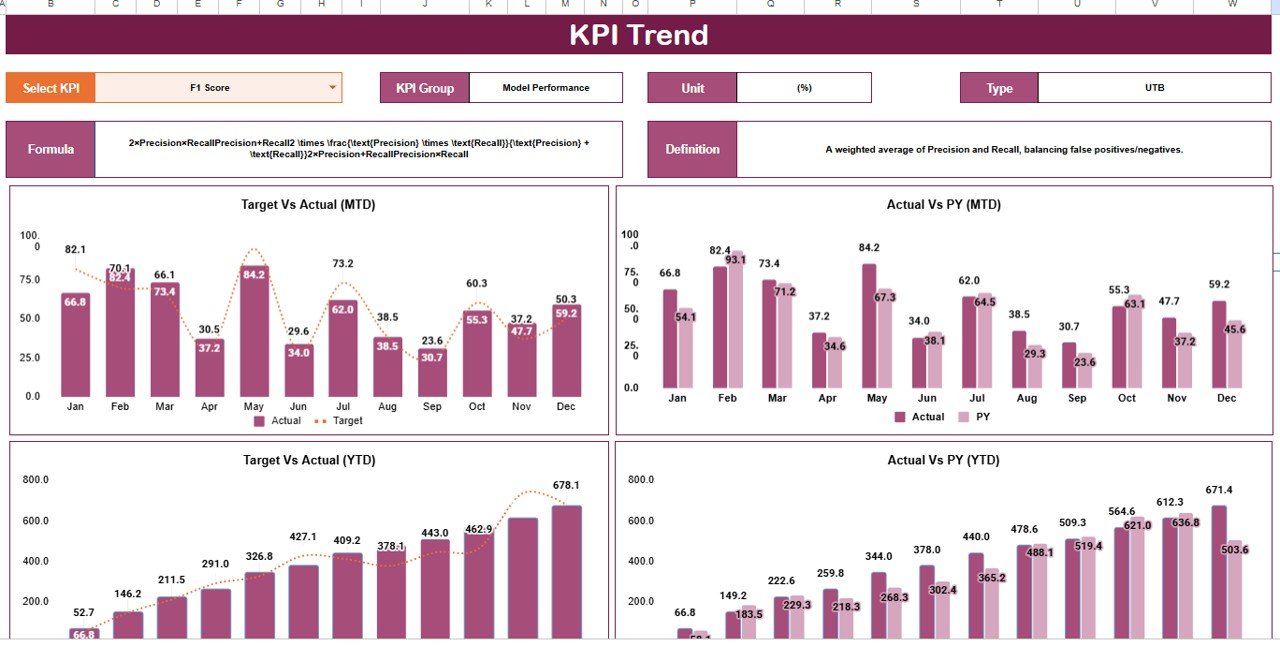
The KPI Trend tab focuses on comparison analysis. It includes Target Vs Actual by Month (MTD), Actual Vs PY by Month (MTD), Target Vs Actual by Month (YTD) and Actual Vs PY by Month (YTD), giving users a clear view of current performance against goals and historical baselines.
3. KPI Data Sheet
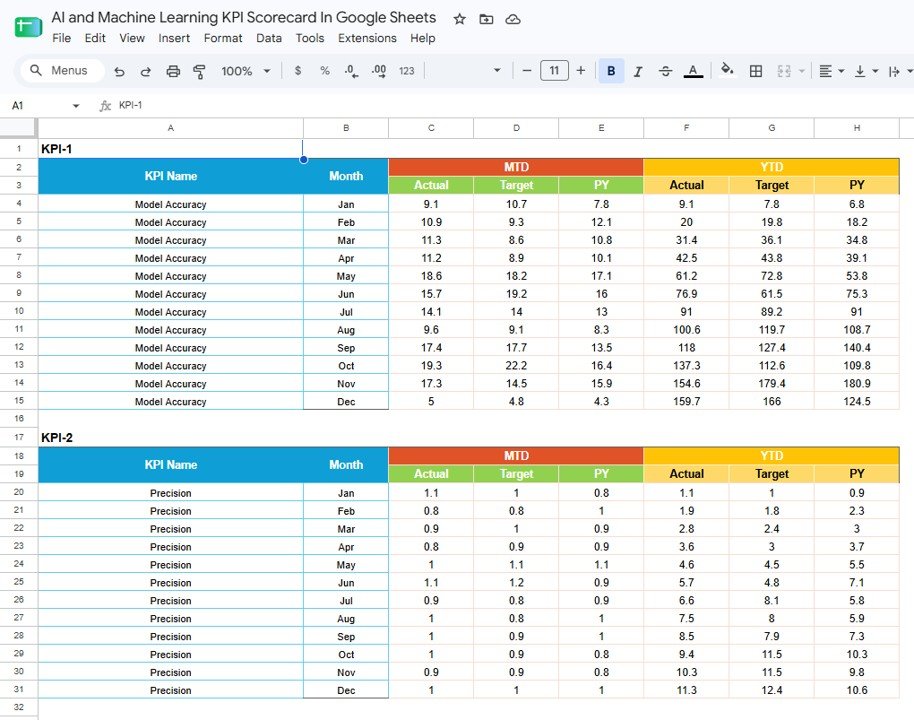
The KPI Data Sheet tab organizes the underlying performance records. It includes MTD Actual Target and PY by Month, YTD Actual Target and PY by Month, Model Accuracy by Month, Precision by Month and KPI Records by KPI Name, making it easier to review the data behind the scorecard.
4. KPI Definition Setup
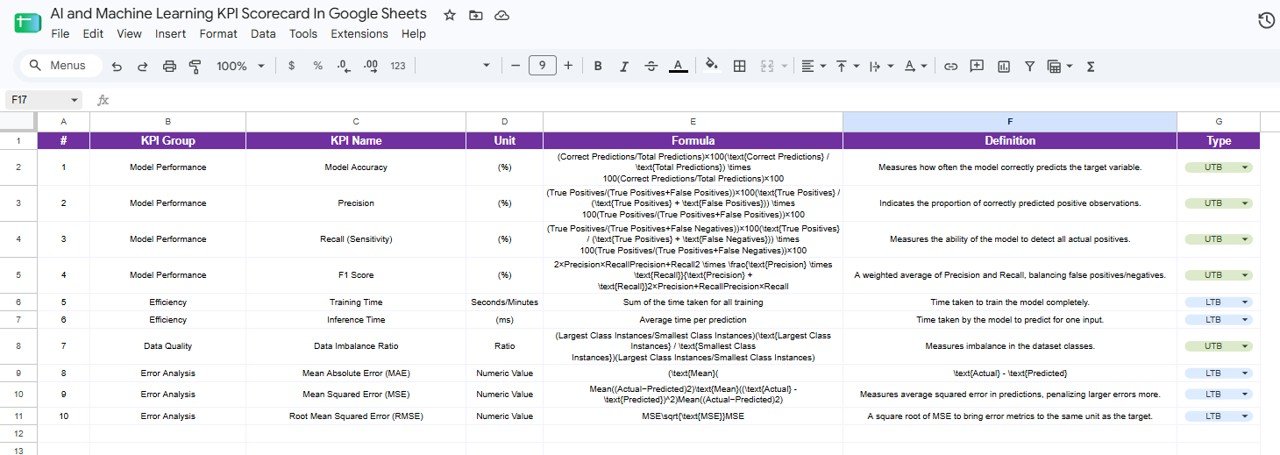
The KPI Definition Setup tab keeps metric governance visible. It includes KPI Group by KPI Name, Unit by KPI Name, Formula by KPI Name, Definition by KPI Name and Type by KPI Name, helping teams avoid confusion when multiple stakeholders review the same scorecard.
5. RAG Table for Change%
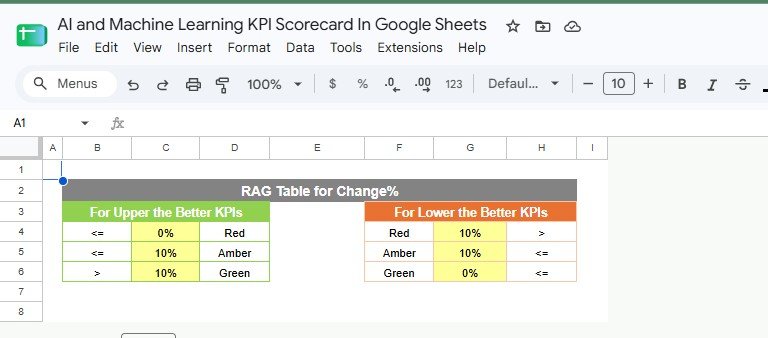
The RAG Table for Change% tab supports simple status logic. It includes Status Color by Change % for Upper the Better KPIs and Status Color by Change % for Lower the Better KPIs, so users can classify changes correctly depending on whether an increase is good or bad.
AI and Machine Learning KPI Scorecard In Google Sheets vs. Microsoft Excel Scorecard vs. Paid MLOps/SaaS – Feature Comparison
| Feature | Google Sheets KPI Scorecard | Microsoft Excel Scorecard | Paid MLOps/SaaS |
|---|---|---|---|
| Best use case | Shared KPI review and lightweight monthly reporting | Offline analysis and internal spreadsheet reporting | Production-grade model operations and monitoring |
| Collaboration | Easy browser-based sharing | Strong desktop workflow, less native live collaboration | Strong team access controls and integrations |
| Setup effort | Low | Low to medium | Medium to high |
| Cost | One-time template purchase | Requires Excel or Microsoft 365 | Usually subscription-based |
| KPI governance | Built-in KPI definition setup | Depends on workbook design | Usually configurable but more complex |
| Production monitoring | Manual or connected through imports | Manual or connected through imports | Often automated and integrated |
This template is not a replacement for full production monitoring. Instead, it fills the reporting layer where teams need a clear, editable scorecard for monthly performance conversations, leadership updates and KPI documentation.
Who Should Use This Template
This scorecard is useful for AI product teams, machine learning teams, data science managers, analytics consultants, SaaS founders and operations leaders tracking model performance. It works especially well when stakeholders need a readable KPI view but do not need direct access to model pipelines or experiment tracking tools.
It is also helpful for students, trainers and consultants who need a professional AI KPI example in Google Sheets. Because the workbook includes KPI definitions and RAG status logic, it can be adapted for classification models, regression models, forecasting workflows, recommendation systems and AI-enabled business processes.
Real-World Use Cases
- Monthly AI governance review: summarize model performance, error, speed and status in one recurring scorecard.
- Model improvement tracking: compare accuracy, precision, recall and F1 score before and after model updates.
- Client reporting: give consulting clients a clean Google Sheets scorecard for AI/ML performance discussions.
- Operational monitoring: monitor inference time, training time and data imbalance ratio as model workloads change.
- Regression quality review: track MAE, MSE and RMSE trends to understand prediction error movement.
Advantages of AI and Machine Learning KPI Scorecard In Google Sheets
The biggest advantage is speed. Teams can start from a structured KPI scorecard instead of designing tabs, cards, chart logic and definitions from a blank sheet. The workbook also supports a practical review rhythm: update the data, check the cards, inspect the trend tabs, review the RAG status and use the definition setup to keep everyone aligned.
Google Sheets also makes the template easy to share. A technical owner can maintain the data while business stakeholders review performance without needing a specialized analytics platform. For small teams, agencies and consultants, that simplicity can be more valuable than a complex tool that only technical users understand.
Opportunities for Improvement
The template is intentionally lightweight. Teams with real-time monitoring needs may still need automated data pipelines, model registries, alerting systems and experiment tracking platforms. Users may also want to connect the sheet to BigQuery, CSV exports, Python outputs or manual monthly snapshots depending on their data stack.
Another improvement opportunity is customization. Different AI systems need different KPI weights. A classification model may prioritize recall, while a recommendation model may prioritize conversion lift, latency or engagement quality. The included KPI setup tab makes it easier to adjust formulas, definitions and metric types for your use case.
Best Practices
Start by defining the purpose of each KPI before updating values. For example, Model Accuracy can be useful, but it can also hide poor performance on minority classes. Precision, Recall and F1 Score should be reviewed together so teams understand the trade-off between false positives and false negatives.
For production models, pair spreadsheet reporting with formal monitoring. Google Cloud’s Model Monitoring documentation explains how scheduled or on-demand monitoring can track drift, skew and thresholds for operational model oversight. A spreadsheet scorecard is excellent for stakeholder review, while monitoring tools help detect issues closer to the production system.
Finally, keep the KPI Definition Setup tab updated. If a formula changes, update the definition immediately. If a KPI is higher-is-better or lower-is-better, confirm that the RAG table reflects that logic. This protects the scorecard from becoming visually impressive but analytically confusing.
Explore Relevant Templates
- AI & Machine Learning KPI Dashboard in Google Sheets
- Artificial Intelligence AI Dashboard in Google Sheets
- Machine Learning Labs KPI Dashboard in Power BI
- Google Analytics KPI Dashboard in Google Sheets
- Web Development KPI Dashboard in Google Sheets
Want to get comfortable building scorecards and dashboards yourself? The Excel Pivot Tables & Dashboards course on NextGenTemplates Academy walks through the reporting side step by step, with practice files.
Get the AI and Machine Learning KPI Scorecard In Google Sheets
Frequently Asked Questions
Is this an automated AI monitoring tool?
No. It is a Google Sheets KPI scorecard for reporting, review and performance tracking. You can update it manually or adapt it to imported data from your workflow.
Which KPIs are included?
The scorecard includes Model Accuracy, Precision, Recall (Sensitivity), F1 Score, Training Time, Inference Time, Data Imbalance Ratio, MAE, MSE and RMSE.
Can I customize the KPI definitions?
Yes. The KPI Definition Setup tab is designed so you can edit KPI group, unit, formula, definition and metric type.
Does it work for both classification and regression models?
Yes. Classification KPIs such as precision, recall and F1 score are included, along with regression error metrics such as MAE, MSE and RMSE.
Is the template suitable for client reporting?
Yes. The overview, trend tabs and clear KPI definitions make it suitable for recurring client updates, consulting deliverables and internal leadership reviews.
About the Author
NextGenTemplates creates practical spreadsheet dashboards, scorecards and business templates for professionals who want ready-to-use reporting systems without building every workbook from scratch. The focus is on clean layouts, useful KPIs and templates that can be adapted for real business workflows.
Conclusion
The AI and Machine Learning KPI Scorecard In Google Sheets gives AI and ML teams a focused way to track model performance, monthly movement, target gaps, prior-year comparison and RAG status. With 5 pages, 10 KPI cards and a structured definition setup, it is a practical option for teams that need visibility without overcomplicating the reporting layer.
If you need a Google Sheets scorecard for machine learning KPIs, model performance reviews or AI project reporting, this template gives you a strong starting point at an accessible one-time price.