The Smart Cities KPI Scorecard in Google Sheets is built for city teams that need a clear monthly view of urban performance without buying a civic analytics platform. It tracks 10 smart city KPIs across environmental quality, transportation, sustainability and technology, then turns monthly values into red, amber and green status lights, MTD/YTD comparison, prior-year movement and compact 12-month sparklines.
The need is not abstract. The United Nations projects that 68% of the world population will live in urban areas by 2050. More people in cities means more pressure on air quality, mobility, water, energy, waste, digital access and EV readiness. A shareable Google Sheets scorecard gives municipal teams a lightweight way to review those signals every month.
Get the Smart Cities KPI Scorecard in Google Sheets
Key Features of Smart Cities KPI Scorecard in Google Sheets
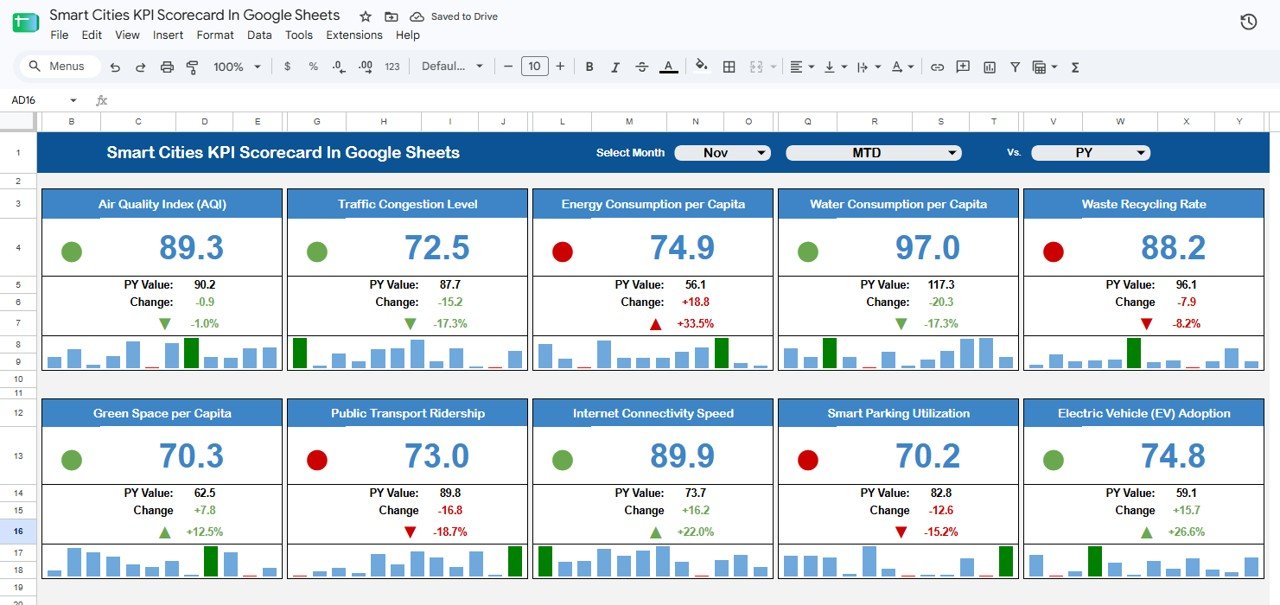
- 10 KPI cards on one page: Air Quality Index, Traffic Congestion Level, Energy Consumption per Capita, Water Consumption per Capita, Waste Recycling Rate, Green Space per Capita, Public Transport Ridership, Internet Connectivity Speed, Smart Parking Utilization and Electric Vehicle Adoption.
- Three scorecard controls: select the reporting month, switch between MTD and YTD, and compare Actual against PY or Target.
- RAG status lights: each card shows a red, amber or green indicator based on the Change% rules.
- Upper-the-better and lower-the-better logic: recycling and EV adoption reward increases, while AQI, congestion and per-capita consumption reward reductions.
- KPI trend page: select one KPI to see its definition and four comparison charts.
- Editable data and definitions: update monthly values, KPI formulas, units, groups and governance notes directly in Google Sheets.
Dashboard Pages Explanation
KPI Scorecard Page
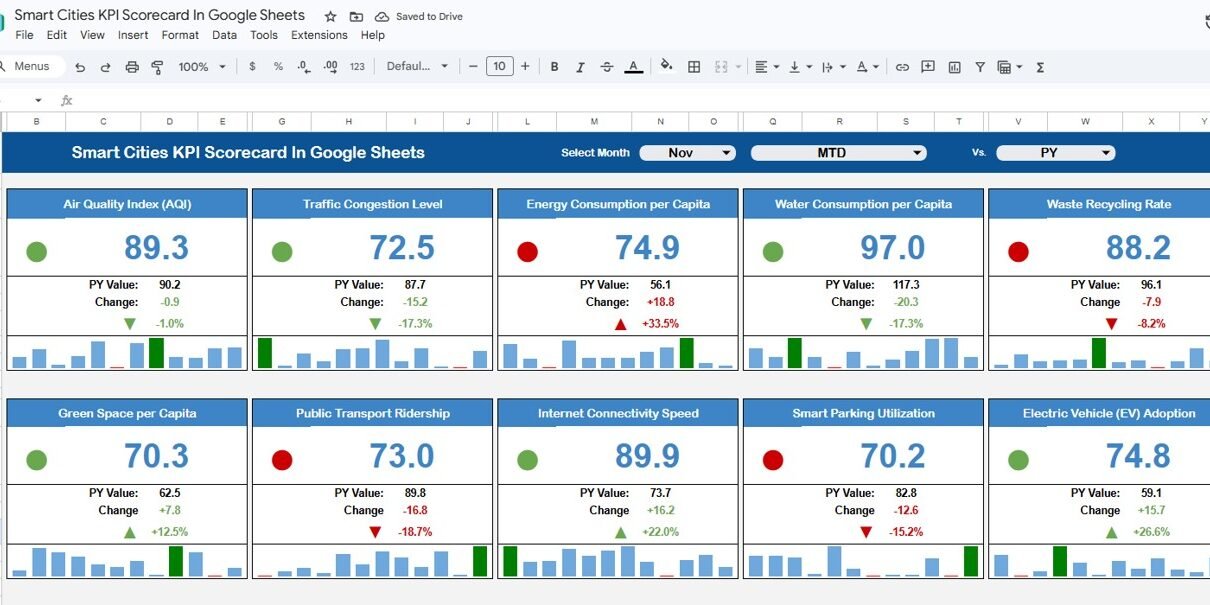
The main scorecard is the executive view. It shows all 10 KPIs in two rows of cards, each with current value, PY value, absolute change, percent change, RAG light and a small monthly bar trend. The top controls let you choose the month, MTD or YTD, and PY or Target comparison. In the sample screenshot, November MTD is compared against PY.
KPI Trend Page
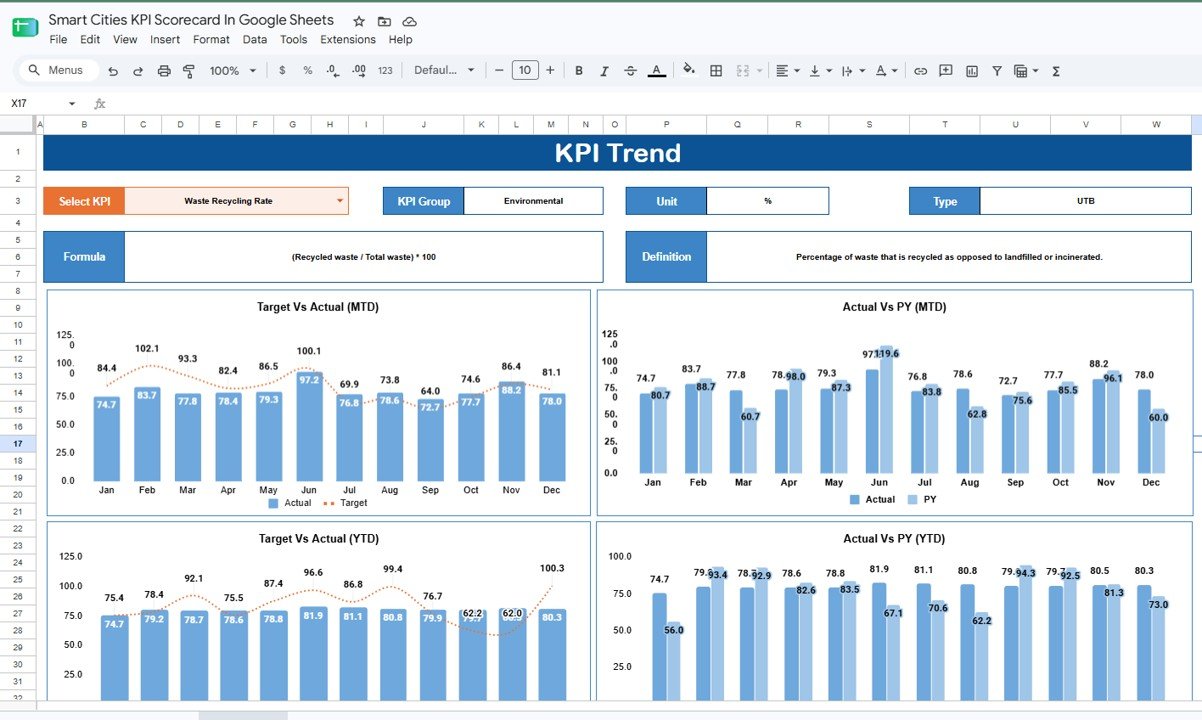
The KPI Trend page focuses on one selected KPI. The screenshot shows Waste Recycling Rate with its KPI group, unit, formula, definition and UTB type. Below the definition area are four charts: Target vs Actual for MTD, Actual vs PY for MTD, Target vs Actual for YTD, and Actual vs PY for YTD. This page is useful when a committee or leadership team wants to understand one metric beyond the traffic light.
KPI Data Sheet
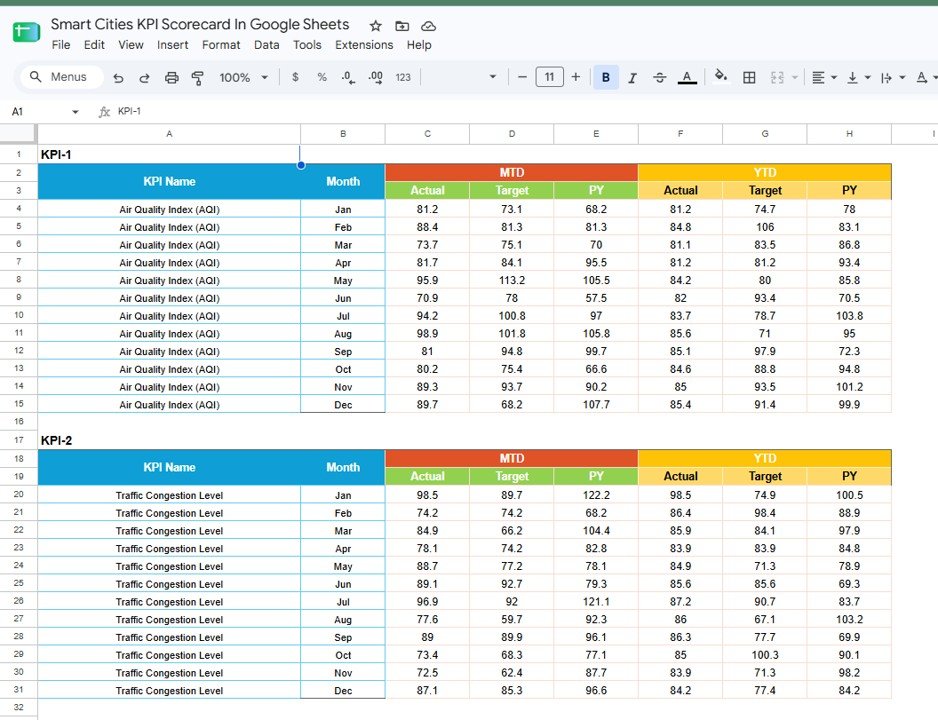
The data sheet is organized by KPI blocks from KPI-1 onward. Each block has January to December rows and columns for MTD Actual, Target and PY plus YTD Actual, Target and PY. This structure makes the template easy to update from a monthly data export or manual entry process. You do not edit the scorecard formulas each month; you update the data sheet and let the visuals refresh.
KPI Definition Sheet
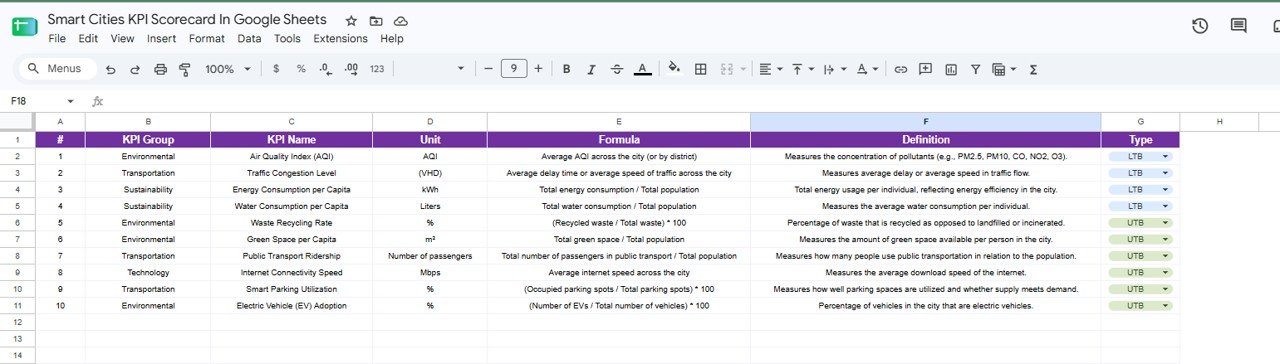
The KPI Definition sheet is the governance layer. It records KPI group, KPI name, unit, formula, definition and type. For example, Waste Recycling Rate is calculated as recycled waste divided by total waste, while EV Adoption is calculated as EVs divided by total vehicles. Lower-the-better indicators include AQI, congestion, energy consumption and water consumption; upper-the-better indicators include recycling, green space, transit ridership, internet speed, smart parking and EV adoption.
RAG Table for Change%
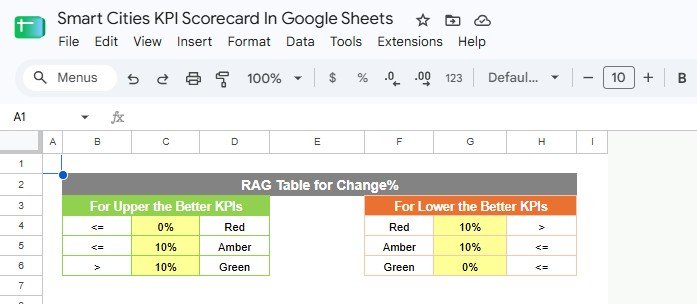
The RAG table explains the status logic. Upper-the-better KPIs turn green when change is above 10%, amber up to 10%, and red at 0% or below. Lower-the-better KPIs reverse that logic so a reduction in congestion or consumption is treated as good performance. If your reporting framework uses different thresholds, you can adjust the table.
Smart Cities KPI Scorecard in Google Sheets vs. Microsoft Excel Scorecard vs. Paid Civic Analytics SaaS – Feature Comparison
| Feature | Google Sheets scorecard | Microsoft Excel scorecard | Paid civic analytics SaaS |
|---|---|---|---|
| Cost | $8.99 one-time | Template cost plus Excel access | Subscription or quote-based |
| Platform | Google Sheets in the browser | Desktop Excel or Microsoft 365 | Vendor cloud portal |
| Setup time | Under 10 minutes | 15-30 minutes | Days to weeks |
| Real-time team collaboration | Native Google sharing | OneDrive co-authoring if configured | Seat-based access |
| Mobile access | Google Sheets app | Excel mobile app | Vendor dependent |
| Customizable fields | KPI names, formulas, definitions and RAG rules | Editable but file-controlled | Usually admin-controlled |
| Share with link | Yes | Yes through cloud storage | Usually requires login |
| Year-1 cost at 5 users | $8.99 total | Template cost plus licenses | Often hundreds or thousands |
| Best use case | Monthly smart city performance review | Offline or Microsoft-centric reporting | Automated enterprise data pipelines |
Who Should Use This Template
This template is a fit for municipal performance teams, smart city program managers, sustainability analysts, transportation planners, public works leaders, digital infrastructure teams and consultants preparing recurring city KPI updates. It works especially well when the team already has monthly numbers but lacks a clean review format.
It is not a live operations platform. The template does not connect to IoT devices, GIS tools, traffic cameras, smart meters, permitting systems or SCADA feeds. It is a reporting layer for data you enter or paste into the sheet.
Real-World Use Cases
Monthly smart city steering committee: The program manager updates all 10 KPIs before the meeting and uses the scorecard page to show which indicators improved, declined or stayed flat against prior year.
Sustainability reporting: The sustainability analyst focuses on Waste Recycling Rate, Green Space per Capita, Water Consumption per Capita and Energy Consumption per Capita to prepare a monthly environmental snapshot.
Transportation review: The transportation planner watches Traffic Congestion Level and Public Transport Ridership, then uses the KPI Trend page when a single movement needs explanation.
Advantages of Smart Cities KPI Scorecard in Google Sheets
- Fast to deploy: create a copy, enter monthly values and start reviewing the scorecard.
- Transparent logic: formulas, definitions and RAG rules are visible instead of hidden behind a vendor interface.
- Collaboration-ready: Google Sheets sharing supports viewers, commenters and editors. The official Google Docs Editors Help page on collaborating in Sheets explains the sharing workflow.
- Budget friendly: one purchase can support a small review team without per-user fees.
- Flexible governance: teams can revise KPI definitions and thresholds to match their own city reporting standards.
Opportunities for Improvement
The main limitation is manual data entry. If your city needs automated feeds from sensors, fleet systems, meter infrastructure or citizen service platforms, you will need a connector, an import workflow or a separate analytics stack. The scorecard also depends on consistent definitions. If different departments calculate public transport ridership or water consumption differently, align those definitions before relying on the traffic lights.
Another opportunity is adding drill-down pages. This template is intentionally compact, so it does not include district-level maps, neighborhood segmentation or project-level commentary. Those can be added later if your review process needs more detail.
Best Practices
- Define the owner for every KPI. Assign one department or analyst to each data source so monthly updates do not stall.
- Lock the formulas after setup. Protect formula ranges once the template is configured, especially if many people will edit the file.
- Review UTB and LTB types carefully. A KPI such as congestion should not use the same color logic as EV adoption.
- Keep a monthly archive. Duplicate the file or export a PDF after each review so prior reports remain unchanged.
- Use the trend page for exceptions. Open the detailed charts only for KPIs that changed materially or missed expectations.
Explore Relevant Templates
- Smart Cities KPI Scorecard in Google Sheets – the template covered in this article.
- Municipal Services KPI Scorecard in Google Sheets – a close companion for city service delivery KPIs.
- Smart City Surveillance Dashboard in Excel – useful when the focus is public safety monitoring.
- Waste Reduction KPI Dashboard in Google Sheets – deeper sustainability tracking for waste programs.
- Carbon Footprint KPI Dashboard in Google Sheets – emissions-focused reporting for sustainability teams.
Curious how scorecards like this are put together? The Excel Pivot Tables & Dashboards course on NextGenTemplates Academy teaches the reporting techniques step by step, with practice files.
Get the Smart Cities KPI Scorecard in Google Sheets
Frequently Asked Questions
What does the Smart Cities KPI Scorecard in Google Sheets track?
It tracks 10 KPIs: AQI, Traffic Congestion Level, Energy Consumption per Capita, Water Consumption per Capita, Waste Recycling Rate, Green Space per Capita, Public Transport Ridership, Internet Connectivity Speed, Smart Parking Utilization and EV Adoption.
Does it connect to live smart city systems?
No. It is a Google Sheets scorecard for monthly reporting. You can paste or import data, but the template does not include live connectors.
Can I customize the KPIs?
Yes. You can edit KPI names, formulas, units, groups, definitions and upper-the-better or lower-the-better types in the KPI Definition sheet.
Can I compare Actual against Target and prior year?
Yes. The template supports Actual, Target and PY fields for MTD and YTD, and the scorecard controls let you switch comparison views.
Is it suitable for official city reporting?
It can support reporting, but your team should validate source data, definitions, approvals and publication rules before using the numbers in official public documents.
Do I need Excel?
No. The template runs in Google Sheets. After purchase, use the PDF guide to create an editable copy in your own Google Drive.
About the Author
Built by PK – Microsoft Certified Professional with 15+ years of Excel, Google Sheets, and Power BI experience. Founder of NextGenTemplates, reaching 300K+ subscribers across YouTube channels. Every template is hand-built and tested before release.
Conclusion
The Smart Cities KPI Scorecard in Google Sheets gives city teams a practical way to review 10 important urban performance indicators in one shared file. It is not a replacement for live smart city infrastructure, but it is a useful monthly review layer for teams that need clarity, accountability and fast collaboration.
Get the Smart Cities KPI Scorecard in Google Sheets for $8.99, or browse more Google Sheets KPI Dashboard templates.