Influencer reports often fail for a simple reason: campaign details, creator metrics, platform results, and financial outcomes live in separate files. The Influencer Marketing Campaign Performance Dashboard in Google Sheets brings that work into 6 connected tabs with 4 executive cards, 14 charts, and a search view that returns 13 campaign fields from one selected ID.
With this influencer campaign performance dashboard, instead of rebuilding slides for every review, teams can maintain one structured campaign table, use slicers to isolate a segment, and move from a high-level summary to campaign-level detail. The design is intended for agencies, brand teams, creator partnership managers, and small businesses that already collect campaign data manually or through platform exports. It does not promise automatic attribution or API connectivity. Its job is narrower and useful: turn consistent inputs into repeatable campaign reporting in an editable Google Sheets file.
🎥 Watch the Video Tutorial
Get the Influencer Campaign Performance Dashboard
Key Features of the Influencer Marketing Campaign Performance Dashboard in Google Sheets
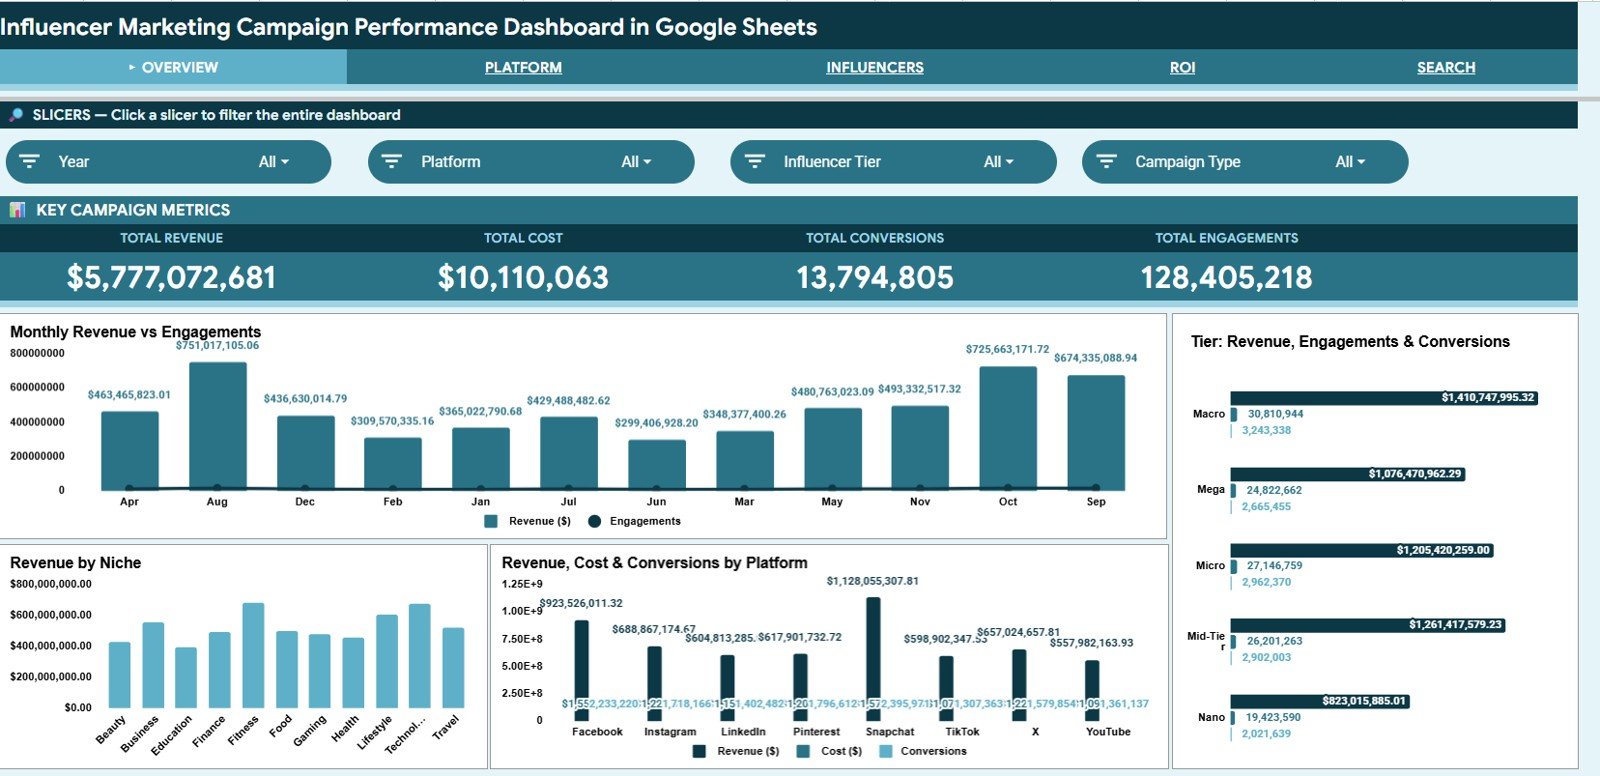
- Executive summary: Total Revenue, Total Cost, Total Conversions, and Total Engagements appear as four headline cards.
- Fourteen visual analyses: review performance by month, tier, niche, platform, content type, and campaign type.
- Slicer-based exploration: filter each page without recreating charts for each client, market, or campaign segment.
- Platform reporting: compare reach, impressions, engagements, clicks, and revenue across Facebook, Instagram, LinkedIn, Pinterest, Snapchat, TikTok, X, and YouTube.
- Influencer reporting: examine how the Nano, Micro, Mid-Tier, Macro, and Mega tiers, niche, and platform contribute to reach, engagement, conversion, cost, and revenue.
- Financial reporting: place revenue beside cost to find expensive segments and stronger-returning combinations.
- Campaign lookup: select one Campaign ID to retrieve its detailed record.
- Editable data layer: replace sample rows while retaining the supplied input format.
Dashboard Pages Explanation
Each of the four analysis pages has its own metric cards and slicers. Here is a quick map of what you will find on each one.
| Page | Metric cards | Slicers | Charts |
|---|---|---|---|
| Overview | Total Revenue, Total Cost, Total Conversions, Total Engagements | Year, Platform, Influencer Tier, Campaign Type | 4 |
| Platform | Total Reach, Total Impressions, Total Clicks, Avg Engagement Rate | Year, Month, Campaign Type, Content Type | 3 |
| Influencers | Unique Influencers, Avg Rev / Influencer, Mega Tier Revenue, Micro Tier Revenue | Influencer Tier, Niche, Platform, Month | 3 |
| ROI | Total Revenue, Total Cost, Net Profit, Overall ROI | Platform, Campaign Type, Influencer Tier, Month | 4 |
1. Overview Page
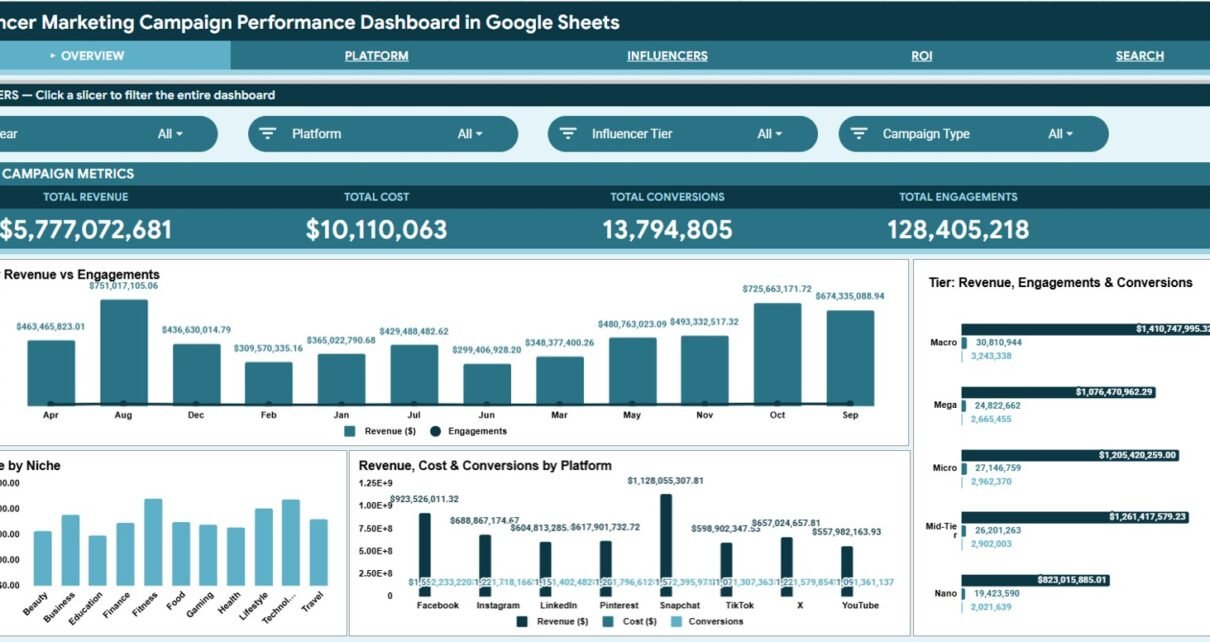
The Overview page is the starting point for management reviews. Its four cards answer the first questions most stakeholders ask: how much revenue was recorded, how much was spent, how many conversions occurred, and how much engagement was generated.
Monthly Revenue vs Engagements compares commercial output with audience activity over time. A month with rising engagement but flat revenue may deserve a closer look at content, platform mix, or conversion quality.
Tier: Revenue, Engagements & Conversions compares influencer tiers across awareness and outcome measures. It helps show whether a larger creator tier is delivering proportionate business results.
Revenue by Niche identifies the subject areas (Beauty, Business, Education, Finance, Fitness, Food, Gaming, Health, Lifestyle, Technology, and Travel) contributing the most recorded sales. Revenue, Cost & Conversions by Platform places investment and results together so a high-revenue channel is not judged without its cost.
2. Platform Performance
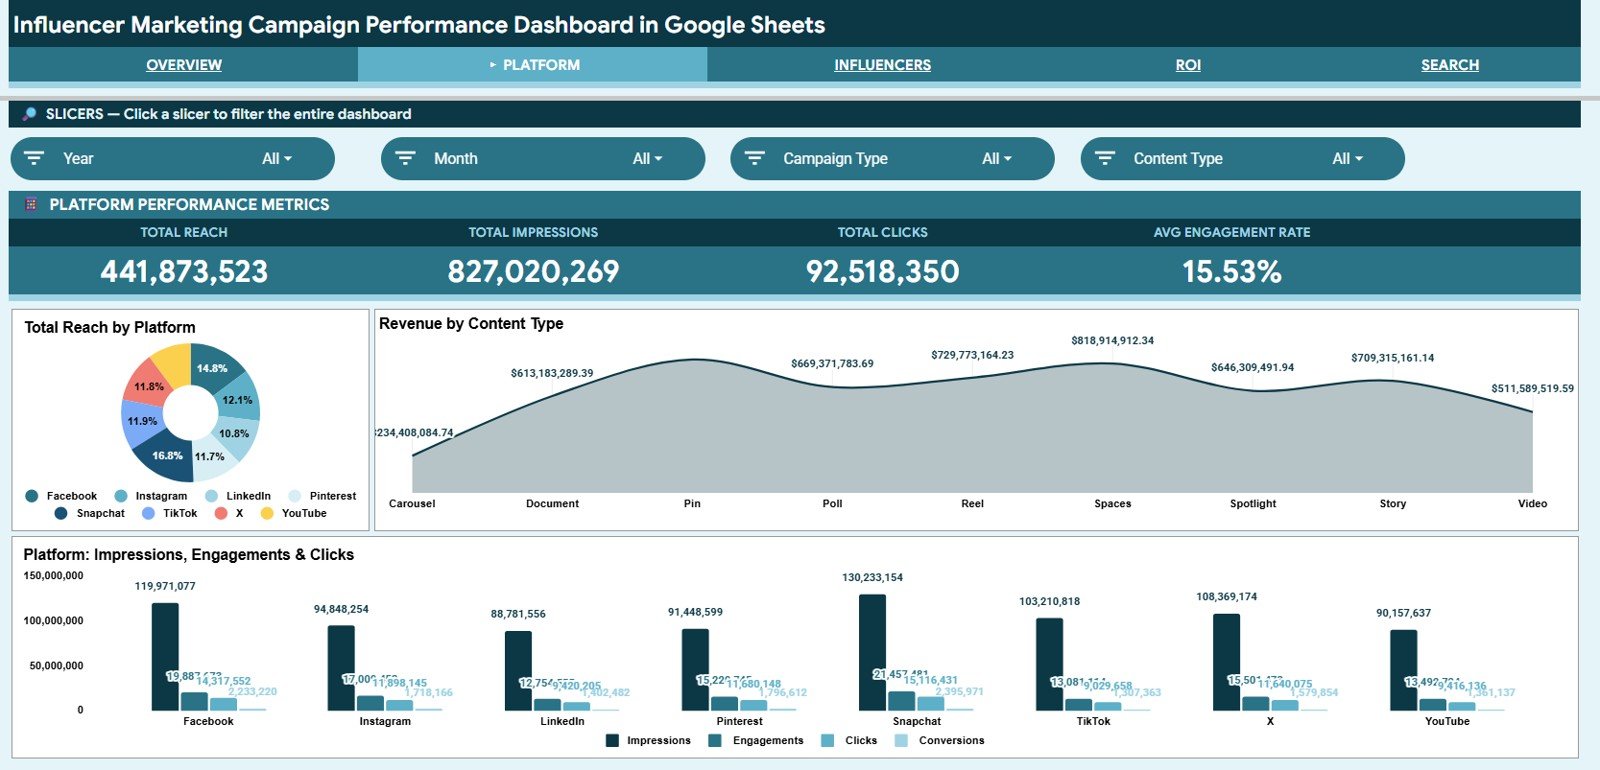
Total Reach by Platform shows where campaigns have the greatest potential audience scale. Revenue by Content Type compares the commercial contribution of Carousel, Document, Pin, Poll, Reel, Spaces, Spotlight, Story, and Video formats, helping teams decide which formats deserve further testing.
Platform: Impressions, Engagements & Clicks follows the audience journey from exposure to interaction and traffic. A channel may generate many impressions but relatively fewer clicks, while another may have less reach and stronger action.
3. Influencer Performance
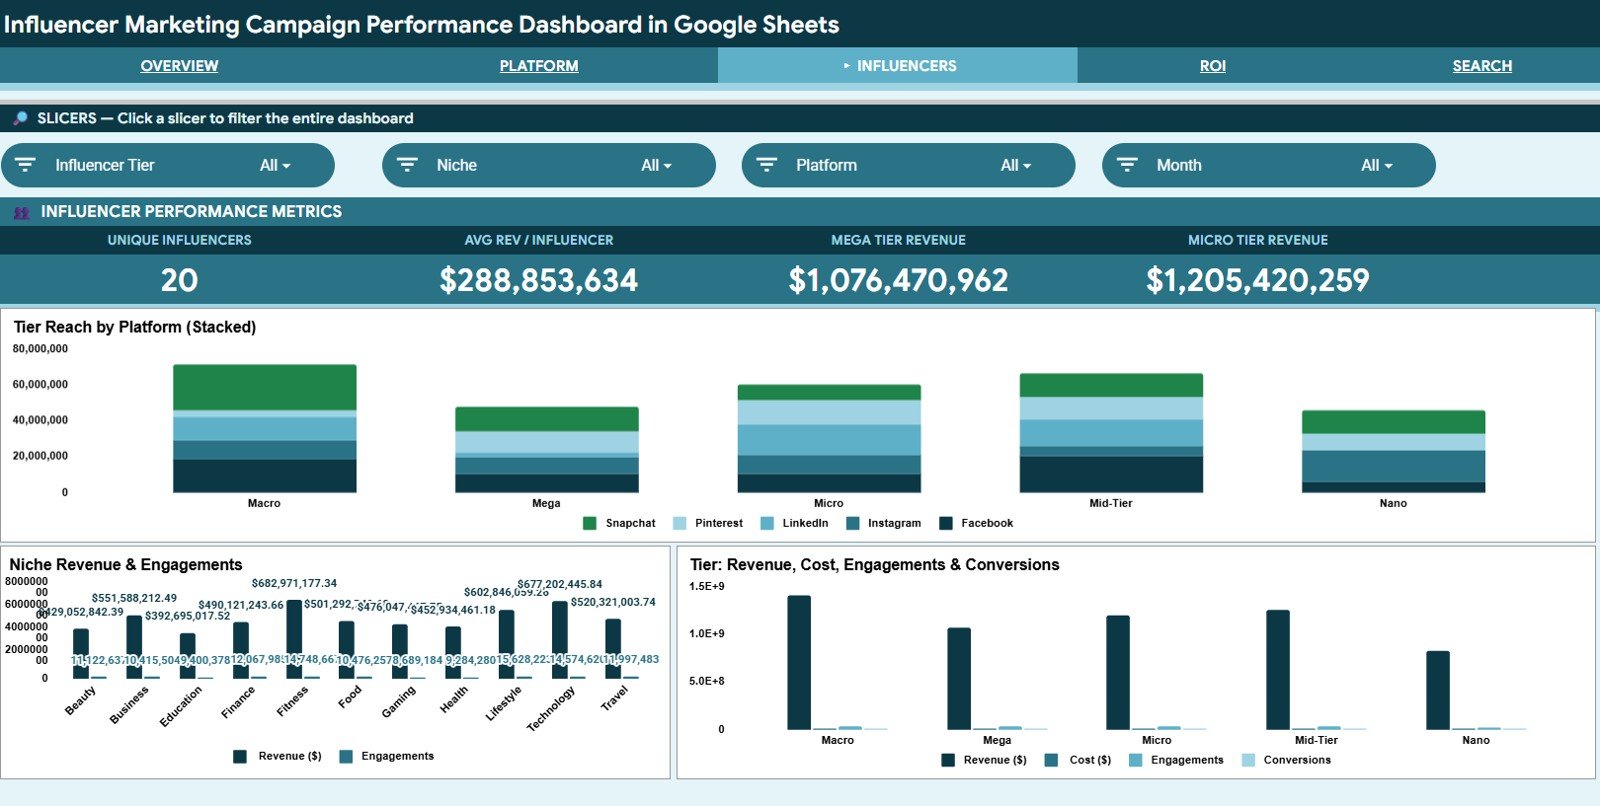
Tier Reach by Platform reveals where creator size and channel choice combine to produce distribution. Niche Revenue & Engagements tests whether a highly engaged content category also contributes meaningful revenue.
Tier: Revenue, Cost, Engagements & Conversions is useful when planning the creator mix. It distinguishes tiers that create visibility from tiers that contribute more measurable outcomes, while keeping spend visible.
4. ROI and Financial Analysis
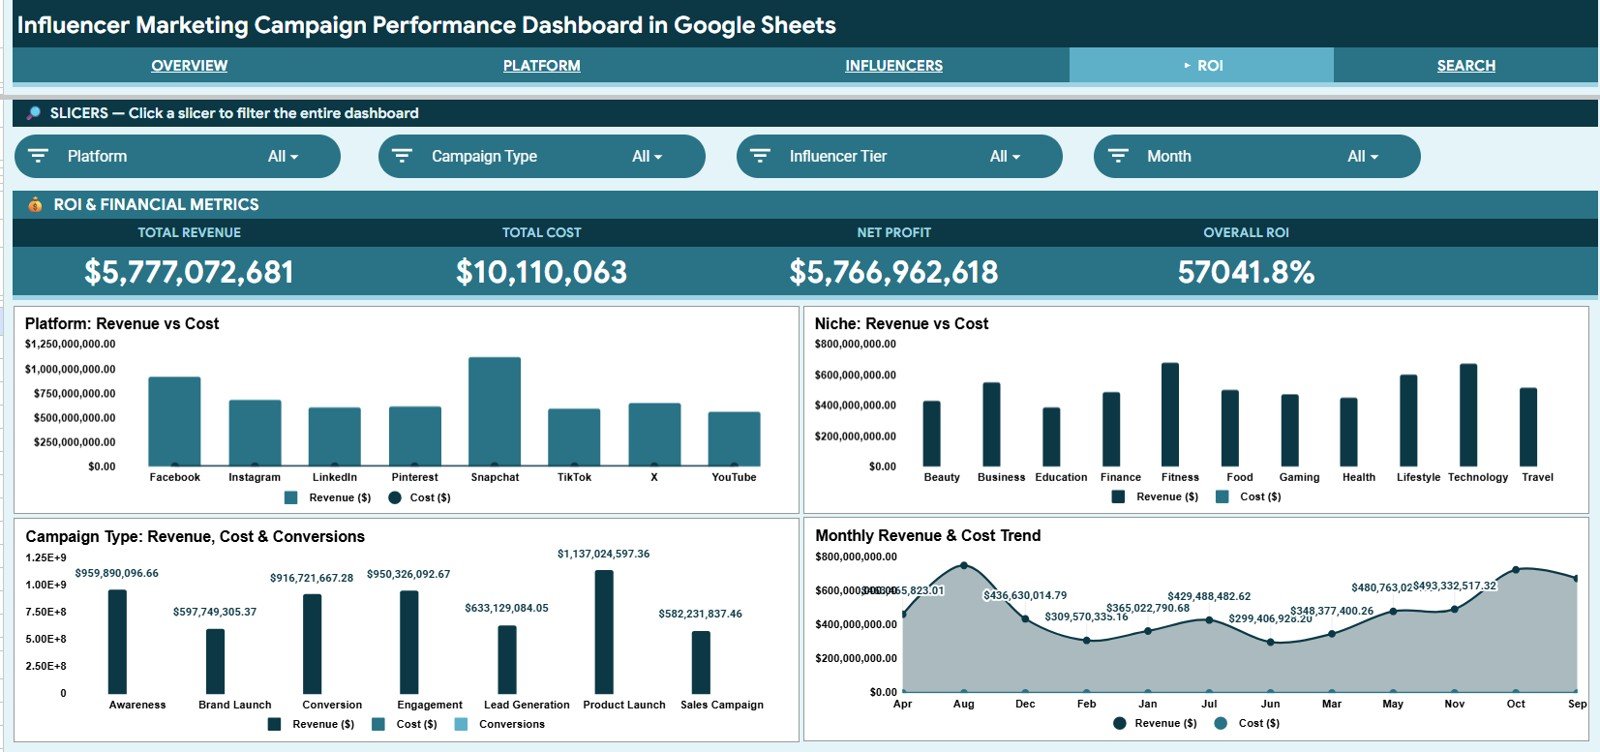
Platform: Revenue vs Cost and Niche: Revenue vs Cost make imbalances visible across major planning dimensions. These comparisons support better questions about budget allocation; they do not replace a formal incrementality or attribution model.
Campaign Type: Revenue, Cost & Conversions compares financial input with recorded outcomes for Awareness, Brand Launch, Conversion, Engagement, Lead Generation, Product Launch, and Sales Campaign activations. Monthly Revenue & Cost Trend highlights timing patterns, unusually expensive periods, and months worth investigating.
The two calculated cards on this page work like this:
Net Profit  = Total Revenue - Total Cost
Overall ROI = Net Profit / Total Cost
In the sample file, $5,777,072,681 revenue minus $10,110,063 cost gives a Net Profit of $5,766,962,618, and $5,766,962,618 ÷ $10,110,063 gives the Overall ROI of 57041.8% shown on the card. Because the sample data is illustrative, that ROI is far higher than any real campaign would produce. With your own campaign records, the same cards will show your real return.
5. Search Sheet
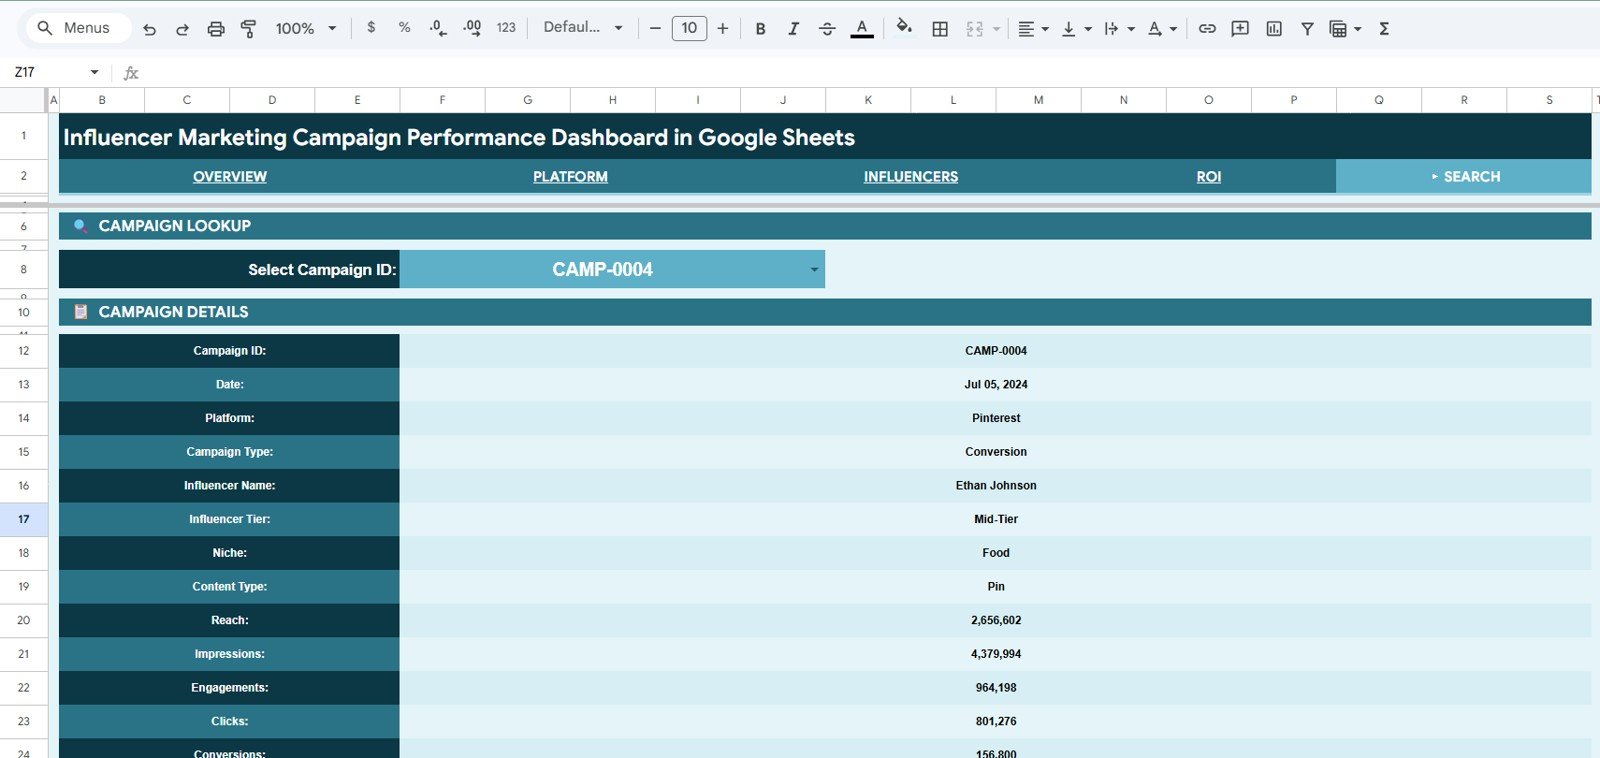
Select a Campaign ID from the dropdown and the sheet returns the Campaign ID, date, platform, campaign type, influencer name, influencer tier, niche, content type, reach, impressions, engagements, clicks, and conversions. The lookup is helpful when a stakeholder asks what sits behind one point in the aggregated dashboard.
6. Data Sheet Tab
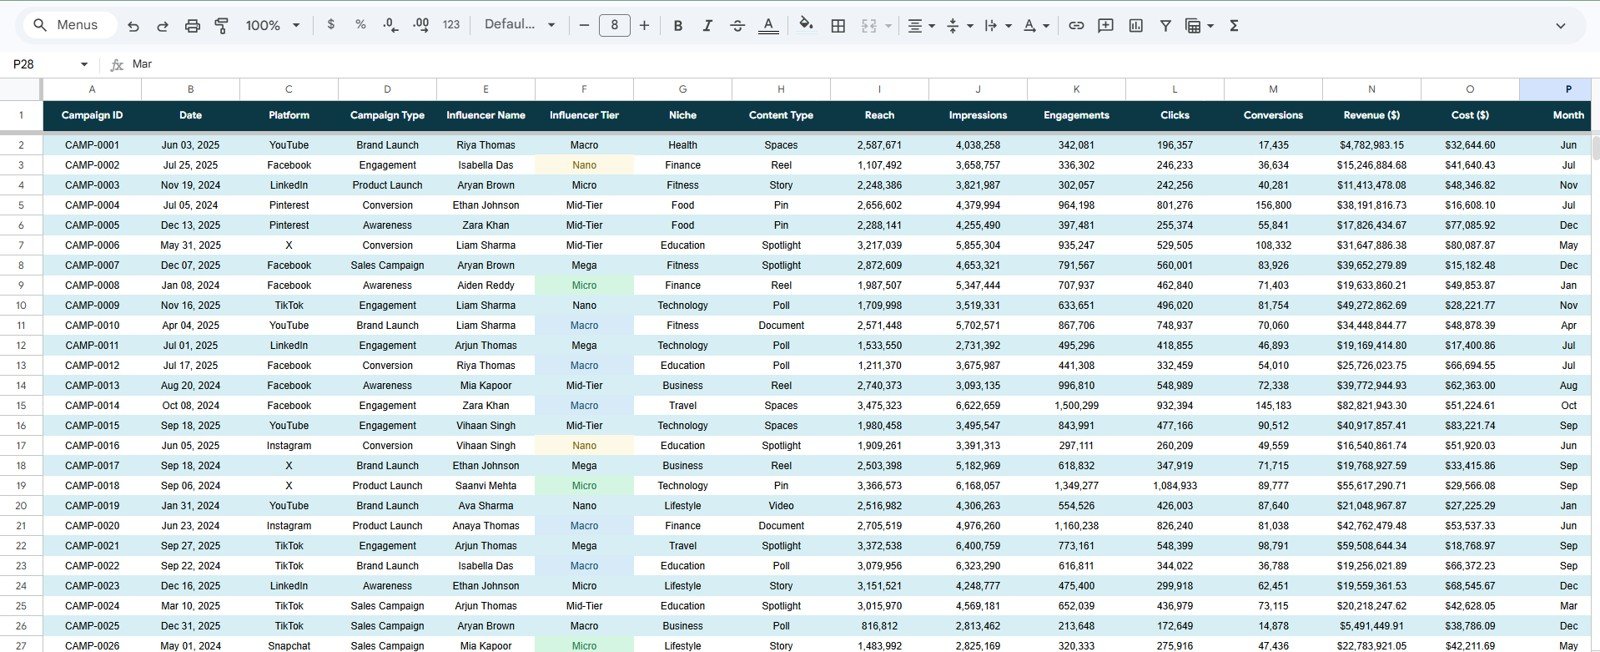
The Data sheet is the input layer. Its columns include Campaign ID, Date, Platform, Campaign Type, Influencer Name, Influencer Tier, Niche, Content Type, Reach, Impressions, Engagements, Clicks, Conversions, Revenue ($), Cost ($), and Month. Add campaign records in the same format and keep naming consistent across platform, campaign type, tier, niche, and content type. Standardized labels prevent the same category from being split into multiple chart groups because of spelling or spacing differences.
Google Sheets Template vs. Excel Dashboard vs. Paid Marketing SaaS
| Feature | This Google Sheets Template | Microsoft Excel Dashboard | Paid Marketing SaaS |
|---|---|---|---|
| Cost | One-time template purchase | Template cost plus licensing where needed | Recurring and plan-dependent |
| Platform | Browser-based Google Sheets | Desktop or web Excel | Vendor-hosted application |
| Setup time | Copy the file and replace sample rows | Open the workbook and replace data | Onboarding and integrations vary |
| Real-time collaboration | Native Drive sharing | Available through supported cloud storage | Usually included by plan |
| Mobile access | Sheets app or browser | Excel app or browser | Vendor app or browser |
| Custom fields | Editable sheet structure | Editable workbook structure | Limited by configuration |
| Share with link | Yes, with permission controls | Yes, with compatible cloud sharing | Usually account based |
| Campaign-ID lookup | Included | Possible with formulas | Varies |
Who Should Use This Template
This dashboard suits influencer agencies preparing client recaps, brand teams comparing channel and niche performance, freelance campaign managers maintaining a small portfolio, and creator partnership teams that need a shared reporting file. It is especially appropriate when the team can export or enter clean campaign records but does not need a full creator relationship management system.
It is less suitable for organizations requiring automated platform connectors, contract workflows, creator payments, fraud detection, social listening, multi-touch attribution, or tightly governed enterprise permissions.
Real-World Use Cases
Maya, an agency account manager, filters the Overview by platform and tier before a client call. When asked about a specific activation, she switches to the Search sheet and selects its Campaign ID.
Arjun, a brand marketer, compares revenue and cost by niche, then checks content-type revenue and platform clicks before proposing the next budget test.
Leena, a freelance creator manager, maintains one row per campaign and uses the monthly trends to prepare a recurring review without rebuilding charts.
Advantages of This Influencer Campaign Performance Dashboard
The main advantage is reporting consistency. Everyone works from the same campaign fields, category names, and chart definitions. The separation between Overview, Platform, Influencer, and ROI pages also keeps one page from becoming overloaded.
Google Sheets supports link sharing and permission levels such as viewer, commenter, and editor. Review Google’s official Drive sharing guide before distributing a campaign file, especially when it contains client or creator information.
The template is also transparent. Users can inspect the data table, formulas, and chart ranges instead of sending metrics into an opaque third-party reporting layer.
Opportunities for Improvement
Data automation: the supplied workflow depends on entered or pasted records. Teams with high campaign volume may later add an approved connector or Apps Script process, with careful testing and access controls.
Data validation: dropdowns for platform, tier, niche, content type, and campaign type can reduce inconsistent labels. A separate validation log can flag blanks, duplicate Campaign IDs, or negative values before review.
Attribution depth: reported revenue and conversions should be interpreted according to the organization’s measurement method. Consider adding attribution window, source system, or confidence fields if they matter to decision-making.
Best Practices
- Define each metric and its source before the first reporting cycle.
- Keep one unique Campaign ID per record and check duplicates.
- Use consistent platform, tier, niche, content type, and campaign type labels.
- Protect formula and dashboard ranges from accidental edits.
- Review missing values before presenting totals or comparisons.
- Use slicers to answer a specific question, then clear them before saving a general view.
- Limit editor access when the file contains sensitive client or creator data.
For KPI-focused views of the same topic, see the Influencer Marketing KPI Dashboard in Google Sheets, the Influencer ROI KPI Dashboard in Google Sheets, and the Influencer Engagement KPI Dashboard in Google Sheets. For wider channel reporting, the Campaign ROI and Performance Dashboard in Google Sheets and the Digital Marketing KPI Dashboard in Google Sheets are useful companions.
If you want to learn how dashboards like this are put together, the Excel Pivot Tables & Dashboards course on NextGenTemplates Academy covers summarizing campaign-style data and building chart pages step by step.
Explore Relevant Templates
- Social Media Influencer Tracking Dashboard in Google Sheets
- Influencer ROI KPI Dashboard in Google Sheets
- Influencer Marketing Dashboard in Excel
- Influencer Marketing Dashboard in Power BI
Frequently Asked Questions
What does the dashboard measure?
It analyzes revenue, cost, conversions, engagements, reach, impressions, and clicks across time, platform, tier, niche, content type, and campaign type.
Does it require Microsoft Excel?
No. This version is built for Google Sheets and is used with a Google account.
Can several team members collaborate?
Yes. The file owner can grant appropriate viewer, commenter, or editor access through Google Drive.
Does it pull data automatically from social platforms?
No. Campaign records must be entered or pasted into the Data sheet in the supplied format.
Can I inspect a single campaign?
Yes. Choose a Campaign ID on the Search sheet to return the available campaign details.
Is this a full influencer-management system?
No. It is a reporting template and does not include creator contracting, payments, outreach, or automated social listening.
About the Author
Built by PK – Microsoft Certified Professional with 15+ years of Excel, Google Sheets, and Power BI experience. Founder of NextGenTemplates, reaching 300K+ subscribers across YouTube channels. Every template is hand-built and tested before release.
Wrapping Up
The Influencer Marketing Campaign Performance Dashboard in Google Sheets gives small and mid-sized teams a practical reporting layer between raw campaign exports and a recurring SaaS platform. Its 6 tabs separate executive, platform, creator, financial, campaign-level, and data-entry work, while 14 charts reduce repetitive report building. If your team can maintain clean campaign rows and wants an editable shared view, paste last month’s campaigns into the Data sheet and run your next review from the Overview page.
Get the Influencer Campaign Performance Dashboard
📅 Last updated: October 2026