Cybersecurity Awareness KPI Scorecard in Google Sheets gives security, HR, compliance, and IT leaders a practical way to track whether employee awareness activity is improving month by month. That matters because security awareness is no longer a softCybersecurity program metric. IBM’s Cost of a Data Breach Report 2026 puts the global average cost of a data breach at $4.99M, while the Verizon 2026 Data Breach Investigations Report continues to highlight phishing, social engineering, mobile threats, and other human-risk patterns that every organization has to manage. When leadership asks whether training is working, a clean scorecard is often the fastest way to answer.Cybersecurity
This Google Sheets template turns cybersecurity awareness activity into a monthly KPI review. Instead of keeping training completion, phishing simulation performance, incident reporting behavior, policy adherence, and patch-related metrics scattered across different exports, the scorecard brings them into one shareable dashboard-style workbook. It is designed for teams that want a low-cost, editable reporting layer inside Google Sheets.
Get the Cybersecurity Awareness KPI Scorecard in Google Sheets
What the Cybersecurity Awareness KPI Scorecard Tracks
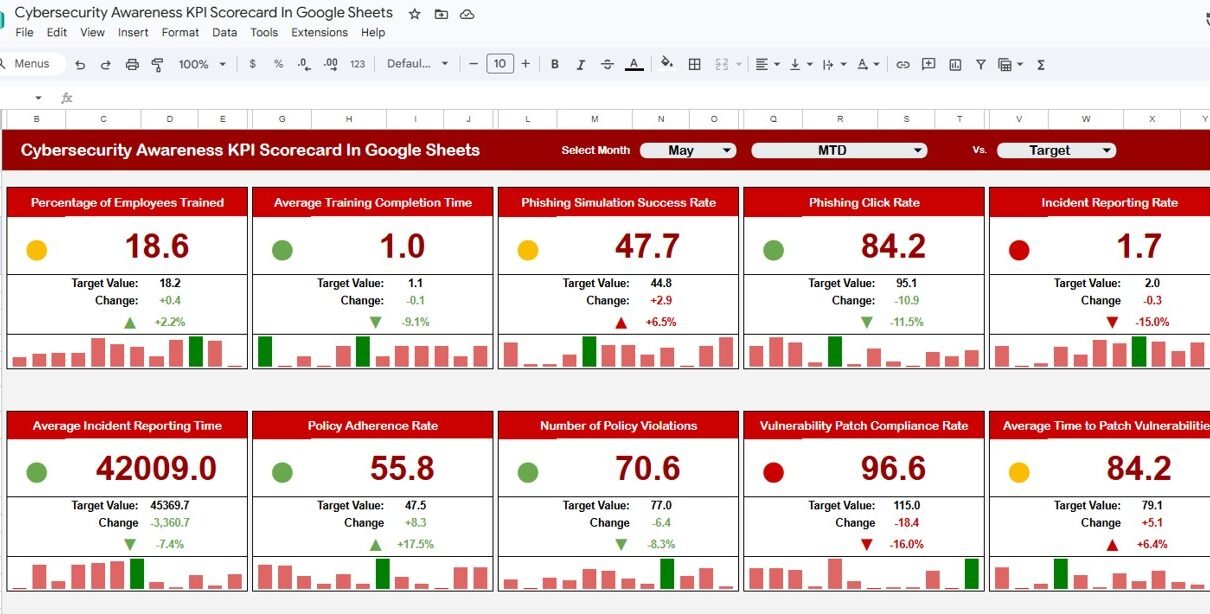
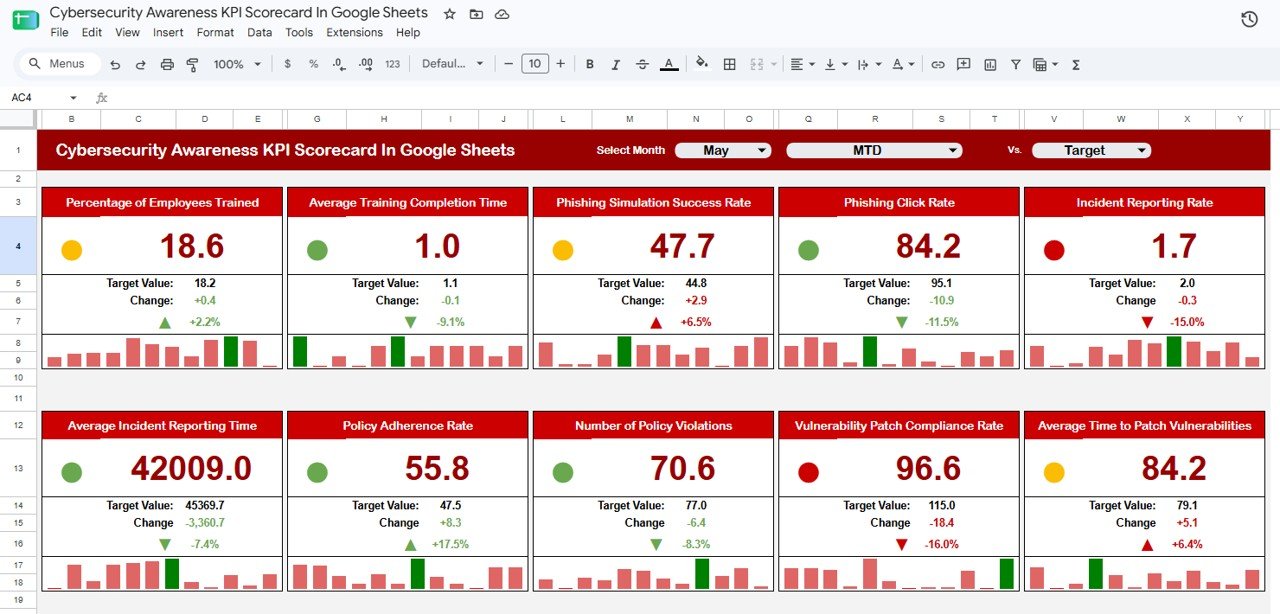
The template includes ten core KPIs that cover training adoption, phishing response, reporting discipline, policy behavior, and vulnerability-related action. The visible scorecard includes Percentage of Employees Trained, Average Training Completion Time, Phishing Simulation Success Rate, Phishing Click Rate, Incident Reporting Rate, Average Incident Reporting Time, Policy Adherence Rate, Number of Policy Violations, Vulnerability Patch Compliance Rate, and Average Time to Patch Vulnerabilities.
Each KPI tile shows the current value, target value, change, percentage movement, status color, and a compact mini trend. The month selector makes it easy to switch the review period, while the comparison selector helps stakeholders focus on MTD performance against target.
Key Features
- Google Sheets scorecard format: Copy the workbook into Google Drive and share it with IT, HR, compliance, and executive stakeholders.
- Ten awareness KPIs: Monitor training, phishing simulation, incident reporting, policy adherence, violations, and patch compliance in one view.
- MTD and YTD tracking: Review monthly performance and year-to-date trends without rebuilding charts manually.
- Target, actual, and previous-year comparison: Compare performance against targets and historical baselines.
- Upper-the-better and lower-the-better logic: Use the right status direction for KPIs like training completion rate and phishing click rate.Cybersecurity
- RAG thresholds: Review red, amber, and green status logic in a dedicated threshold table.Cybersecurity
- Editable KPI definitions: Adjust formulas, units, definitions, KPI groups, and metric direction to match your internal security program.Cybersecurity
Scorecard Pages Explained
Scorecard Sheet
The scorecard sheet is the monthly leadership view. It presents every KPI as a tile with the KPI name, current value, target value, change, status color, and mini chart. This is the sheet you can use in a security steering meeting, HR learning review, vCISO client update, or compliance status discussion.
KPI Trend Sheet
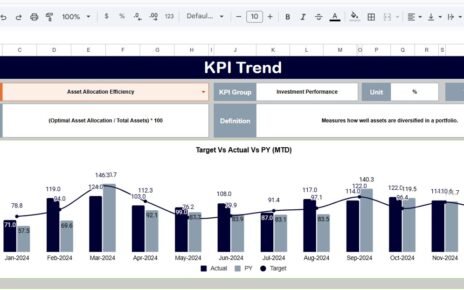
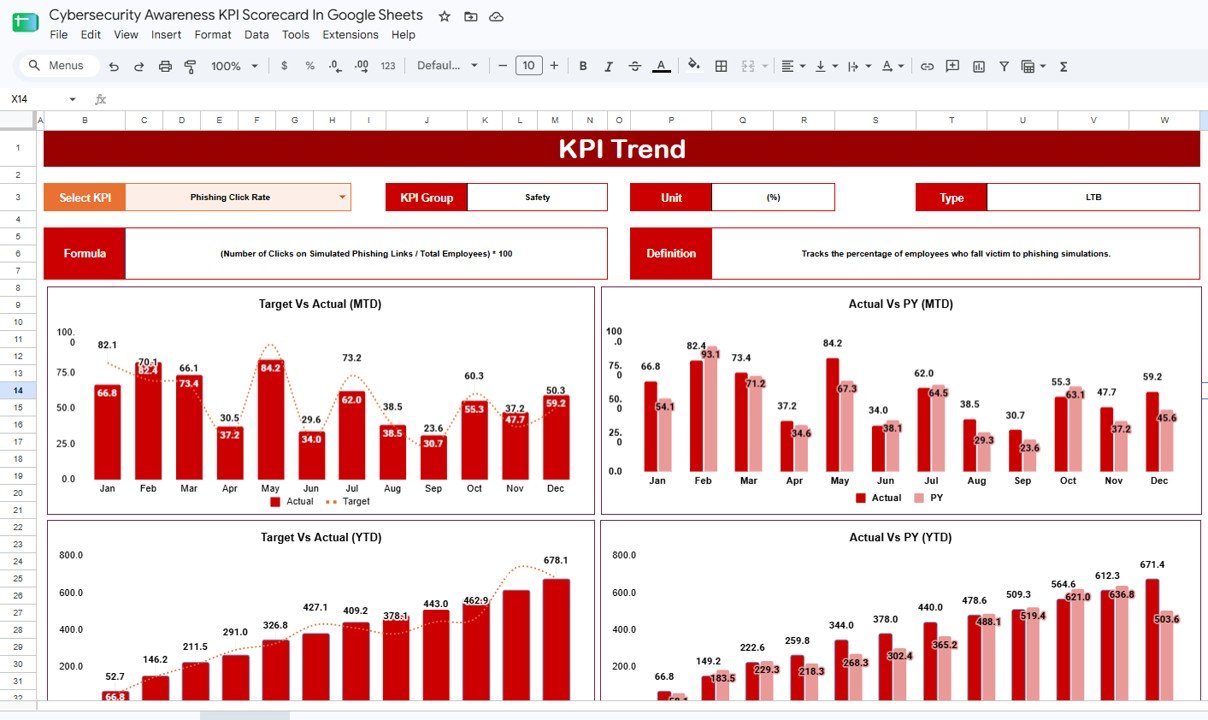
The KPI Trend sheet lets users select one KPI and then review Target vs Actual and Actual vs Previous Year charts for both MTD and YTD views. The sheet also displays the selected KPI group, unit, type, formula, and definition, which helps reduce confusion when multiple teams are reviewing the same metric.
KPI Input Sheet
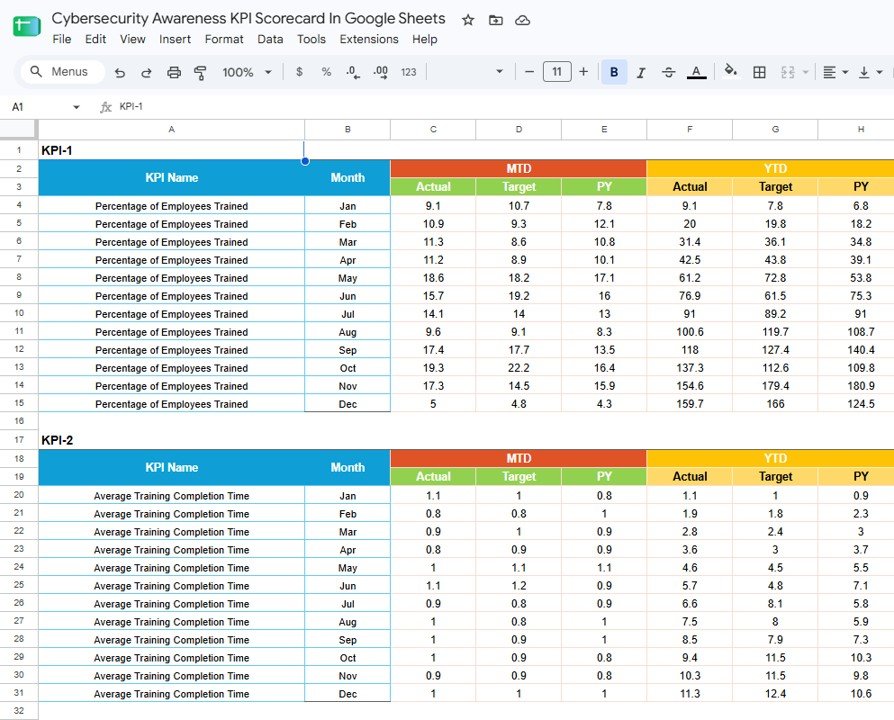
The input sheet stores monthly values for Actual, Target, and Previous Year. This structure makes the template useful for teams that receive awareness data from phishing tools, LMS exports, help desk systems, GRC tools, or manual reporting logs and need to summarize it consistently.
KPI Definition Sheet
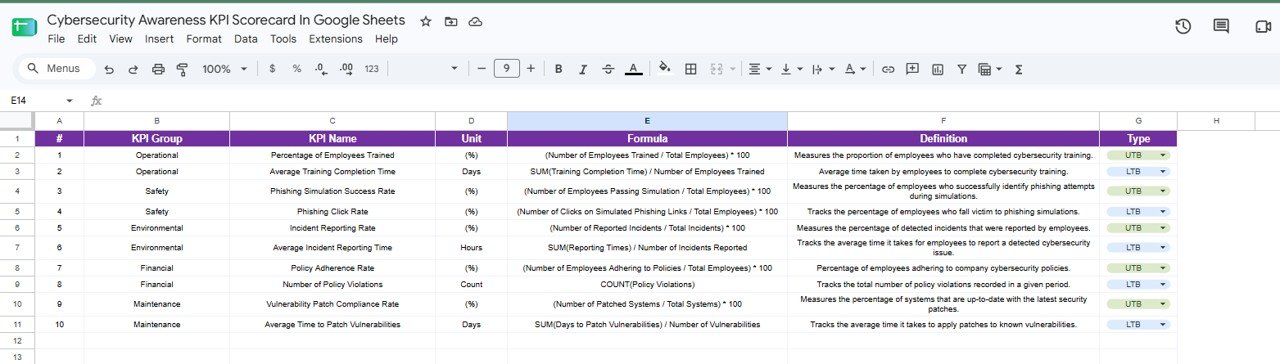
The KPI Definition sheet documents the metric group, KPI name, unit, formula, definition, and KPI type. This is especially useful for cybersecurity awareness reporting because teams often disagree about what a metric really means. A clear definition table keeps the scorecard auditable and easier to maintain.
RAG Threshold Table
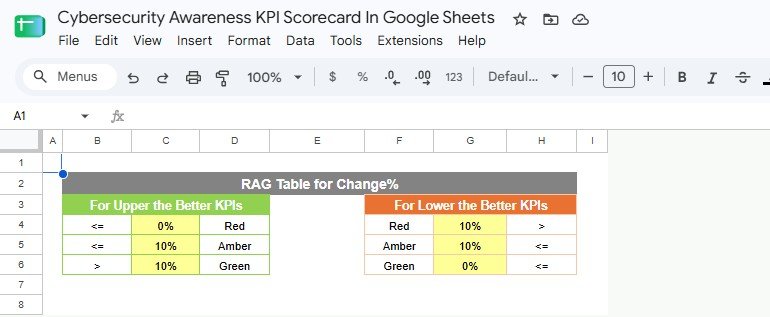
The RAG Table defines status thresholds for upper-the-better and lower-the-better KPIs. For example, a higher training completion rate is good, but a higher phishing click rate is bad. Keeping these rules visible helps the scorecard stay transparent.
Comparison: Google Sheets Scorecard vs. Excel Scorecard vs. Awareness SaaS
| Feature | This Google Sheets Scorecard | Excel Scorecard | Security Awareness SaaS |
|---|---|---|---|
| Typical cost | Low one-time template purchase | One-time template plus Excel access | Recurring subscription or per-user pricing |
| Best use case | Monthly shared KPI review | Offline reporting and workbook analysis | Training delivery, simulations, automation |
| Collaboration | Native Google Sheets sharing | Strong with Microsoft 365 | Inside vendor portal |
| Customization | Edit formulas, KPI names, and RAG rules | Edit workbook formulas and charts | Depends on vendor configuration |
| Setup effort | Copy, edit sample values, and share | Download, customize, and distribute | Procurement, onboarding, integration |
| Limitations | Does not run training or simulations | Can become version-controlled manually | Higher cost and less spreadsheet flexibility |
Who Should Use This Template?
This template is useful for CISOs, security managers, IT managers, HR learning teams, GRC analysts, compliance officers, MSPs, and vCISO consultants. It works best when your organization already has awareness data from another system and needs a clear monthly reporting view.
It is not a replacement for a learning management system, phishing simulation platform, SIEM, ticketing system, or formal GRC evidence repository. Think of it as a practical scorecard layer: simple enough to maintain, structured enough to discuss with leadership, and flexible enough to adapt as the awareness program grows.
Real-World Use Cases
Monthly awareness review: A security team can use the scorecard to review whether employee training completion and phishing click rates are moving in the right direction.
Executive reporting: A CISO can summarize awareness performance in one shared Google Sheets file before a board or steering committee update.
Compliance preparation: A GRC analyst can use the KPI Definition sheet to keep metric calculations consistent before internal audits or policy reviews.
Consulting delivery: A vCISO or MSP can duplicate the scorecard for multiple clients and maintain a consistent reporting format across engagements.
Advantages of Using a Google Sheets KPI Scorecard
Google Sheets is familiar, collaborative, and quick to share. That makes it a good fit for cybersecurity awareness reporting, where the stakeholders often include security, HR, compliance, operations, and senior leadership. The template can be reviewed live in a meeting, duplicated for separate business units, or customized without waiting for vendor configuration.
The one-time template price also makes it attractive for small teams that need better reporting but are not ready for a full security awareness platform. For many organizations, a clean monthly KPI view is enough to spot weak training participation, rising phishing clicks, slow reporting behavior, or policy adherence issues before they become larger risks.
Opportunities for Improvement
Because this is a spreadsheet scorecard, it relies on your team to enter or paste clean data. It does not automatically run phishing tests, send training reminders, or pull live data from security tools. For best results, assign one owner for monthly updates and keep source exports in a controlled folder so the numbers can be traced later.
You may also want to add organization-specific KPIs, such as department-level phishing click rate, repeat clicker count, training overdue count, suspicious email reporting volume, or policy acknowledgement completion. The editable KPI Definition sheet is designed for that kind of adaptation.
Best Practices
- Review KPI definitions before entering production values.
- Separate awareness behavior KPIs from technical security control KPIs when reporting to leadership.
- Use UTB and LTB logic carefully so status colors reflect the right direction of improvement.
- Keep a monthly source-data folder for LMS exports, phishing simulation exports, and incident reporting logs.
- Use the KPI Trend page to discuss patterns, not just the current month.
- Protect edit access in Google Sheets and share read-only access with wider stakeholders.
Explore Relevant Templates
If you need a broader security operations view, explore the Cybersecurity Dashboard in Google Sheets. For related KPI reporting, compare the Cybersecurity KPI Scorecard in Google Sheets and the Cybersecurity Incident KPI Dashboard in Google Sheets. For a more complete security reporting package, see the IT Manager & CISO Toolkit.
You can also browse the Google Sheets templates category and the Google Sheets KPI Dashboard category for more dashboard and scorecard options.
If you want to learn how reports like this are built, the Excel Pivot Tables & Dashboards course on NextGenTemplates Academy covers the techniques with practice files.
Get the Cybersecurity Awareness KPI Scorecard in Google Sheets
Frequently Asked Questions
Is this cybersecurity awareness scorecard built in Google Sheets?
Yes. It is designed for Google Sheets, so you can copy it into Google Drive and share it with your team.
Does the template run phishing simulations?
No. It tracks phishing simulation outcomes that you enter from another phishing tool, LMS, or reporting source.
Can I change the KPIs?
Yes. You can edit the KPI Definition sheet to update metric names, formulas, units, definitions, groups, and UTB or LTB direction.
What does UTB and LTB mean?
UTB means upper the better, such as training completion rate. LTB means lower the better, such as phishing click rate or average time to patch vulnerabilities.
Can this replace a security awareness platform?
No. It is a reporting template, not a training delivery platform. Use it to summarize awareness KPIs for monthly review.
Who should own the monthly update?
Usually the owner is a security awareness manager, IT security analyst, HR learning manager, GRC analyst, or vCISO consultant.
About the Author
This template is built by PK, a Microsoft Certified Professional with 15+ years of experience building Excel, Google Sheets, and Power BI dashboards. PK is the founder of NextGenTemplates and publishes practical reporting templates for business, finance, HR, operations, IT, and security teams.
Conclusion
The Cybersecurity Awareness KPI Scorecard in Google Sheets is a practical way to make employee cyber behavior visible. It helps teams monitor training completion, phishing response, incident reporting, policy adherence, and patch-related awareness KPIs in one shared monthly scorecard. If your organization needs a clean, editable reporting view without adding another subscription, this template is a strong place to start.
Last updated: August 21, 2026.