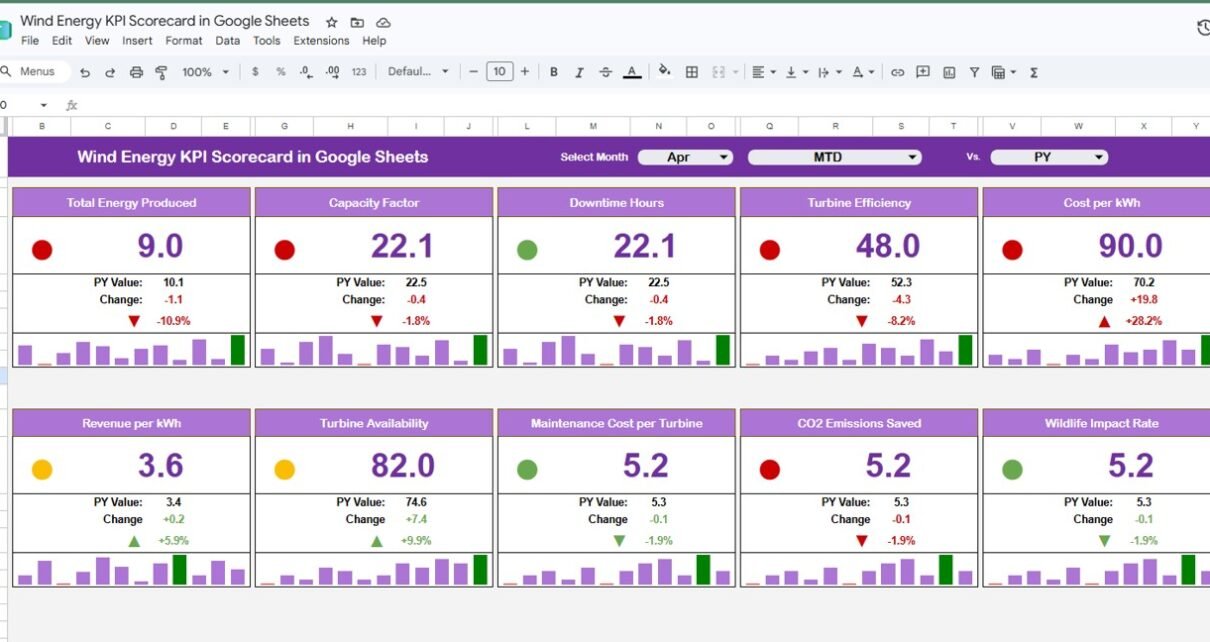
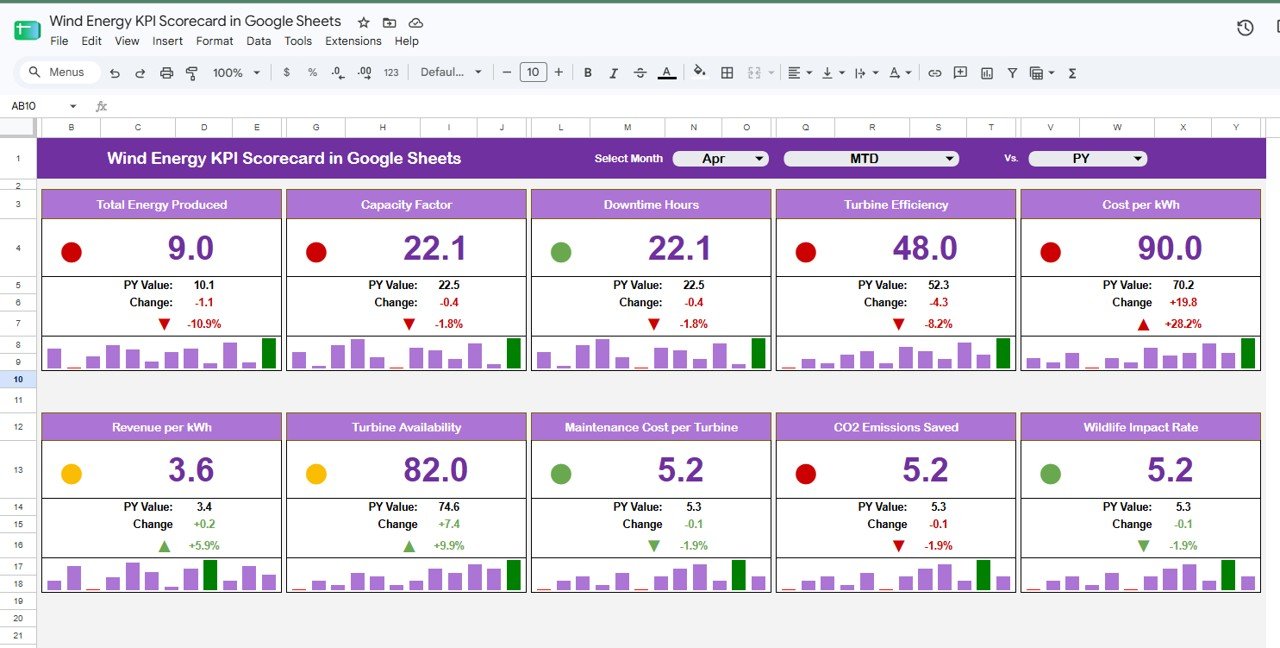
The Wind Energy KPI Scorecard in Google Sheets puts 10 wind-farm KPIs across 4 KPI groups on one page, each with a red, amber, or green status light, a prior-year comparison, and a 12-month sparkline. Setup takes under 10 minutes, and the whole scorecard refreshes from three dropdowns — month, MTD or YTD, and PY or Target.
Wind operators juggle production, availability, cost, and environmental metrics that usually live in separate SCADA exports or costly analytics portals. This Google Sheets scorecard gathers them in one shareable file so managers can report monthly performance without a per-seat subscription.
Get the Wind Energy KPI Scorecard in Google Sheets
Key Features of the Wind Energy KPI Scorecard in Google Sheets
The scorecard tracks 10 KPIs — Total Energy Produced, Capacity Factor, Downtime Hours, Turbine Efficiency, Cost per kWh, Revenue per kWh, Turbine Availability, Maintenance Cost per Turbine, CO2 Emissions Saved, and Wildlife Impact Rate — grouped under Energy Production, Energy Efficiency, Financial Metrics, and Environmental Impact.
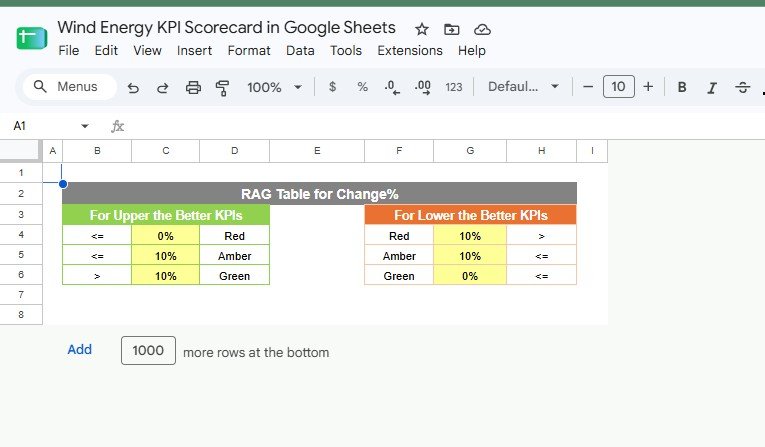
- RAG status lights on every card, driven by an editable Change% table with separate logic for upper-the-better and lower-the-better KPIs.
- MTD, YTD, PY and Target views from three dropdowns, with current value, PY value, change, and percentage change on each card.
- 12-month sparklines so seasonal dips in output or spikes in maintenance are visible at a glance.
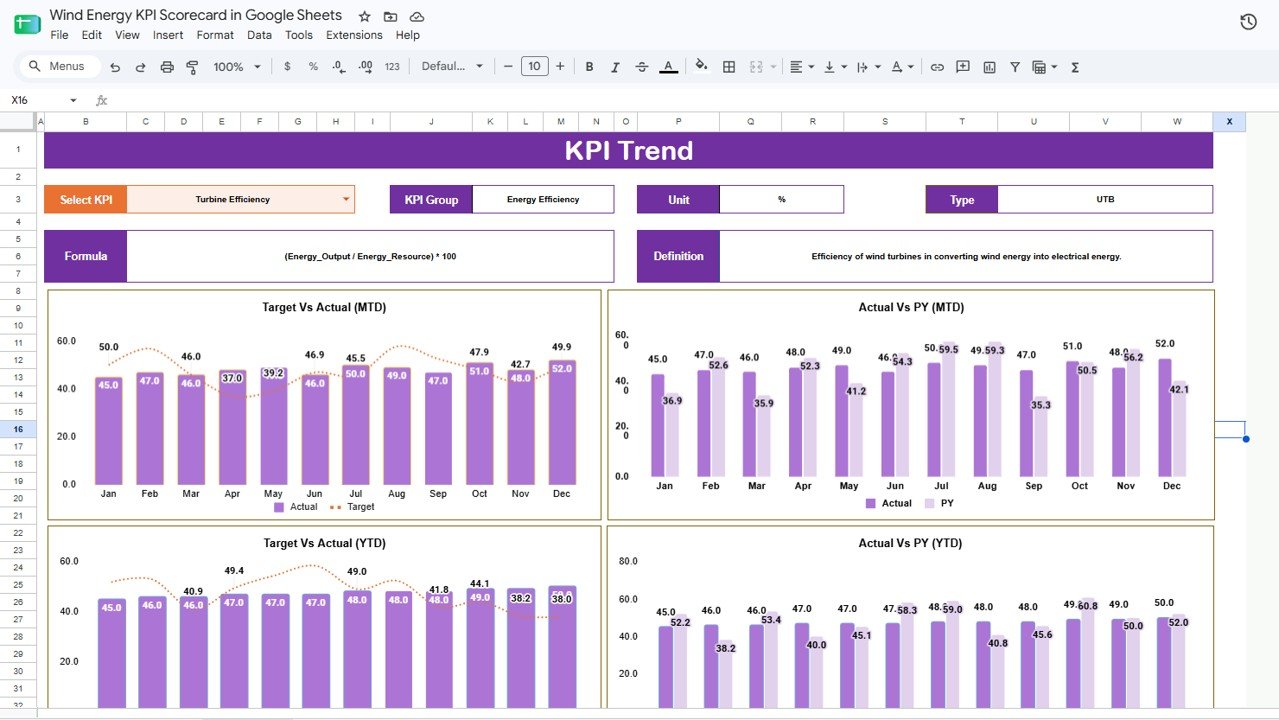
- A KPI Trend page that shows any KPI’s formula, definition, and four comparison charts.
- Runs natively in Google Sheets — no add-ons, no macros, shareable by link, editable on mobile.
Sheets Explanation
KPI Scorecard Page
All 10 KPI cards sit in two rows with RAG lights, values, change, and sparklines. The Select Month, MTD/YTD, and PY/Target dropdowns at the top drive the entire page.
KPI Trend Page
Select a single KPI to see its group, unit, formula, and definition, then four charts: Target vs Actual by Month (MTD), Actual vs PY by Month (MTD), Target vs Actual by Month (YTD), and Actual vs PY by Month (YTD).
Data Sheet
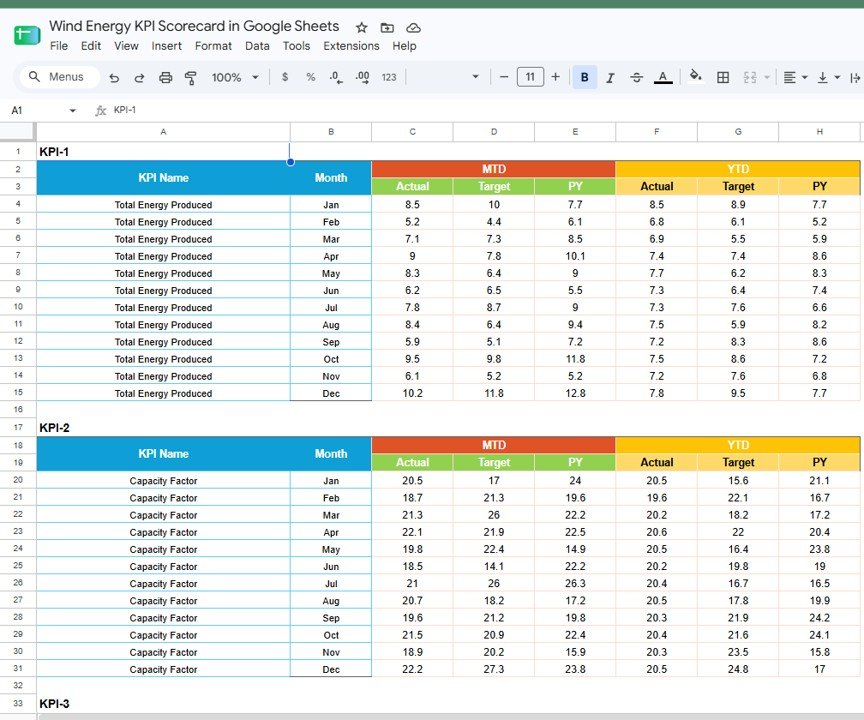
One block per KPI (KPI-1 to KPI-10), with January-to-December rows and columns for MTD Actual, Target, PY and YTD Actual, Target, PY. This is where you paste your own numbers.
KPI Definition Sheet
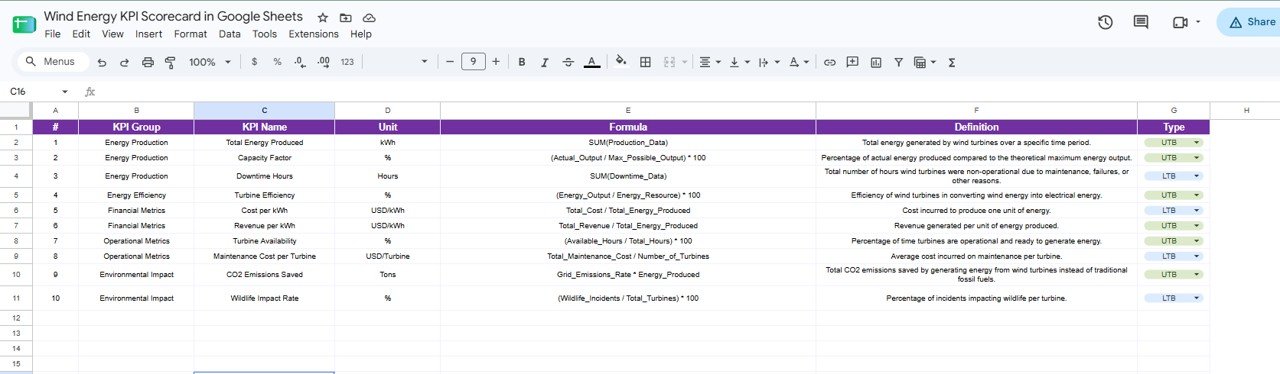
All 10 KPIs listed with KPI Group, Name, Unit, Formula, Definition, and Type (UTB or LTB), so every stakeholder reads each metric the same way.
RAG Table for Change%
Sets red, amber, and green thresholds separately for upper-the-better and lower-the-better KPIs. Change these cut-offs and every status light follows.
Wind Energy KPI Scorecard in Google Sheets vs. Excel vs. SCADA Analytics SaaS — Feature Comparison
| Feature | Wind Energy KPI Scorecard in Google Sheets | Microsoft Excel Scorecard | Wind SCADA Analytics SaaS |
|---|---|---|---|
| Cost | $8.99 one-time ✅ | $10-18 one-time | $300-1,500 / month |
| Platform | Google Sheets, any browser ✅ | Desktop Excel | Vendor cloud portal |
| Setup time | Under 10 minutes ✅ | 15-30 minutes | Days |
| Team collaboration | Native share link ✅ | Limited | Yes |
| Mobile access | Sheets app ✅ | Excel mobile | Yes |
| Editable KPIs and RAG rules | Yes, all 10 ✅ | Editable | Fixed metrics |
| Year-1 cost at 5 users | $8.99 total ✅ | $10-18 | $3,600-18,000 |
For wind operators who want month-by-month KPI reporting without a SCADA subscription, the Wind Energy KPI Scorecard in Google Sheets sits in the sweet spot.
Who Should Use This Template
Perfect for:
- Wind farm and asset managers reporting monthly output and availability to owners
- Renewable energy analysts who want a shareable board-level scorecard
- Small and mid-size wind portfolios (1-50 turbines) working in Google Workspace
Not a fit if:
- You need live turbine telemetry or second-by-second SCADA streaming
- You require SOC 2, SSO, and automated enterprise data pipelines
- Your team will not use Google Sheets or create a Drive copy
Real-World Use Cases
Priya, wind farm manager. She runs a 12-turbine onshore site, pastes production and downtime into the Data sheet each month, and shares the scorecard link with the owner, who checks Capacity Factor and Turbine Availability against last year without a SCADA login.
Marcus, renewable energy analyst. During the quarterly review he opens the KPI Trend page for Cost per kWh and shows Actual vs PY across all twelve months in one chart to explain a Q3 rise.
Lena, sustainability lead. She reports CO2 Emissions Saved and Wildlife Impact Rate from the scorecard and exports the page for the annual ESG pack, avoiding a per-seat analytics tool.
Advantages of the Wind Energy KPI Scorecard in Google Sheets
The template replaces a recurring analytics subscription with a one-time $8.99 purchase, so a small operator saves thousands per year while keeping full control of the metrics. Because it lives in Google Sheets, sharing is a link rather than a file transfer, and edits sync for the whole team. The RAG logic is transparent and editable, so finance and operations agree on what green means before the board meeting. For background on wind’s growing share of generation, the IEA wind energy overview is a useful reference.
Opportunities for Improvement
The scorecard is a monthly reporting layer, not a live monitoring system, so it will not replace SCADA for real-time faults. Data entry is manual unless you connect your own export, and very large portfolios with hundreds of turbines may prefer a database-backed tool. Teams outside Google Workspace will need to adopt Sheets to use it.
Best Practices
- Standardize your monthly export columns so pasting into the Data sheet stays quick.
- Agree RAG thresholds with stakeholders once, then leave them fixed for the year.
- Use the KPI Trend page in reviews to explain a single metric rather than the whole scorecard.
- Duplicate the file per site or per portfolio to keep histories separate.
Explore Relevant Templates
Build a full energy view with the Solar Energy KPI Scorecard in Google Sheets and the Petroleum Industry KPI Scorecard in Google Sheets. For sustainability, add the Carbon Footprint KPI Dashboard in Google Sheets or the ESG Environmental Dashboard in Google Sheets, and for plant operations see the Operational Efficiency KPI Dashboard in Google Sheets. You can also purchase the Solar version and Petroleum version on NextGenTemplates, or browse all Google Sheets KPI Dashboards.
To go deeper on building scorecards and reports like this, the Excel Pivot Tables & Dashboards course on NextGenTemplates Academy teaches the method with practice files.
Get the Wind Energy KPI Scorecard in Google Sheets
Frequently Asked Questions
What KPIs does the Wind Energy KPI Scorecard in Google Sheets track?
It tracks 10 KPIs: Total Energy Produced, Capacity Factor, Downtime Hours, Turbine Efficiency, Cost per kWh, Revenue per kWh, Turbine Availability, Maintenance Cost per Turbine, CO2 Emissions Saved, and Wildlife Impact Rate. Each shows MTD and YTD values with prior-year comparison.
How long does the Wind Energy KPI Scorecard in Google Sheets take to set up?
Under 10 minutes. Create your copy from the PDF link, paste monthly Actual, Target, and PY numbers into the Data sheet, and every card, chart, and RAG light updates automatically.
How do the RAG status lights work?
Each card reads the RAG Table for Change%. Upper-the-better KPIs turn green above a threshold; lower-the-better KPIs like Downtime Hours and Cost per kWh use reversed logic. You edit the thresholds in one table.
Can I compare Actual against Target and prior year?
Yes. Three dropdowns let you pick a month, switch MTD or YTD, and compare Actual against PY or Target. The KPI Trend page adds four charts covering MTD and YTD comparisons for any single KPI.
Do I need Excel or any add-on for the Wind Energy KPI Scorecard in Google Sheets?
No. It runs natively in Google Sheets with no add-ons or macros, works in any browser, and edits on the Google Sheets mobile app.
How does it compare to a SCADA analytics subscription?
A SCADA analytics SaaS often costs $300-1,500 per month. The Wind Energy KPI Scorecard in Google Sheets is a one-time $8.99 purchase for board-level monthly reporting, ideal for single farms and small portfolios.
About the Author
Built by PK — Microsoft Certified Professional with 15+ years of Excel, Google Sheets, and Power BI experience. Founder of NextGenTemplates, reaching 300K+ subscribers across YouTube channels. Every template is hand-built and tested before release.
Conclusion
The Wind Energy KPI Scorecard in Google Sheets gives wind operators a clean, shareable, one-page view of production, efficiency, cost, and environmental KPIs with RAG lights and prior-year context — all inside Google Sheets.
Instant download · One-time payment · No subscription.
Last updated: August 2026