Solar performance reporting is becoming more important as solar capacity scales quickly. The IEA Global Energy Review 2026 reports that global renewable capacity additions reached 800 GW in 2025, with solar PV accounting for more than three-quarters of new renewable capacity additions. In the United States, the SEIA Solar Market Insight reported 7.8 GWdc of solar capacity installed in Q1 2026 alone. With that scale, teams need a simple way to review production, efficiency, uptime, cost, revenue, and ROI without rebuilding reports every monthSolar Energy KPI Scorecard in Google Sheets.
The Solar Energy KPI Scorecard in Google Sheets is built for that job. It gives solar operators, renewable energy consultants, asset managers, and finance teams a structured scorecard for comparing actual performance against targets and prior-year results.
Get the Solar Energy KPI Scorecard in Google Sheets
Key Features of Solar Energy KPI Scorecard in Google Sheets
- 10 solar KPI cards: Track production, power output, efficiency, downtime, maintenance cost, revenue, and ROI.Solar Energy KPI Scorecard in Google Sheets
- MTD and YTD reporting: Review monthly and year-to-date performance from the same reporting model.Solar Energy KPI Scorecard in Google Sheets
- Actual vs Target and Actual vs PY views: Compare current results against planned targets and prior-year values.
- RAG status indicators: Quickly identify green, amber, and red KPI performance.
- KPI trend dashboard: Select an individual KPI and review detailed MTD and YTD chart comparisons.
- Editable input tables: Enter monthly Actual, Target, and PY values for each KPI.
- KPI definition sheet: Keep formulas, definitions, units, KPI groups, and upper/lower-the-better logic documented.
- Google Sheets format: Copy the template into Google Drive and adapt it to your workflow.
Dashboard Pages Explanation
1. Solar Energy KPI Scorecard
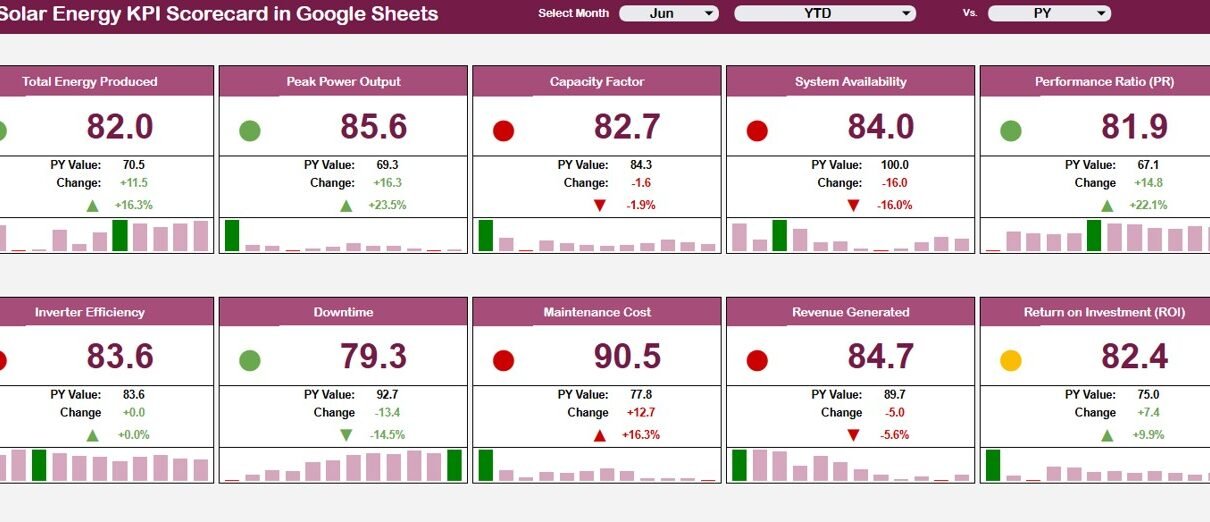
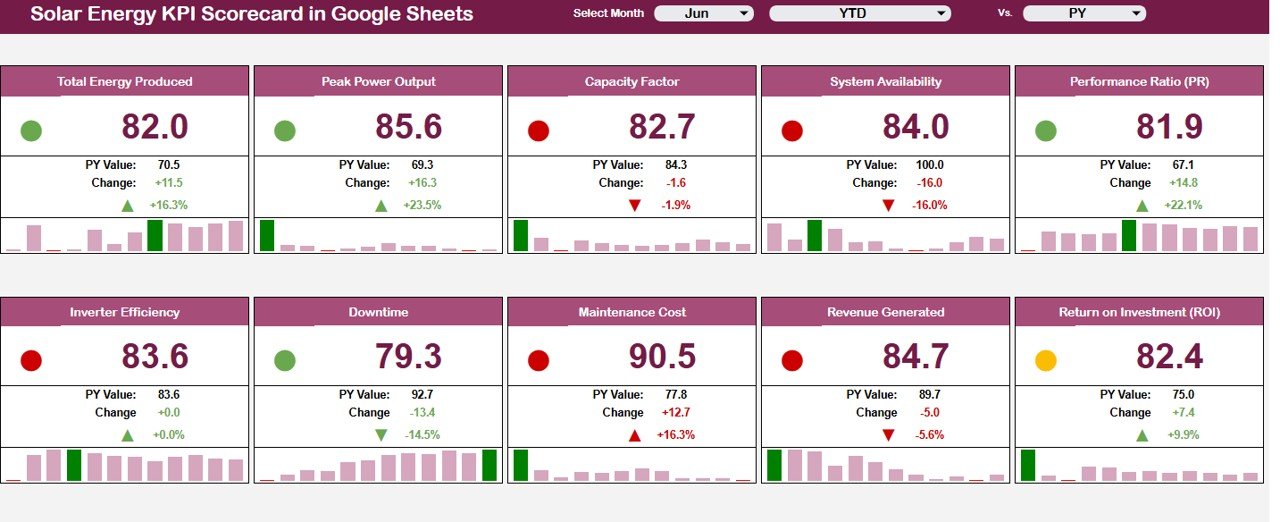
The main scorecard page gives a fast executive view of 10 solar performance indicators: Total Energy Produced, Peak Power Output, Capacity Factor, System Availability, Performance Ratio, Inverter Efficiency, Downtime, Maintenance Cost, Revenue Generated, and Return onSolar Energy KPI Scorecard in Google Sheets Investment.
Each card includes a current value, prior-year value, change amount, change percentage, RAG status indicator, and a compact monthly trend. The top controls allow the user to select the month, switch between MTD and YTD, and compare against PY or target values.
2. KPI Trend Page
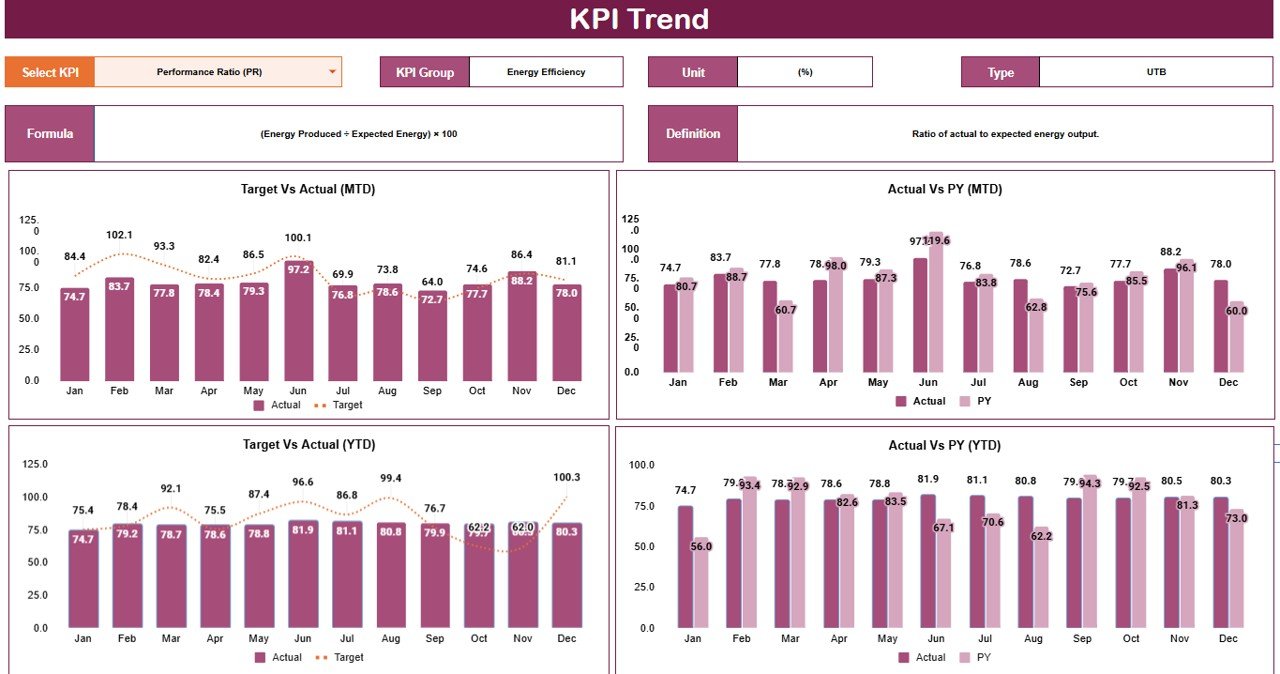
The KPI Trend page lets users select a single KPI and inspect it in more detail. It shows the KPI group, unit, type, formula, and definition, followed by four visuals: Target vs Actual MTD, Actual vs PY MTD, Target vs Actual YTD, and Actual vs PY YTD.
3. KPI Data Input Sheet
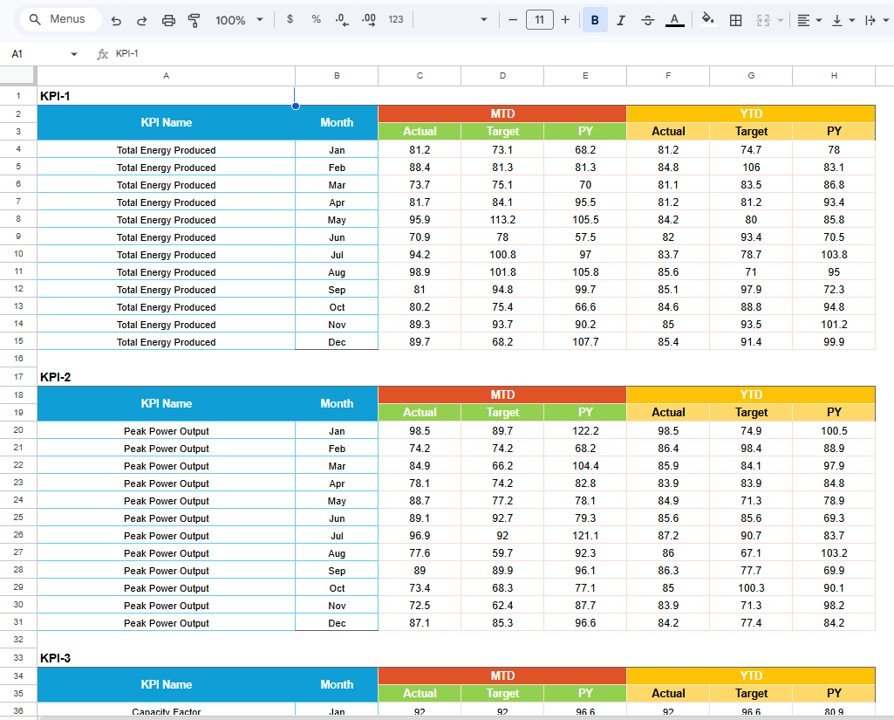
The data sheet is organized by KPI and month. For every KPI, the template provides fields for MTD Actual, MTD Target, MTD PY, YTD Actual, YTD Target, and YTD PY. This structure makes it easier to update reporting periods without changing the dashboard layout.
4. KPI Definition Sheet
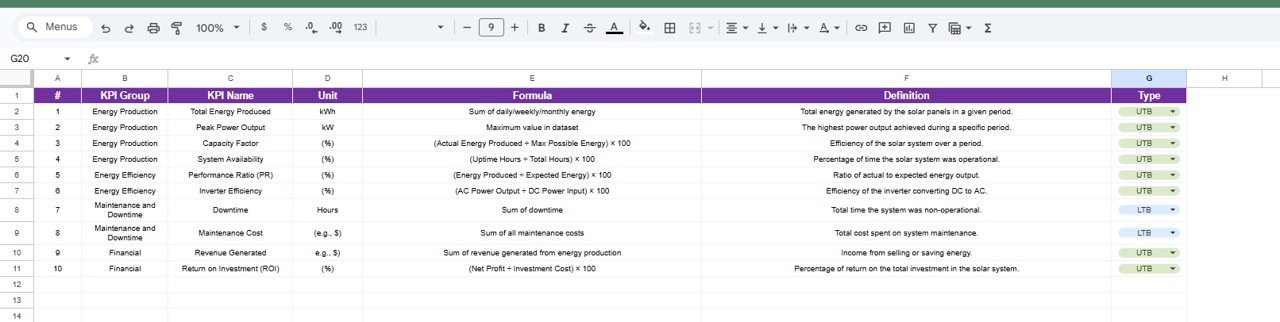
The KPI definition sheet documents KPI group, KPI name, unit, formula, definition, and type. This is especially useful when operations, finance, and management teams need consistent definitions for solar reporting.
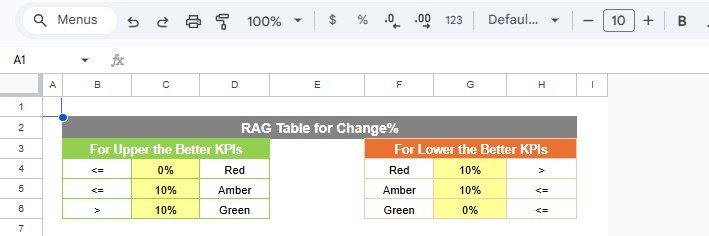
5. RAG Table
The RAG table defines color thresholds separately for upper-the-better and lower-the-better KPIs. That matters because an increase in revenue is positive, while an increase in downtime or maintenance cost may be negative.
Comparison: Google Sheets Scorecard vs Excel Scorecard vs Solar Monitoring SaaS
| Option | Best For | Strengths | Limitations |
|---|---|---|---|
| Solar Energy KPI Scorecard in Google Sheets | Teams that need a fast, shareable reporting template | Cloud-based, editable, low cost, easy to copy, works well for recurring management reporting | Requires manual or imported KPI updates unless connected to source systems |
| Microsoft Excel scorecard | Teams already using local Excel files or Power Query workflows | Strong spreadsheet modeling, offline access, mature formula ecosystem | Version control and collaboration can become messy without disciplined file management |
| Paid solar monitoring SaaS | Large portfolios needing live telemetry, alerts, and device integrations | Automated data feeds, real-time alerts, operational integrations | Higher cost, more setup, and often less flexible for custom management scorecard layouts |
Who Should Use This Scorecard
- Solar plant operators tracking production and uptime.
- Renewable energy asset managers reviewing monthly performance.
- Energy consultants preparing client KPI packs.
- Finance teams monitoring solar revenue, maintenance cost, and ROI.
- Operations leaders comparing performance across months or projects.
- Sustainability teams reporting solar performance to internal stakeholders.
Real-World Use Cases
- Monthly performance review: Compare actual energy output against target and prior-year performance.
- Operations meeting: Highlight downtime, system availability, and inverter efficiency trends.
- Maintenance planning: Track maintenance cost changes and connect cost spikes to operating issues.
- Financial reporting: Review revenue generated and ROI alongside operational performance.
- Consulting deliverables: Build a repeatable solar KPI scorecard for multiple clients or facilities.
Advantages of This Template
- It is easier to start than a custom dashboard build.
- It keeps KPI definitions visible so teams measure performance consistently.
- It separates operational, maintenance, downtime, and financial metrics.
- It supports both upper-the-better and lower-the-better KPI logic.
- It can be duplicated for different solar sites, portfolios, or clients.
- It gives teams an editable reporting model instead of a static PDF-style report.
Opportunities for Improvement
This scorecard is intentionally lightweight and spreadsheet-based. Teams with live inverter, SCADA, or portfolio monitoring systems may want to connect source data through imports, Apps Script, or another automation layer. Larger solar portfolios may also add filters for plant, region, asset owner, technology type, or maintenance vendor.
If your team uses native Google Sheets filtering controls, Google provides documentation for filtering charts and tables with slicers, which can help extend spreadsheet dashboards for interactive review.
Best Practices for Solar KPI Reporting
- Use a fixed reporting calendar so MTD and YTD comparisons stay consistent.
- Document every KPI formula before the scorecard is used in management meetings.
- Separate operational KPIs from financial KPIs when discussing root causes.
- Review both absolute change and percentage change to avoid misleading conclusions.
- Keep RAG thresholds realistic and revisit them as the solar asset matures.
- Make one owner responsible for updating Actual, Target, and PY values each period.
How to Use the Solar Energy KPI Scorecard
- Open the PDF guide included with your purchase.
- Use the Google Sheets copy link to create your editable file in Google Drive.
- Review the KPI definition sheet and adjust KPI names, units, formulas, or thresholds if needed.
- Enter monthly Actual, Target, and PY values in the KPI data sheet.
- Use the main scorecard to review performance by month, MTD, YTD, and comparison mode.
- Open the KPI Trend page to investigate individual KPI movement.
Explore Relevant Templates
- Solar Energy KPI Scorecard in Google Sheets
- Renewable Energy KPI Scorecard in Google Sheets
- Renewable Energy Dashboard in Google Sheets
- Petroleum Industry KPI Scorecard in Google Sheets
- Clean Tech Dashboard in Power BI
Want to build reporting skills like this step by step? The Excel Pivot Tables & Dashboards course on NextGenTemplates Academy walks you through it with practice files.
Get the Solar Energy KPI Scorecard in Google Sheets
Frequently Asked Questions
Is this Solar Energy KPI Scorecard editable?
Yes. It is a Google Sheets template, so you can edit KPI names, values, formulas, definitions, and thresholds after creating your own copy.
Does it include solar-specific KPIs?
Yes. The scorecard includes solar-focused KPIs such as Total Energy Produced, Peak Power Output, Capacity Factor, System Availability, Performance Ratio, Inverter Efficiency, Downtime, Maintenance Cost, Revenue Generated, and ROI.
Can I compare actual values with targets?
Yes. The template supports Actual vs Target and Actual vs PY comparisons for both MTD and YTD views.
Can this be used for client reporting?
Yes. Consultants can duplicate the file for multiple clients and customize KPI definitions, thresholds, and monthly values.
Does this replace solar monitoring software?
No. It is best used as a management reporting scorecard. Solar monitoring platforms may still be needed for real-time alerts, live device data, and technical diagnostics.
About the Author
This template is created by PK An Excel Expert, founder of NextGenTemplates.com. PK builds practical spreadsheet dashboards, KPI scorecards, and automation-ready templates for business teams, consultants, and analysts.
Conclusion
The Solar Energy KPI Scorecard in Google Sheets is a practical way to bring solar production, efficiency, downtime, cost, revenue, and ROI into one monthly reporting view. It helps teams spend less time formatting reports and more time understanding performance.
For more dashboard walkthroughs and spreadsheet automation ideas, visit the NeoTechNavigators YouTube channel.
Last updated: August 19, 2026.