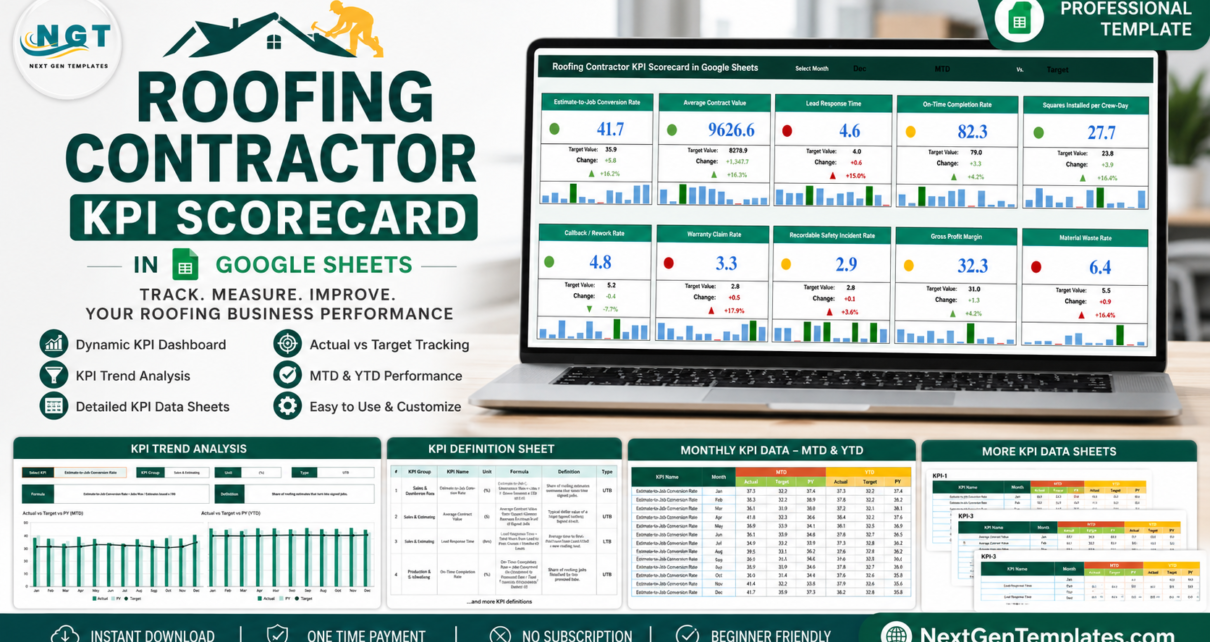
Most roofing companies measure two things well – revenue and complaints – and almost nothing in between. The Roofing Contractor KPI Scorecard in Google Sheets closes that gap with 10 KPIs on a single traffic-light page: three for Sales & Estimating, two for Production & Scheduling, two for Quality & Rework, one for Safety and two for Financial performance. It ships with 120 rows of sample data – ten KPIs across twelve months, with MTD and YTD actual, target and prior-year figures for each – so every card, colour and chart is alive the moment you open it. Four sheets, no add-ons, no scripts to authorise and no monthly fee.Roofing Contractor KPI Scorecard in Google Sheets
This article walks through what the template contains, how each sheet works, where it fits against Excel and paid roofing software, and where it deliberately stops.
Get the Roofing Contractor KPI Scorecard in Google Sheets
Key Features of the Roofing Contractor KPI Scorecard in Google Sheets
- Ten roofing KPIs, grouped by function. Estimate-to-Job Conversion Rate, Average Contract Value and Lead Response Time sit under Sales & Estimating; On-TimeRoofing Contractor KPI Scorecard in Google Sheets Completion Rate and Squares Installed per Crew-Day under Production & Scheduling; Callback / Rework Rate and Warranty Claim Rate under Quality & Rework; Recordable Safety Incident Rate under Safety; Gross Profit Margin and Material Waste Rate under Financial.
- A month picker in the banner. Select a month and all ten cards redraw for it. The sample file opens on December.
- Two comparison switches next to the month picker – MTD or YTD, and Vs. Target or Vs. PY – so the same ten cards give you four readings.
- Traffic lights on every card, scored against that month’s own target rather than a fixed number typed once and forgotten.Roofing Contractor KPI Scorecard in Google Sheets
- UTB / LTB direction awareness. Up-the-better metrics such as Gross Profit Margin go green when they rise; lower-the-better metrics such as Warranty Claim Rate go green when they fall.Roofing Contractor KPI Scorecard in Google Sheets
- Target value, absolute change and percentage move printed under each headline number with an arrow.Roofing Contractor KPI Scorecard in Google Sheets
- A 12-bar mini chart inside each card, with the selected month picked out, so one strong month never reads as a trend.
- A dedicated KPI Trend sheet with a KPI picker and two twelve-month charts.
- A KPI Analysis sheet holding the formula and plain-English definition of every metric.
- One Data sheet as the single place anyone types.
Scorecard Pages Explained
Sheet 1 – KPI Scorecard
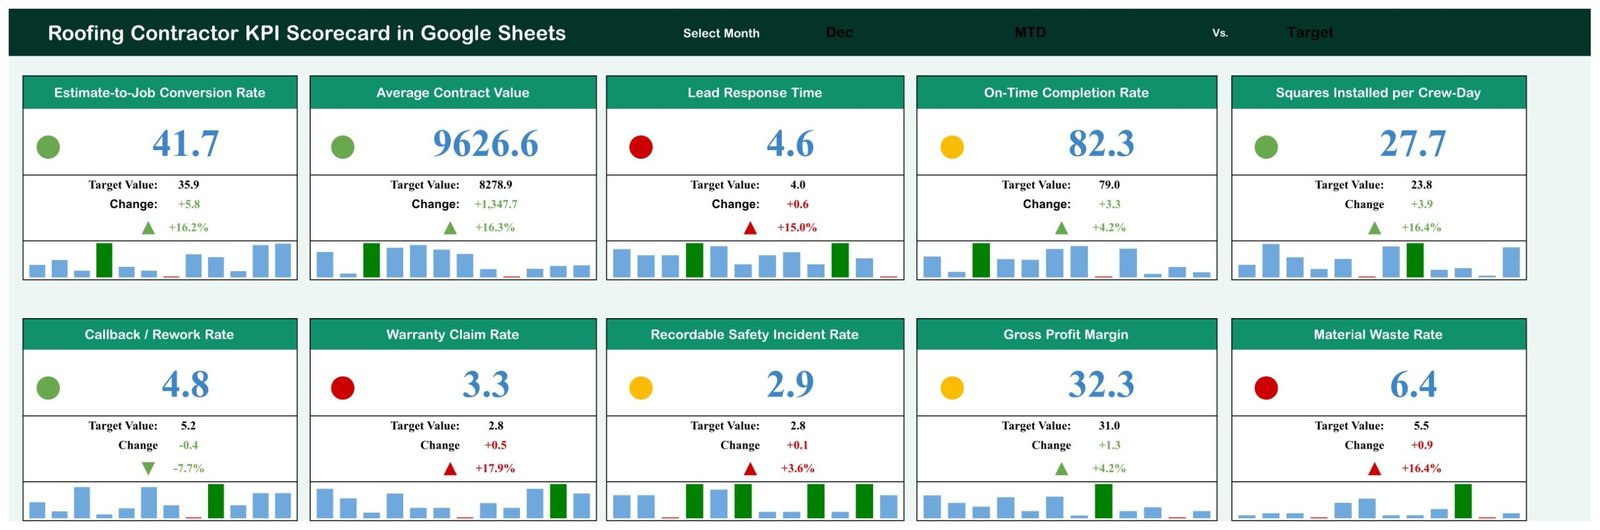
The management page. A dark banner carries the template name, the Select Month dropdown and the MTD/YTD and Vs. Target/Vs. PY switches. Below it sit ten cards in two rows of five. Each card shows a green, amber or red dot, the value for the selected month, the target value, the change against that target and the percentage move with an up or down arrow, then a twelve-bar history strip with the chosen month highlighted.
In the December sample, Estimate-to-Job Conversion Rate reads 41.7 against a 35.9 target – green, +5.8 points, +16.2%. Lead Response Time reads 4.6 hours against a 4.0 target and turns red, because on that metric lower is better and 4.6 is a miss. On-Time Completion Rate at 82.3 against 79.0 sits amber. That mix is the point: the page is designed to have colour on it.
Sheet 2 – KPI Trend
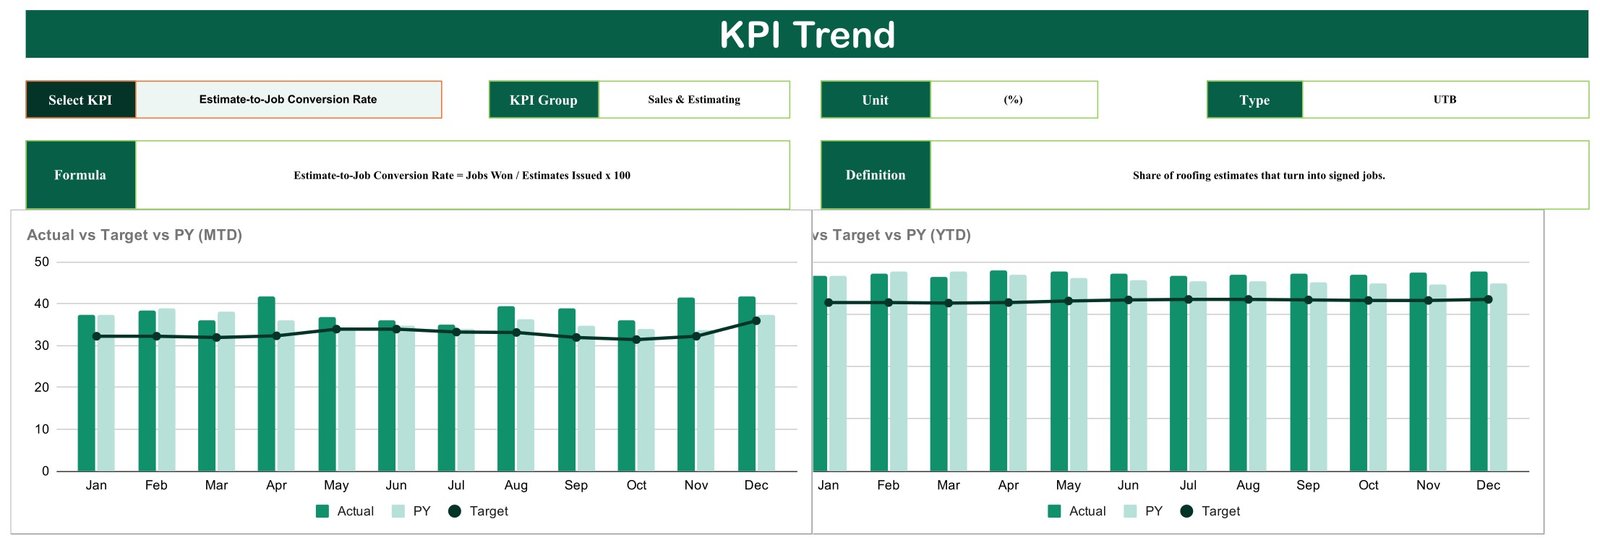
Pick one KPI from the dropdown at the top left. The row beside it fills in the KPI Group, the Unit and the Type – UTB or LTB – and the band underneath prints the Formula and the Definition. Two charts follow: Actual vs Target vs PY (MTD) and Actual vs Target vs PY (YTD), each running January to December with Actual and prior-year columns and a Target line across the top.
The MTD chart is the volatile one; the YTD chart is the one that settles arguments. For Estimate-to-Job Conversion Rate the sample data shows MTD bouncing between roughly 35 and 42 while YTD sits in a narrow band a little under 48 – the same business, read two different ways.
Sheet 3 – KPI Analysis

A ten-row register: number, KPI Group, KPI Name, Unit, Formula, Definition and Type. Squares Installed per Crew-Day is defined as Total Roofing Squares Installed divided by Total Crew-Days Worked, described as “average roofing squares a crew installs in one working day”, and flagged UTB. Callback / Rework Rate is Jobs Needing a Return Visit divided by Total Jobs Completed times 100, flagged LTB. This sheet is worth reading before anyone enters a number, because it is where “on time” and “rework” stop being opinions.
Sheet 4 – Data
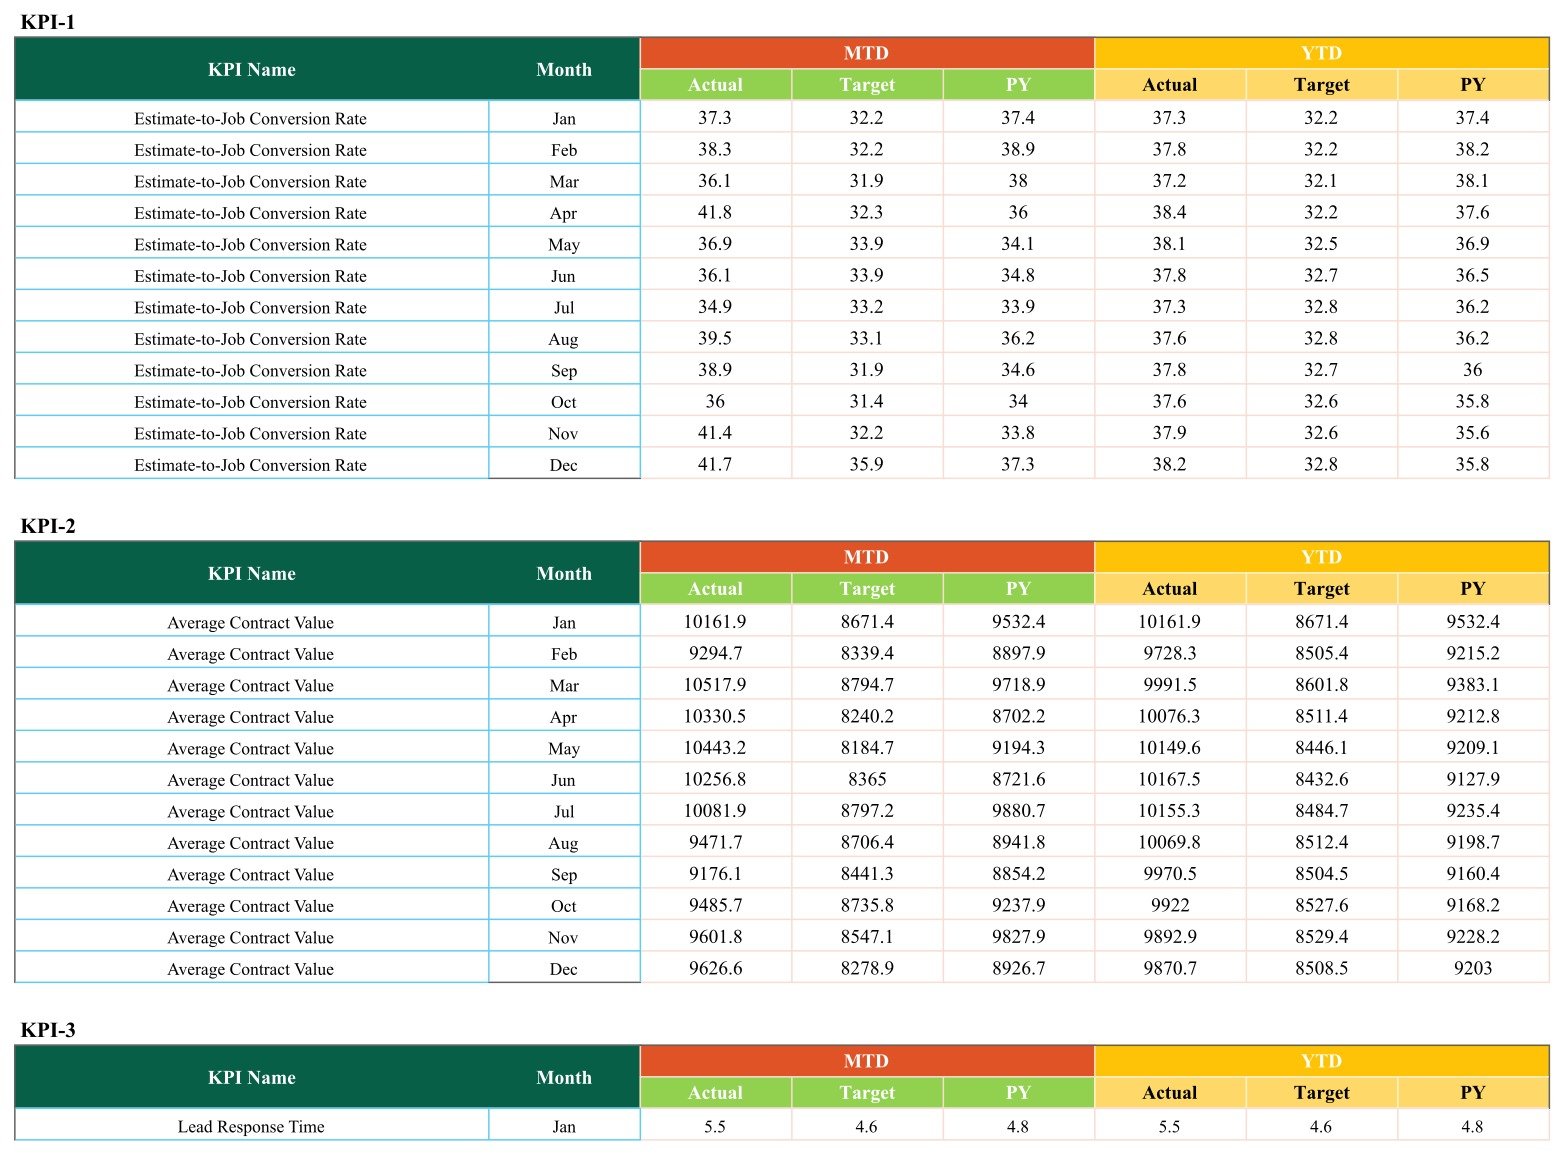
Ten stacked blocks labelled KPI-1 to KPI-10. Each block lists the KPI name against the twelve months, with an MTD group of Actual, Target and PY columns and a YTD group of the same three. Overtype the sample figures and the scorecard, the trend charts and the traffic lights all follow. Nothing else in the file needs touching.
Roofing Contractor KPI Scorecard in Google Sheets vs. Excel vs. Paid Roofing Software – Feature Comparison
| This Google Sheets scorecard | An Excel KPI workbook | Paid roofing / field-service platform | |
|---|---|---|---|
| Cost | One payment, no renewal | One payment, plus an Office licence | Typically a per-user monthly fee |
| Platform | Browser, any operating system | Excel desktop preferred | Web plus a mobile app |
| Setup time | Copy the sheet, type your numbers – under an hour | Similar, once Excel is installed | Onboarding, data migration and training |
| Real-time team collaboration | Native to Google Sheets | Only through OneDrive co-authoring | Yes |
| Mobile access | Google Sheets app | Excel mobile, layout permitting | Purpose-built app |
| Customisable fields | Rename or replace any of the ten KPIs | Same | Usually limited to vendor fields |
| Share with link | Yes, view-only or edit | Needs a cloud folder | Yes, within licensed seats |
| Year-1 cost at 5 users | The one-off template price | Template price plus licences | Often four figures |
| Job costing, scheduling, invoicing | No – measurement only | No | Yes |
| How the data arrives | You type or paste it monthly | You type or paste it monthly | Captured by the platform itself |
Who Should Use This Template
Roofing company owners running two to twenty crews who want one page instead of five reports. Estimators and sales managers who live in conversion rate, average contract value and lead response time. Production managers tracking squares per crew-day against on-time completion. Safety officers who want the recordable incident ratio next to production numbers rather than filed separately. And bookkeepers or office managers preparing a monthly pack for an owner, a lender or a franchise head office.
It suits a business that already has the numbers somewhere – in job files, an accounting package or a whiteboard – and simply has nowhere to put them together.
Real-World Use Cases
The Monday numbers meeting. A twelve-crew residential roofer enters ten figures on the Data sheet on the first Monday of the month and projects the scorecard. The reds set the agenda. In the sample month that would be Lead Response Time and Warranty Claim Rate, which is a very different conversation from “revenue was fine”.
The estimating review. An estimator opens the KPI Trend sheet, picks Average Contract Value, and shows that a dip in conversion rate came alongside a rise in average contract value – a deliberate move upmarket rather than a sales problem. Two charts, no slide deck.
The storm-restoration push. A production manager watches Squares Installed per Crew-Day and Callback / Rework Rate side by side during a busy season, because the fastest month of the year is usually the one that produces callbacks in the spring.
The lender pack. An owner shares the sheet view-only ahead of a finance conversation. Gross Profit Margin, on-time delivery and safety are on one page with targets and prior-year comparisons already on it.
Advantages of the Roofing Contractor KPI Scorecard in Google Sheets
- Nothing to install. A free Google account and a browser is the whole requirement – Windows, Mac, ChromeOS, iPhone or Android.
- One number entry point. Everything downstream is formula-driven from the Data sheet, so there is no second place to keep in step.
- Direction-aware scoring. Rate metrics where lower is better are handled properly instead of being coloured backwards.
- Documented formulas. The definitions travel with the file, so a new office manager can pick it up without a handover call.
- Genuinely editable. KPI names, groups, units and formulas are ordinary cells – swap Material Waste Rate for Crew Utilisation if that is what your business runs on.
- Shareable by link, with edit access for whoever enters the numbers and view-only for everyone else.
Opportunities for Improvement
Being straight about the limits is more useful than a feature list:
- Data entry is manual. There is no integration with accounting, CRM or field-service software, and nothing imports on its own. Someone types the ten monthly figures.
- Monthly grain only. The Data sheet is built around twelve months per KPI. Weekly or per-job reporting would need restructuring.
- No alerts or notifications. The file colours cells; it does not email anyone. Reviewing it is a calendar habit, not an automation.
- Ten KPIs is the layout. You can rename all ten, but adding an eleventh means extending the Data blocks and the card grid by hand.
- The sample figures are demo data. They are shaped to look plausible for a roofing company – they are not benchmarks and should not be quoted as industry averages.
- No job-level drill-down. A red month tells you to go and look at the jobs; it does not show you which ones.
Best Practices
- Agree the definitions before the numbers. Read the KPI Analysis sheet aloud with your estimator and production manager once. It costs ten minutes and prevents a year of arguments.
- Set targets you would bet on. Colours are scored against the target in that row, so a soft target produces a green page that teaches you nothing.
- Enter the month on a fixed day – the first Monday works well – and treat the scorecard as the agenda rather than a report to be admired.
- Read reds first, then ambers, and only look at greens when something has moved unusually far.
- Confirm anything red on the KPI Trend sheet before acting. One bad month against target is noise; two months plus a falling YTD line is a trend.
- Protect the Data sheet or keep an unedited copy. Google Sheets version history is a good safety net, and Google’s own guide to protecting ranges and sheets covers the mechanics.
- Keep the file per company, not per crew. If you want crew-level detail, run a separate operational tracker and leave this as the summary layer.
Explore Relevant Templates
- Roof Inspection Checklist in Google Sheets – job-level quality capture that feeds the callback and warranty numbers.
- Construction Progress & Cost Control Dashboard in Google Sheets – project-level cost and progress analysis.
- Construction Project Timeline in Google Sheets – schedule the work this scorecard measures.Roofing Contractor KPI Scorecard in Google Sheets
- Equipment Maintenance Log Tracker in Google Sheets – keep lifts, nailers and trucks serviceable.Roofing Contractor KPI Scorecard in Google Sheets
- Plumbing Business KPI Scorecard in Excel – the same scorecard pattern for another trade, built in Excel.Roofing Contractor KPI Scorecard in Google Sheets
- Construction Project Intelligence Kit – six construction templates across Excel, Power BI and Google Sheets.Roofing Contractor KPI Scorecard in Google Sheets
If you would like to sharpen the spreadsheet side of this, the Excel Pivot Tables & Dashboards course on NextGenTemplates Academy teaches the reporting skills behind a scorecard like this, with practice files.
Get the Roofing Contractor KPI Scorecard in Google Sheets
Frequently Asked Questions
Is this the KPI Scorecard or the KPI Dashboard?
This is the KPI Scorecard – a one-page card layout with traffic lights, a month picker, a KPI Trend sheet and a KPI Analysis sheet, all fed from one monthly Data sheet. The KPI Dashboard line and the analytical Google Sheets dashboards are separate products with charts, slicers and transaction-level data. They complement this rather than duplicate it.
Does it connect to accounting or roofing software?
No. There is no integration, no sync and no import routine. You enter the monthly figures on the Data sheet yourself. That is what keeps it to plain Google Sheets with nothing to authorise.Roofing Contractor KPI Scorecard in Google Sheets
Does the Recordable Safety Incident Rate cover OSHA reporting?
No. The sheet calculates recordable incidents per 100,000 labour hours, which is the arithmetic behind that ratio and nothing more. It is not a recordkeeping system, not an OSHA log, and not a substitute for your own reporting duties or safety programme.
Can I change the ten KPIs?
Yes. Names, groups, units, formulas, definitions and the UTB/LTB flag are ordinary cells. Change them and the cards, colours and charts follow.
Do I need Excel?
No. It is a native Google Sheets file. Excel is not required at any point.Roofing Contractor KPI Scorecard in Google Sheets
How many people can use it at once?
As many as you share it with. It behaves like any Google Sheet – edit access for whoever maintains the numbers, view-only for everyone else.Roofing Contractor KPI Scorecard in Google Sheets
What exactly do I download?
A PDF containing the “Make a copy” link. Click it and Google Drive creates your own editable copy of the scorecard; the master file is never altered.Roofing Contractor KPI Scorecard in Google Sheets
About the Author
Built by PK – Microsoft Certified Professional with 15+ years of Excel, Google Sheets, and Power BI experience. Founder of NextGenTemplates, reaching 300K+ subscribers across YouTube channels. Every template is hand-built and tested before release.
Conclusion
The Roofing Contractor KPI Scorecard in Google Sheets does one job properly: it turns ten monthly numbers into a page you can read in thirty seconds and argue about productively. Estimating, production, quality, safety and margin sit together, each scored against its own target, each with a year of history behind it. It will not dispatch a crew or raise an invoice – it is the layer above that, the one most roofing companies never build.Roofing Contractor KPI Scorecard in Google Sheets
Get the template here: Roofing Contractor KPI Scorecard in Google Sheets.