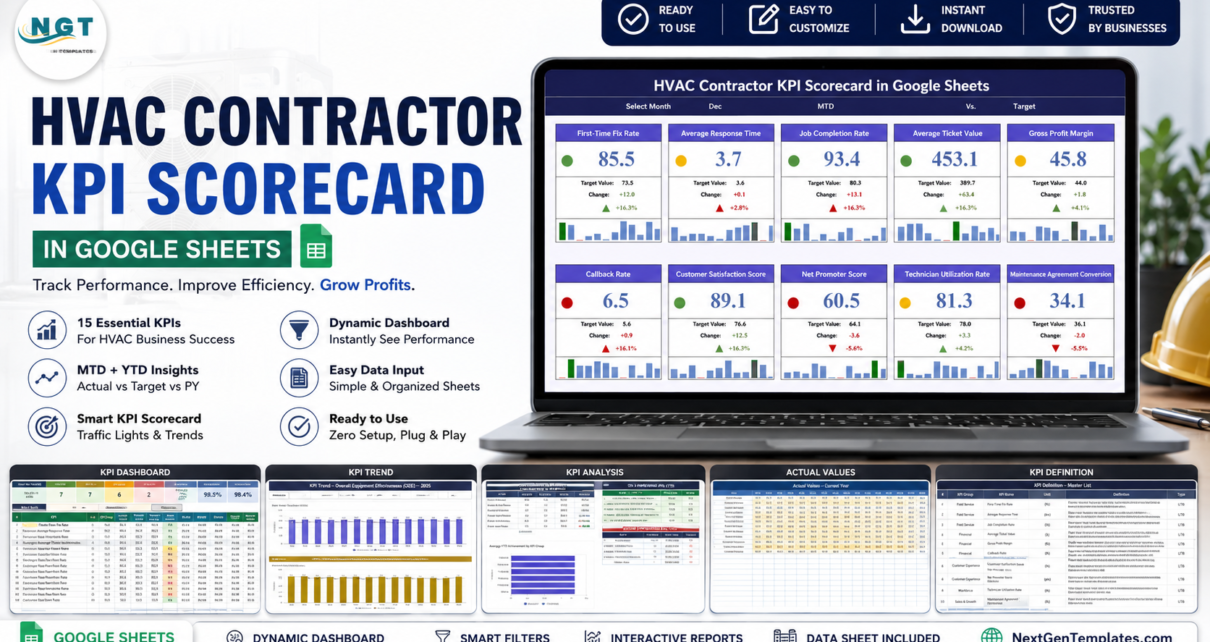
The HVAC Contractor KPI Scorecard in Google Sheets puts 10 heating and cooling KPIs across 5 groups on a single page, backed by 12 months of Actual, Target and Prior-Year figures spread over just 4 sheets. Every KPI card carries a red, amber or green light, a variance line and a 12-month mini bar chart. In the December sample month that ships with the file, four KPIs read green, three amber and three red — the kind of honest split a real service month actually produces.
Most HVAC companies already have the numbers. They sit in a job log, a callback list, a technician timesheet and a P&L, and nobody stitches them together until the year is over. The problem this template solves is the monthly read: one page that says whether first-time fix rate, callback rate, ticket value and technician utilisation are moving the right way — before the season is lost.
Get the HVAC Contractor KPI Scorecard in Google Sheets
Key Features of the HVAC Contractor KPI Scorecard in Google Sheets
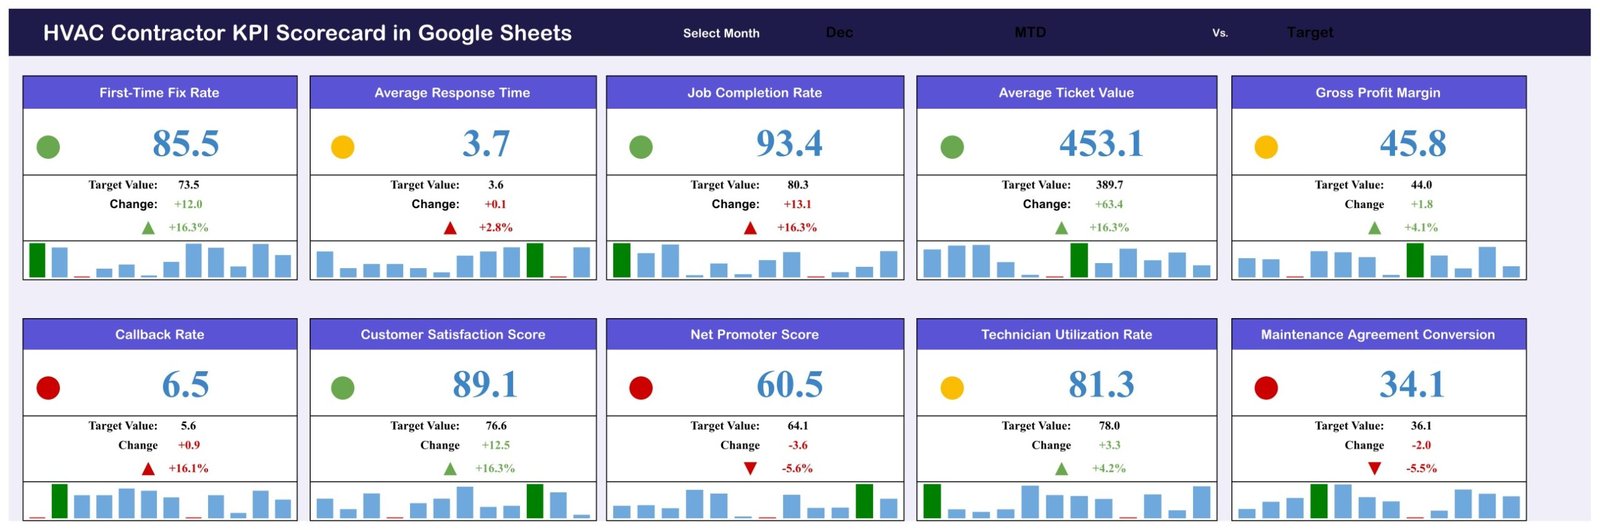
- Ten KPI cards, one screen. First-Time Fix Rate, Average Response Time, Job Completion Rate, Average Ticket Value, Gross Profit Margin, Callback Rate, Customer Satisfaction Score, Net Promoter Score, Technician Utilization Rate and Maintenance Agreement Conversion.
- Three dropdowns drive everything. A Select Month picker, an MTD / YTD switch, and a comparison switch that measures each KPI against Target or against Prior Year. Change one and all ten cards, lights and sparklines move together.
- Direction-aware traffic lights. Each KPI is typed UTB (upper the better) or LTB (lower the better). Callback Rate and Average Response Time go green when they fall; Gross Profit Margin goes green when it rises.
- A 12-month sparkline under every value, with the selected month highlighted, so the trend sits directly beneath the current reading.
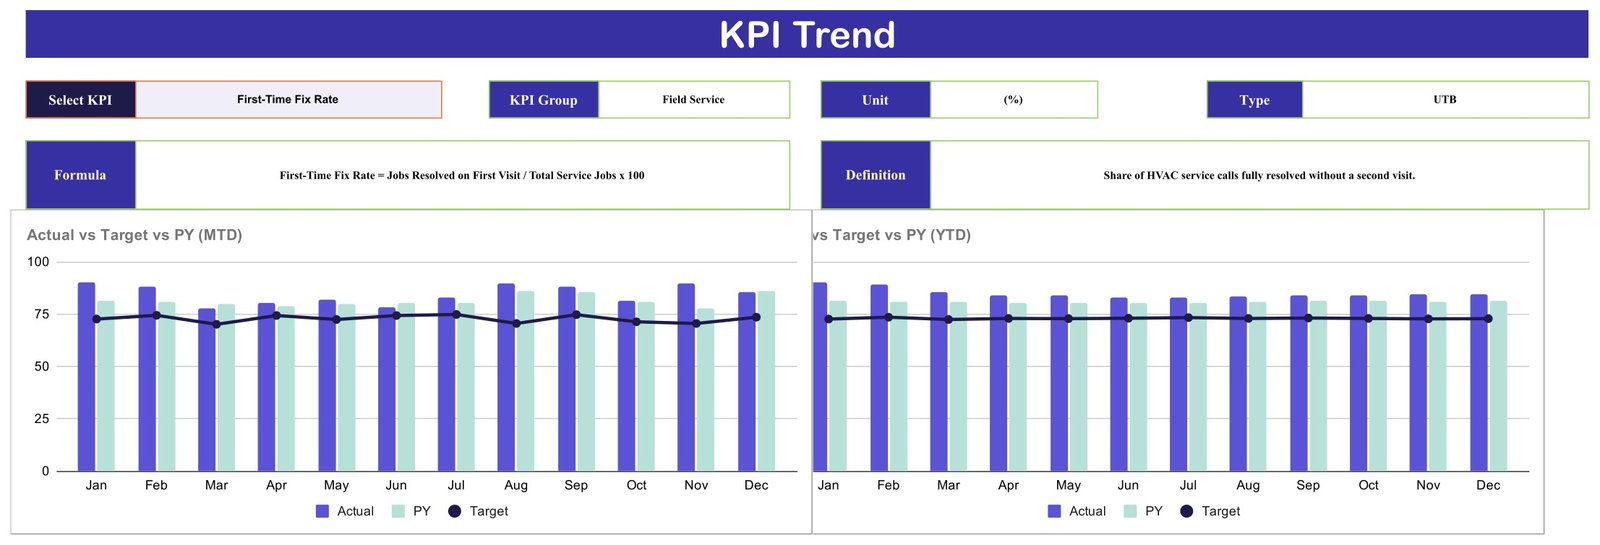
- A KPI Trend page that draws Actual vs Target vs PY (MTD) and Actual vs Target vs PY (YTD) for any single KPI across Jan to Dec.
- A KPI Definition master list holding the group, unit, formula, plain-English definition and direction type for all ten KPIs.
- One input sheet. There is exactly one place you type — the KPI Data sheet — which keeps the file easy to hand to an office manager.
Sheets Explanation
KPI Scorecard
Ten cards, five across and two down. Each shows the KPI name, its current value, a traffic light, the Target Value, the absolute Change, the percentage change with an up or down arrow, and a 12-month sparkline. In the December sample, First-Time Fix Rate reads 85.5 against a 73.5 target and lights green, while Callback Rate reads 6.5 against a 5.6 target and lights red.
KPI Trend
Choose a KPI from the Select KPI dropdown and this page reports its KPI Group, Unit, Type and Formula alongside a written definition, then charts Actual vs Target vs PY twice — once on an MTD basis, once on a YTD basis — with monthly columns and a Target line running Jan to Dec.
KPI Definition
A reference table with columns for #, KPI Group, KPI Name, Unit, Formula, Definition and Type. It documents, for instance, that Technician Utilization Rate = Billable Field Hours / Total Paid Technician Hours x 100, and that Maintenance Agreement Conversion measures how often one-off service calls turn into recurring plans.

KPI Data
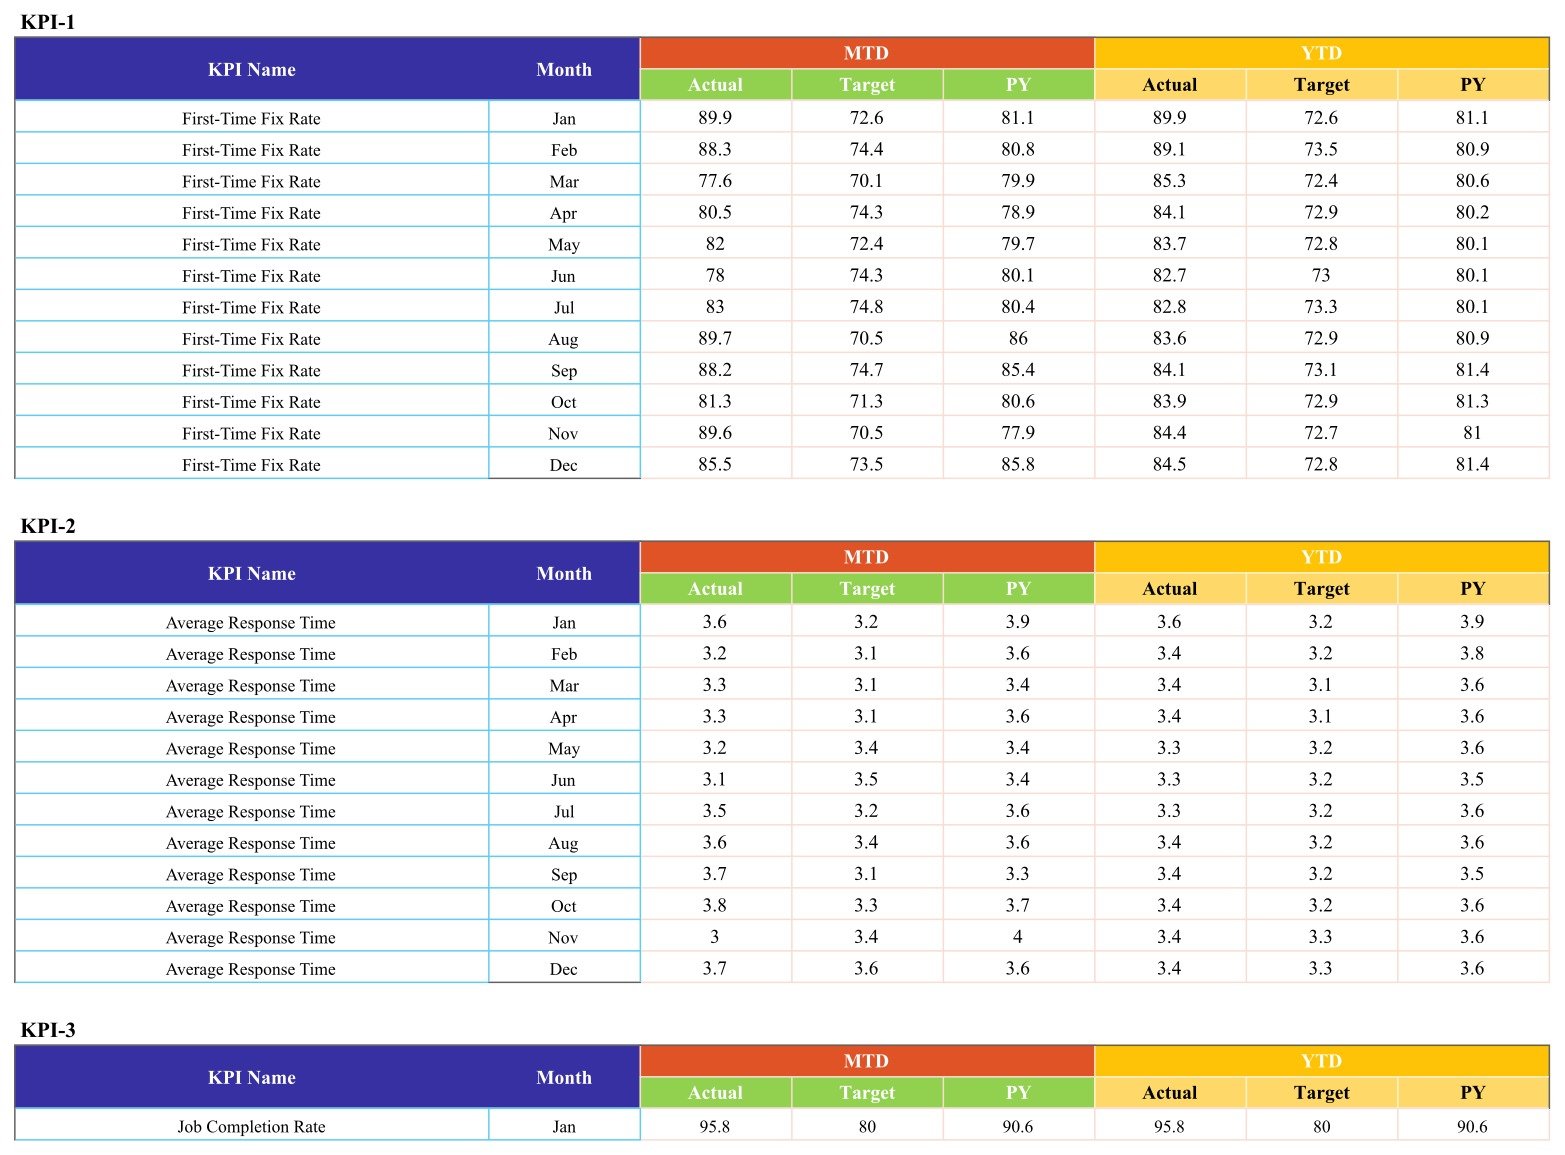
The single input sheet. One block per KPI, labelled KPI-1 through KPI-10, each with twelve monthly rows carrying MTD Actual, Target and PY next to YTD Actual, Target and PY. Overwrite the sample figures with your own and every card, light and chart in the file follows.
HVAC Contractor KPI Scorecard in Google Sheets vs. Microsoft Excel Dashboard vs. ServiceTitan / Housecall Pro — Feature Comparison
| Feature | HVAC Contractor KPI Scorecard in Google Sheets | Microsoft Excel Dashboard | ServiceTitan / Housecall Pro |
|---|---|---|---|
| Cost | $8.99 one-time | $15-30 one-time plus an Office licence | $79-400 per user per month |
| Platform | Google Sheets, any browser | Excel desktop | Vendor cloud plus mobile app |
| Setup time | Under 10 minutes | 15-30 minutes | Days to weeks of onboarding |
| Real-time team collaboration | Built in | Only via OneDrive co-authoring | Yes |
| Mobile access | Google Sheets mobile app | Limited | Native app |
| Customisable KPIs and formulas | Fully open formulas | Open formulas | Vendor-defined metrics only |
| Share with a link | Yes | File attachment | A seat is required per viewer |
| Dispatching and invoicing built in | No — reporting only | No | Yes |
| Year-1 cost at 5 users | $8.99 total | About $25 plus licences | $4,700-24,000 |
For HVAC owners who want an honest monthly read on fix rates, callbacks and margin without paying per-technician SaaS fees, the HVAC Contractor KPI Scorecard in Google Sheets sits in the sweet spot.
Who Should Use This Template
Perfect for:
- Owners of residential and light-commercial HVAC companies running 3-40 technicians
- Service managers reporting first-time fix rate, response time and callback rate to ownership monthly
- Field service operations leads who need MTD and YTD side by side against target and prior year
- Office managers and bookkeepers who already assemble these numbers by hand each month
Not a fit if:
- You want dispatching, scheduling, invoicing or technician GPS — this is a reporting scorecard, not a field service management system
- You expect it to pull data automatically from ServiceTitan, Housecall Pro or QuickBooks — it has no integrations and every figure is entered by you
- You need per-job or per-technician drilldown; this file reports at the monthly company level
- You need more than 10 KPIs out of the box
Real-World Use Cases
Marco owns a 12-technician residential HVAC company in Phoenix. On the first Monday of every month he sets the picker to the month just closed and reads the red lights first. Last quarter that showed callbacks climbing while ticket value held steady, so he sent two technicians on a refrigerant-charging refresher rather than spending the same money on leads.
Priya is service manager for a commercial HVAC contractor with 28 field staff. In her quarterly review she flips the comparison switch to Vs. PY to show the owner that First-Time Fix Rate beat the same months last year, then opens the KPI Trend page to walk through Average Response Time improving every month from March onwards.
Dan runs a two-van heating and cooling shop and keeps his own books. On the last day of each month he fills the KPI Data sheet from his job log, then screenshots the scorecard for his lender’s annual review. No subscription, no per-seat fee, and the file lives in the same Drive folder as his invoices.
Advantages of the HVAC Contractor KPI Scorecard in Google Sheets
- It replaces a recurring cost with a one-time one. Five seats of a field service platform runs into thousands a year; this is a single purchase with lifetime access.
- It is honest about direction. Because each KPI is typed UTB or LTB, a falling Callback Rate scores as a win rather than being flagged as a decline — a mistake generic spreadsheet templates make constantly.
- It shortens the monthly close. The reporting format never changes, so the work each month is data entry rather than rebuilding a report.
- It is fully transparent. Every formula is visible and unlocked, and the KPI Definition sheet states exactly how each number is calculated — useful when an owner asks where a figure came from.
- It travels. Google Sheets opens in any browser and in the Google Sheets mobile app, so a manager can read the scorecard from a truck without installing anything. See Google’s own guide to Sheets for the sharing basics.
Opportunities for Improvement
It is worth being clear about what this file is not. It reports at the company level for one month at a time, so there is no per-technician or per-job drilldown, and no way to see which two vans are generating the callbacks. Adding that means extending the KPI Data sheet yourself.
Data entry is manual. There is no connector to a field service platform or an accounting system, so somebody has to move twelve months of numbers in once and then top up one row per month. For a shop already exporting monthly summaries that is a five-minute job; for a company with no job log at all it is the harder half of the work.
The ten KPIs are a deliberate, opinionated set. If your business turns on metrics this file does not carry — membership churn, install versus service revenue mix, or truck-roll cost — you will be renaming KPIs rather than adding an eleventh card. The HVAC Contractor KPI Dashboard in Google Sheets carries 15 KPIs across three input sheets if you need the wider set.
Best Practices
- Set targets before you set data. The traffic lights are only as meaningful as the Target column, so agree those numbers with your service manager first.
- Load a full prior year. The Vs. PY switch is the most persuasive view in the file, and it needs the PY columns populated to be worth anything.
- Close the month on the same day every month. Consistency matters more than precision when you are reading trend.
- Review the red lights first, then the ambers. Three reds is a normal month; three reds in the same KPI group three months running is a problem.
- Keep the KPI Data sheet as the only place anyone types. If a figure needs correcting, correct it there rather than on the scorecard page.
- Reword the definitions to match your language. If your team says “recall” rather than “callback”, change it on the KPI Definition sheet so nobody has to translate.
Explore Relevant Templates
- HVAC Service Dashboard in Google Sheets — the analytical counterpart, with job, revenue and technician charts you can slice, rather than a fixed monthly scorecard.
- Field Service KPI Dashboard in Google Sheets — the same reporting discipline written for field service work generally.
- HVAC Contractor KPI Dashboard in Google Sheets — a different product in the same family: 15 KPIs, a traffic-light grid, a KPI Analysis page and three input sheets.
- Equipment Maintenance Log Tracker in Google Sheets — the job-level log that produces the numbers this scorecard summarises.
- HVAC Maintenance Checklist in Google Sheets — a low-cost field checklist for the technicians whose work these KPIs measure.
Also available as: prefer Excel? The same scorecard is available for it — HVAC Contractor KPI Scorecard in Excel.
Want to build skills like this step by step? The Excel Pivot Tables & Dashboards course on NextGenTemplates Academy walks you through it with practice files.
Get the HVAC Contractor KPI Scorecard in Google Sheets
Frequently Asked Questions
What KPIs does the HVAC Contractor KPI Scorecard in Google Sheets track?
It tracks 10 KPIs in 5 groups: First-Time Fix Rate, Average Response Time and Job Completion Rate (Field Service); Average Ticket Value, Gross Profit Margin and Callback Rate (Financial); Customer Satisfaction Score and Net Promoter Score (Customer Experience); Technician Utilization Rate (Workforce); and Maintenance Agreement Conversion (Sales and Growth).
Does the HVAC Contractor KPI Scorecard connect to ServiceTitan or QuickBooks?
No. The HVAC Contractor KPI Scorecard in Google Sheets has no integrations and imports nothing automatically. You enter monthly figures on the KPI Data sheet and the scorecard, traffic lights and charts calculate from there. That independence is why it works alongside any system you already run.
How does this compare to ServiceTitan or Housecall Pro?
Those platforms run your dispatching, scheduling and invoicing and charge $79-400 per user per month. The HVAC Contractor KPI Scorecard in Google Sheets does none of that — it is an $8.99 one-time reporting layer. Many shops run both, using the platform for operations and the scorecard for the monthly management read.
How is this different from the HVAC Contractor KPI Dashboard in Google Sheets?
The scorecard is ten KPI cards with RAG lights, a comparison-switch dropdown and one monthly data sheet across 4 pages. The KPI Dashboard is a wider build with a month picker, a traffic-light grid, KPI Trend and KPI Analysis pages, three input sheets and 15 KPIs. Choose the scorecard for a fast monthly read.
How long does setup take?
Under 10 minutes. Making your own copy takes seconds, and the real work is pasting twelve months of MTD and YTD figures into the KPI Data sheet. The HVAC Contractor KPI Scorecard in Google Sheets ships with sample data already loaded, so you see the finished layout before changing anything.
Can I rename the KPIs or change how they are scored?
Yes. Every formula is unlocked. Rename any KPI on the KPI Definition sheet, change its unit, and switch its Type between UTB and LTB so the traffic light scores in the correct direction. The scorecard page reads those settings rather than hard-coding them.
Do I need a Google Workspace subscription to use it?
No. A free personal Google account is enough to open the HVAC Contractor KPI Scorecard in Google Sheets, make your own copy and share it. There is no per-user fee and no recurring cost beyond the one-time purchase.
About the Author
Built by PK — Microsoft Certified Professional with 15+ years of Excel, Google Sheets, and Power BI experience. Founder of NextGenTemplates, reaching 300K+ subscribers across YouTube channels. Every template is hand-built and tested before release.
Conclusion
Ten KPIs, four sheets, twelve months of history and a traffic light on every card — the HVAC Contractor KPI Scorecard in Google Sheets exists to make the monthly management meeting take fifteen minutes instead of an afternoon. It will not dispatch a truck or raise an invoice, and it says so plainly. What it will do is tell you, on one page, whether your fix rate is holding, whether callbacks are eating the margin, and whether maintenance agreements are actually converting.
Instant download · One-time payment · No subscription
Last updated: August 2026