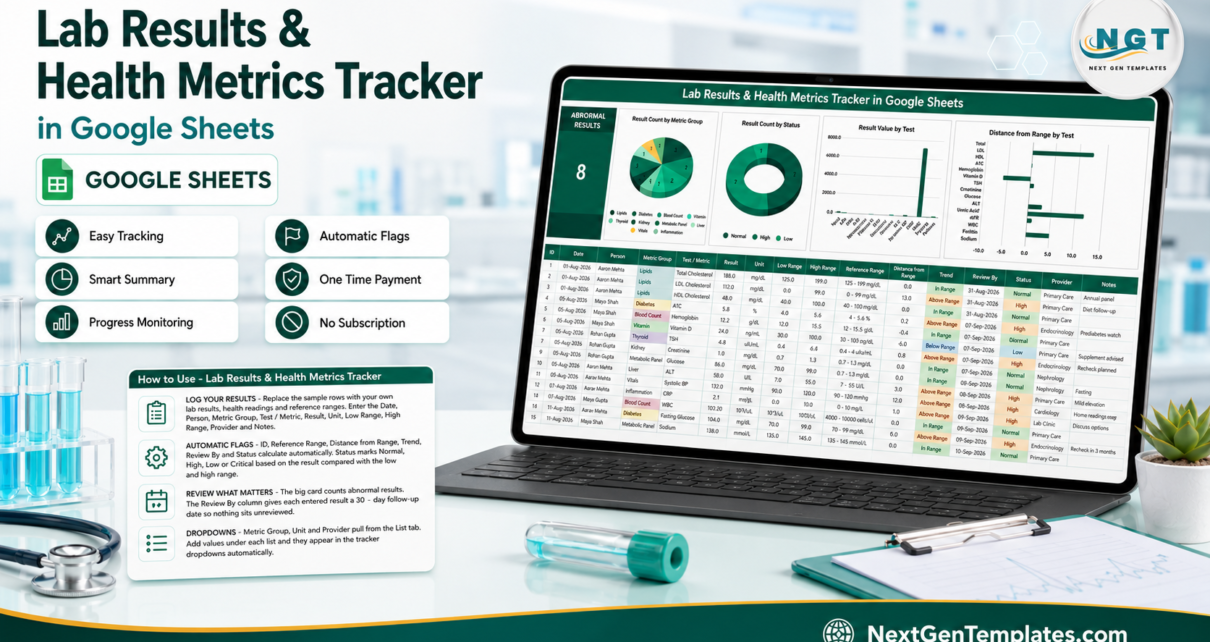
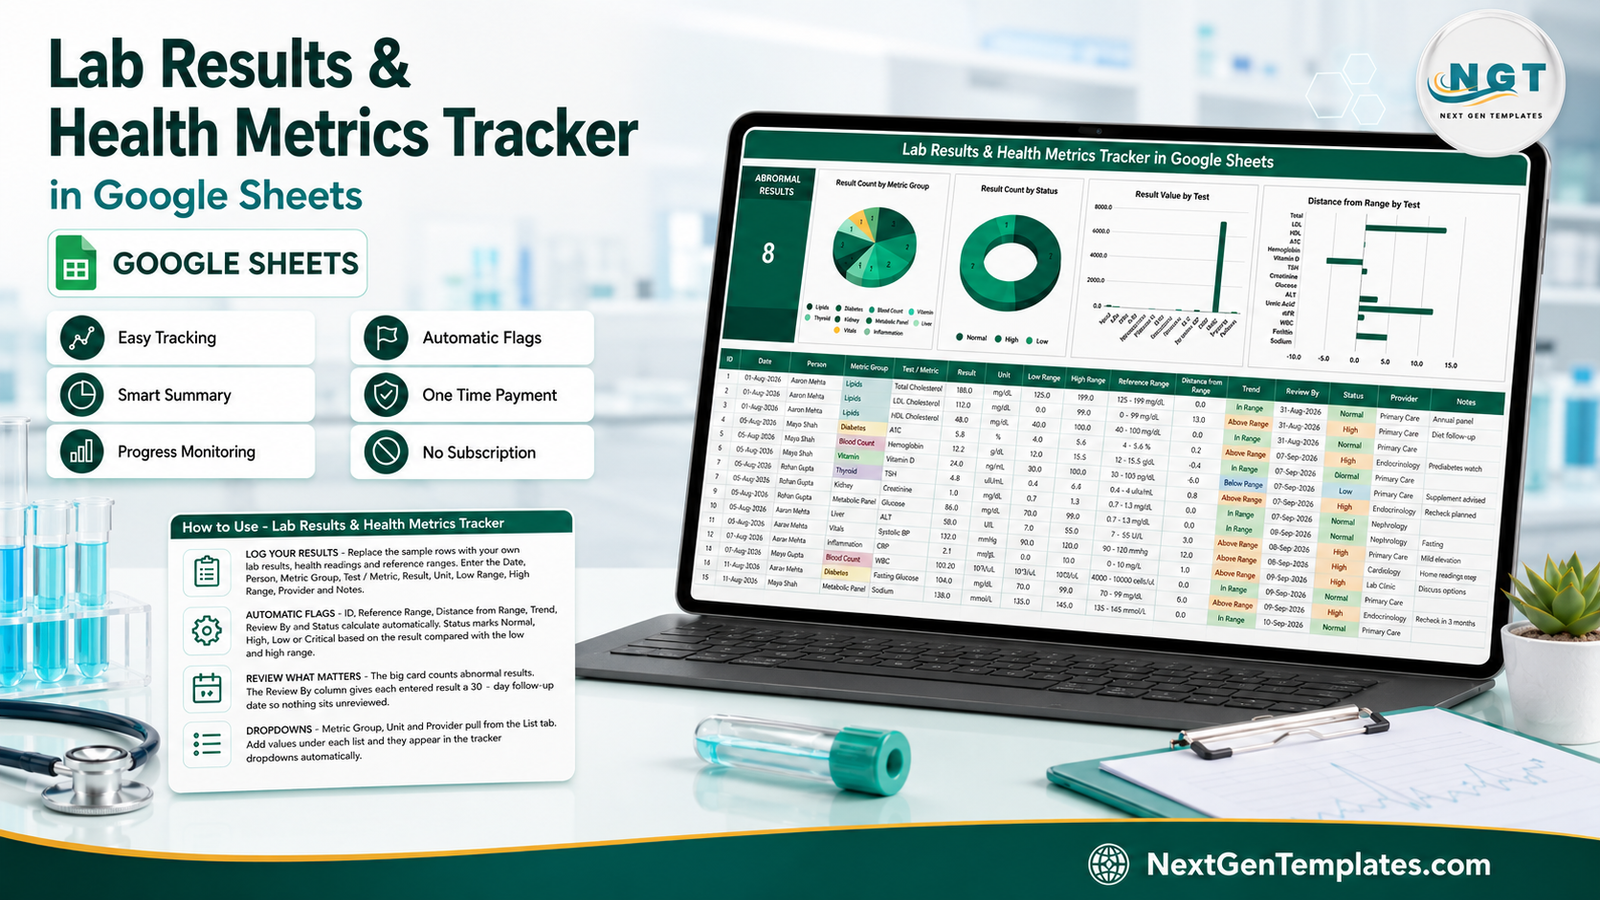
Most people’s lab history lives in three places at once: a folder of PDFs, a few photographs of a printout, and memory. When a doctor asks whether a value has moved since last year, none of those three answer quickly. The Lab Results Tracker in Google Sheets replaces all of them with one page – 16 columns, 6 of which are formulas, 4 charts, 10 pre-loaded metric groups, 15 demo rows and space for roughly 985 real results. You enter ten fields per test; the sheet writes the rest and redraws the charts.
Before anything else, the important part. This is a spreadsheet for organising records you already have. It is not a medical device, not diagnostic software, and it does not give medical advice. It does not know or look up reference ranges, and it never interprets a lab value. Its Status column reflects one thing only: whether the number you typed sits between the Low Range and the High Range that you also typed, copied from your own report. It does not replace a clinician, and it is not compliant, regulated storage for anyone’s medical records. This article walks through what it does and, just as importantly, what it deliberately does not do.
Get the Lab Results & Health Metrics Tracker in Google Sheets
Key Features of the Lab Results & Health Metrics Tracker in Google Sheets
An abnormal-results counter you actually use
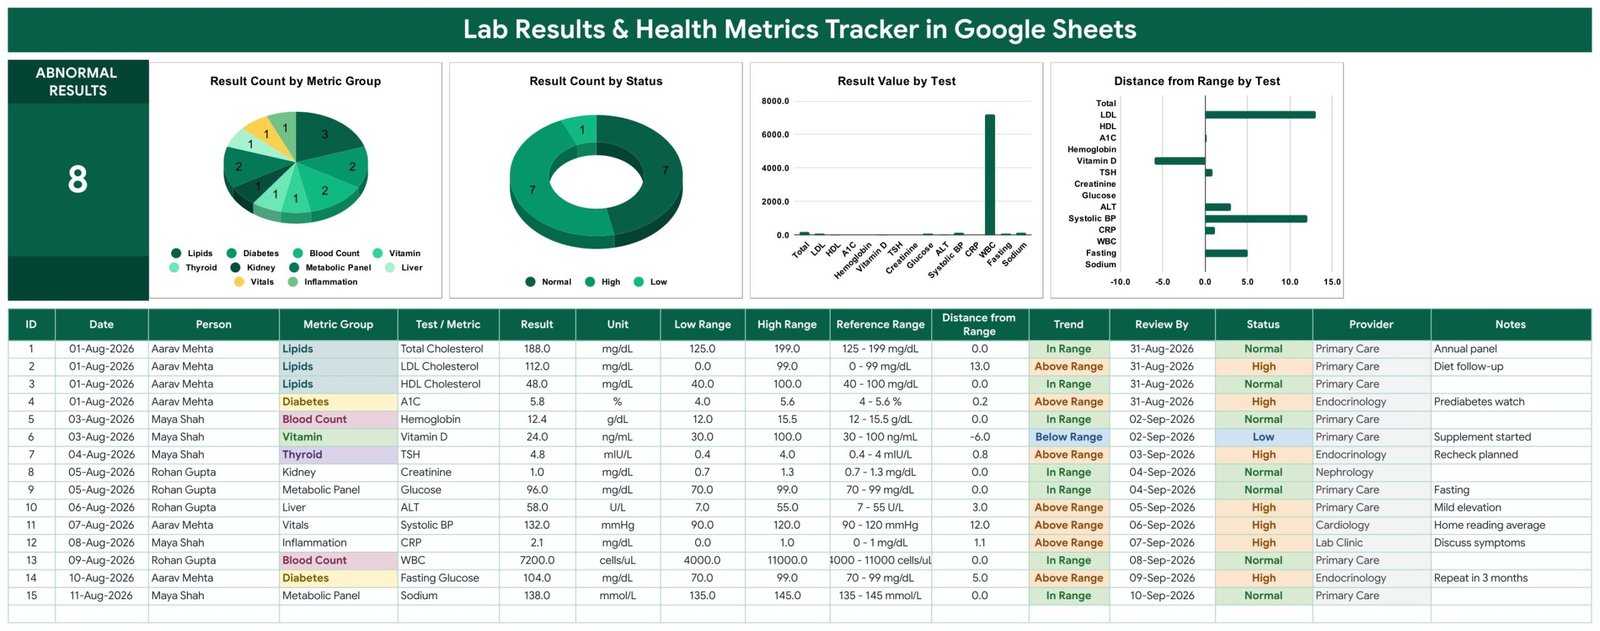
The top-left card counts every row whose Status is not Normal. In the shipped demo data it reads 8 out of 15. It is not a score and it is not a warning – it is a shortlist generator. Sort by Status, look at the flagged rows, and you have the agenda for your next appointment instead of a stack of paper.
Six columns that fill themselves
ID, Reference Range, Distance from Range, Trend, Review By and Status are all formula-driven. Reference Range simply concatenates your Low Range, High Range and Unit into a readable string such as 12 – 15.5 g/dL. Distance from Range is the signed gap: 0.0 inside your range, positive above your High Range, negative below your Low Range. Trend reads In Range, Above Range or Below Range. Review By adds 30 days to the test date. Status colour-codes the row.
Four charts wired straight to the log
Result Count by Metric Group, Result Count by Status, Result Value by Test and Distance from Range by Test all read rows 16 to 1000 of the log directly. There are no helper tables, no pivot ranges and nothing to refresh – paste a new row and every visual moves.
Dropdowns you can extend without touching validation rules
Metric Group, Unit and Provider pull from the List tab, which is read down to row 500. Ten metric groups ship in the file (Blood Count, Metabolic Panel, Lipids, Diabetes, Thyroid, Vitamin, Kidney, Liver, Inflammation and Vitals) alongside ten units from mg/dL to bpm and six provider labels. Type an eleventh under any list and it appears in the dropdown at once.
One file for a whole household
A Person column sits third in the log. Three names appear in the demo data. Filter it and each person’s history reads as its own record, which matters when one carer is keeping the file for several people.
Tracker Pages Explained
Tab 1 – Tracker
The entire product on a single scrollable page. A dark green title banner, the Abnormal Results card on the left, then the four charts across the top. Below that, the log: ID, Date, Person, Metric Group, Test / Metric, Result, Unit, Low Range, High Range, Reference Range, Distance from Range, Trend, Review By, Status, Provider and Notes. Fifteen sample rows are supplied so that every conditional format and formula is visible before you enter anything of your own.
Tab 2 – List
Four vertical lists – Metric Group, Unit, Status and Provider – plus a one-line note reminding you that the dropdowns read to row 500. This is the only tab you need to edit to make the tracker match your own lab’s vocabulary.
Tab 3 – Explore More Templates
A short index of related NextGenTemplates products with a welcome coupon. Delete it if you would rather keep the file to two tabs; nothing else depends on it.
Lab Results Tracker in Google Sheets vs. Excel vs. a Paid Health App – Feature Comparison
| Feature | This Google Sheets tracker | DIY Excel workbook | Paid health-record app |
|---|---|---|---|
| Cost | One payment, no renewal | Free, but hours of your time | Usually a monthly or annual subscription |
| Platform | Google Sheets, browser or mobile | Excel desktop | Vendor app and cloud |
| Setup time | About 5 minutes | Formula and chart building from scratch | Sign-up plus provider linking |
| Share with a family member | Standard Google share link | Email the file | Plan-dependent |
| Mobile access | Yes, no extra licence | Limited | Yes |
| Who holds the data | You, in your own Drive | You | The vendor |
| Change columns and ranges | Every one is editable | Yes, if you built it | Rarely |
| Interprets results for you | No, by design | No | Some do |
| Regulated clinical storage | No | No | Varies |
Who Should Use This Template
It suits anyone whose results arrive faster than they can be filed: people managing a long-term condition with quarterly panels, carers holding records for a parent, families who would rather keep one file than five, and anyone who wants to walk into a consultation with a sorted history rather than a camera roll.
It does not suit a clinic. It is not patient-record software, not an electronic health record, and it carries no HIPAA or GDPR compliance claim – a personal Google Sheet is not regulated clinical storage, and you should not log someone else’s health data in it without their agreement. It also will not suit anyone hoping a spreadsheet will explain a result to them. For clinic-side scheduling, the Patient Follow-Up Visit Calendar in Google Sheets is the appropriate tool.
Real-World Use Cases
Four years of thyroid results across two labs
Priya has TSH values from two different laboratories, each printed against its own reference range. She logs each result with the range from that specific report, so the flags stay honest, and the Result Value by Test chart shows the run as one series for the first time.
Quarterly panels for an elderly parent
Daniel tracks kidney and metabolic panels for his father across three specialists. The Person and Provider columns keep the record attributable, and the Review By date tells him when the next round is due without him having to work it out.
A household of three
The Shah family logs annual panels, vitamin levels and home blood-pressure averages in one file, filtered by name whenever someone has an appointment. One sheet, one link, three histories.
Advantages of the Lab Results & Health Metrics Tracker
- Nothing to install. No macros, no add-ons, no extensions – it is a native Google Sheets file that opens on any device.
- Honest by construction. Because the ranges come from you, the sheet cannot apply an inappropriate cut-off to your data. It has no built-in clinical thresholds at all.
- Low entry cost per row. Ten typed fields, three of them dropdowns, and six columns appear on their own.
- Charts that never go stale. Direct ranges rather than helper tables means there is nothing to rebuild when you add data.
- Yours to reshape. Columns, colours, ranges and lists are all editable; the file is in your Drive, not on someone else’s server.
- Prints as a single page. Useful when a clinician would rather look at paper than a phone.
Opportunities for Improvement
An honest list, because a template that claims no weaknesses is not being straight with you:
- The demo rows carry plausible-looking ranges. They are filler, not guidance. Reference ranges vary by laboratory, assay, age and sex, so delete the samples and use your own report’s numbers before you trust a single flag.
- There are no reminders. Review By writes a date; it does not email, notify or alert. Copy that date into your calendar yourself.
- Ranges are per row, not per test. If you log the same test fifty times you type its range fifty times – or copy it down. A per-test lookup table would be a sensible extension.
- No unit conversion. A result in mmol/L and the same test in mg/dL will chart as two unrelated magnitudes. Pick one unit per test and stay with it.
- The Result Value by Test chart is dominated by large numbers. A white-cell count in the thousands flattens everything else on the same axis. Distance from Range by Test is the more readable of the two for mixed panels.
- The log is wired to row 1000. Heavy users will need to extend the chart ranges by hand.
Best Practices
- Copy ranges off the report in front of you, not off the internet and not off the demo rows. The flag is only as meaningful as the range you paired it with.
- Log the unit every time. It is what makes Reference Range readable and keeps the charts comparable.
- Use Notes for context – fasting or not, time of day, a new supplement, a recent illness. Six months later it is the note, not the number, that explains the outlier.
- Filter, don’t delete. Keep old results in the file; a single reading means far less than a trend.
- Take the flagged shortlist to your appointment and let the clinician interpret it. That is the whole point of the abnormal counter.
- Share deliberately. Google’s own sharing and permissions documentation is worth five minutes before you send a health file to anyone.
Explore Relevant Templates
- Blood Pressure Log Tracker in Google Sheets – daily home readings between lab visits.
- Blood Sugar (Diabetes) Log Tracker in Google Sheets – fasting and post-meal glucose.
- Medication & Pill Tracker in Google Sheets – doses taken and refill timing.
- Symptom & Pain Diary Tracker in Google Sheets – the qualitative diary that sits beside the numbers.
- Body Measurements Tracker in Google Sheets – weight and measurement history.
If you would like to get faster at building trackers like this one, the NextGenTemplates Academy learning paths offer guided lessons with practice files.
Get the Lab Results & Health Metrics Tracker in Google Sheets
Frequently Asked Questions
Does this tracker interpret my lab results or give medical advice?
No. It is not a medical device, not diagnostic software, and it gives no medical advice. It performs no interpretation of any lab value and has no knowledge of reference ranges. Status, Trend and Distance from Range are arithmetic comparisons against the Low Range and High Range you entered from your own report. A flag means “outside the numbers you typed” and nothing more. It does not replace a clinician.Lab Results & Health Metrics Tracker in Google Sheets
Is it HIPAA or GDPR compliant storage?
No, and it makes no such claim. The file sits in your own Google Drive under your own account and nothing is transmitted to NextGenTemplates, but a personal spreadsheet is not regulated clinical storage. Do not use it as a patient-record system, and log another person’s data only with their consent.Lab Results & Health Metrics Tracker in Google Sheets
Are the sample reference ranges safe to keep?
No – treat them as filler. Delete the fifteen demo rows and enter the ranges printed on your own reports, which vary by laboratory and by person.
Will it remind me when a test is due?
No. The Review By column writes a date 30 days out so you can sort by it. The sheet sends no email, notification or alert of any kind.Lab Results & Health Metrics Tracker in Google Sheets
Do I need Excel or any add-on?
No. It is a native Google Sheets file with no macros or scripts, and it works in a browser or the Google Sheets mobile app.Lab Results & Health Metrics Tracker in Google Sheets
Can I track more than one person?
Yes. The Person column and the dropdown lists are built for it – filter by name to read one history at a time.Lab Results & Health Metrics Tracker in Google Sheets
How many rows does it hold?
The log and all four charts run to row 1000, which leaves roughly 985 rows once the demo data is cleared. Extending the ranges is a manual edit.Lab Results & Health Metrics Tracker in Google Sheets
About the Author
Built by PK – Microsoft Certified Professional with 15+ years of Excel, Google Sheets, and Power BI experience. Founder of NextGenTemplates, reaching 300K+ subscribers across YouTube channels. Every template is hand-built and tested before release.Lab Results & Health Metrics Tracker in Google Sheets
Conclusion
A lab-results file is only worth keeping if it is quick enough that you keep it up. This one asks for ten fields per result, fills in six more, and redraws four charts without being told. What it will never do is tell you what a number means – it has no clinical thresholds, no interpretation and no opinion, only the ranges you gave it. That is a deliberate limit, not a missing feature: the record belongs in the sheet, and the conversation about it belongs with your doctor.Lab Results & Health Metrics Tracker in Google Sheets
Get the Lab Results & Health Metrics Tracker in Google Sheets from NextGenTemplates, open the PDF, click Make a copy, and log your first result in about two minutes. For more Google Sheets walkthroughs, subscribe to NeoTechNavigators on YouTube.Lab Results & Health Metrics Tracker in Google Sheets