Appointments are short. Memory is worse than we think it is. Asked “how has the pain been since March?”, most people give a shrug and a number they have half invented on the spot. A written diary fixes that, and a spreadsheet diary fixes it without a subscription, an account or an app that owns your history.Symptom & Pain Diary Tracker in Google Sheets
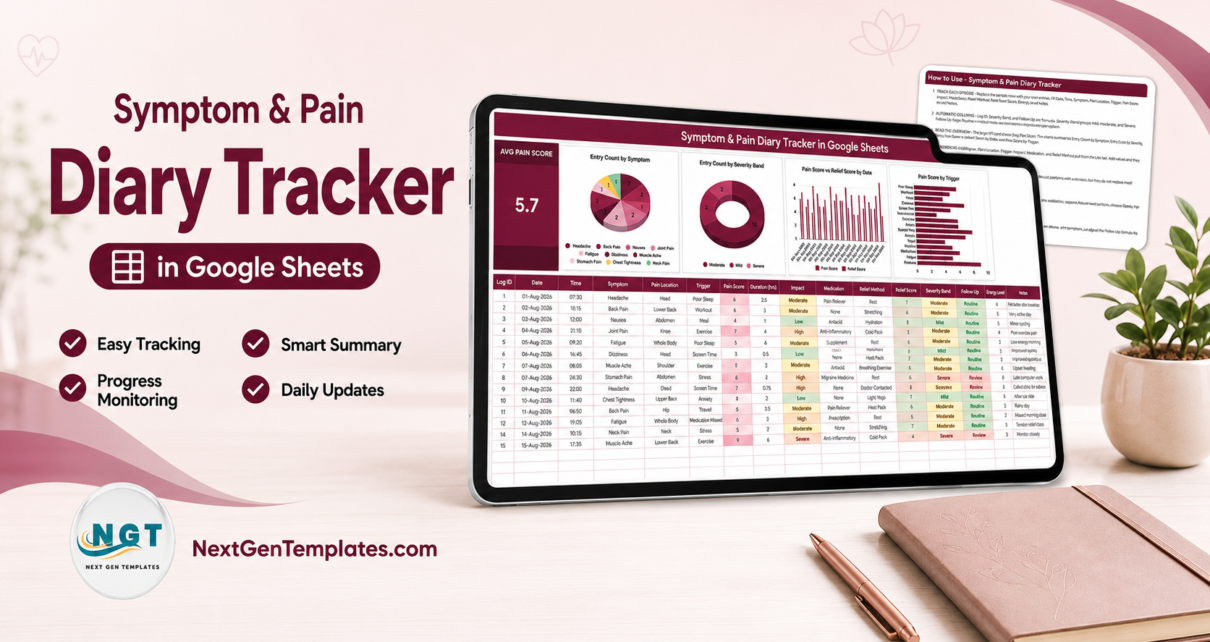
The Symptom & Pain Diary Tracker in Google Sheets is built for exactly that job. One Google Sheet, four tabs, sixteen columns per entry, three columns that calculate themselves, six dropdowns fed from a single editable list, one KPI card and four charts that redraw as you type. Fifteen worked sample rows dated 01-Aug-2026 to 15-Aug-2026 ship with it, so nothing is blank the first time you open it.
Before anything else, the important part. This is a spreadsheet, not medical software. It is not a medical device, it is not diagnostic, and it offers no medical advice. It does not interpret your pain scores, read your symptoms, or suggest what might be causing them. The Severity Band and Follow Up columns are ordinary formulas that group and flag your own typed entries – they are not a clinical assessment. It is not HIPAA- or GDPR-compliant storage, and it does not replace a clinician. If something worries you, speak to a healthcare professional; in an emergency, call your local emergency number.Symptom & Pain Diary Tracker in Google Sheets
Get the Symptom & Pain Diary Tracker in Google Sheets
Key Features of the Symptom & Pain Diary Tracker
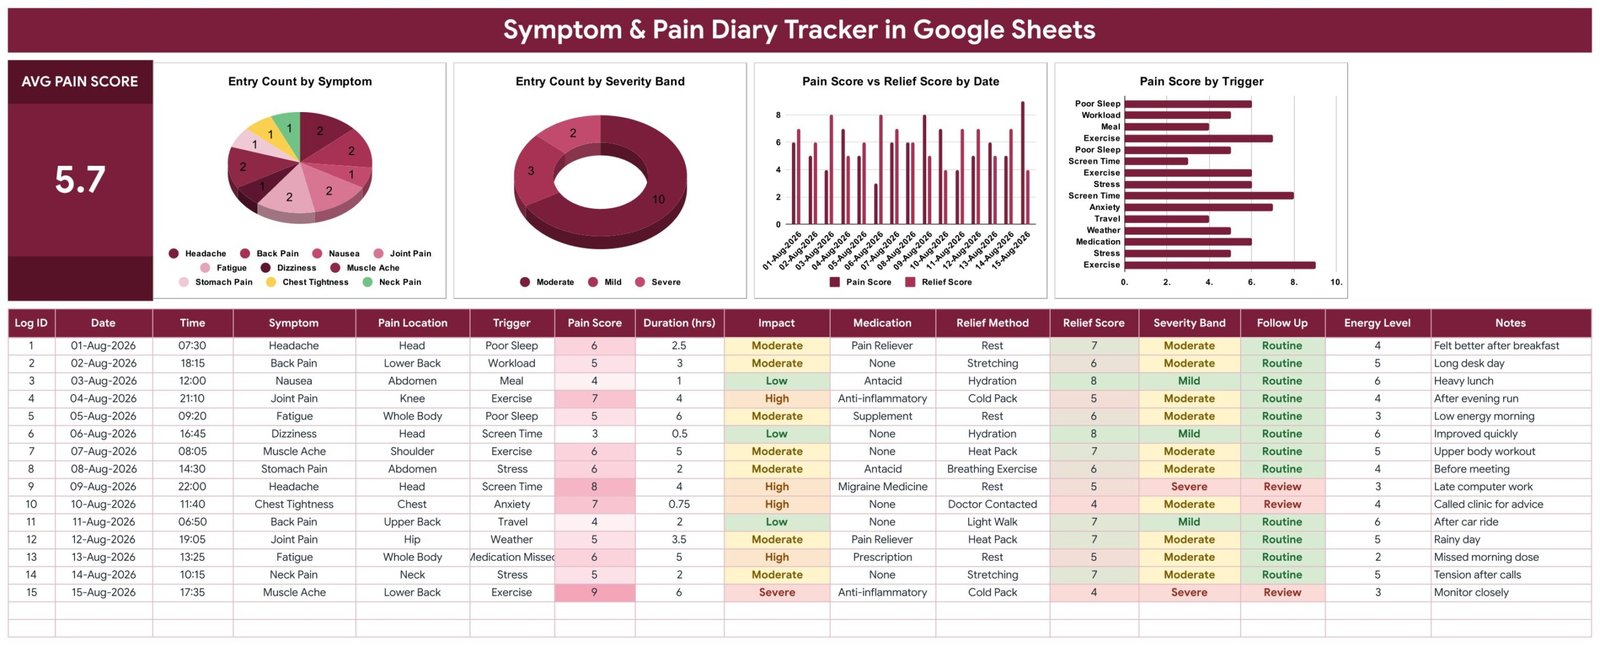
- 16 columns per episode – Log ID, Date, Time, Symptom, Pain Location, Trigger, Pain Score, Duration (hrs), Impact, Medication, Relief Method, Relief Score, Severity Band, Follow Up, Energy Level and Notes.
- Three columns you never touch – Log ID numbers each entry, Severity Band groups the Pain Score you typed into Mild, Moderate or Severe, and Follow Up returns Review or Routine.Symptom & Pain Diary Tracker in Google Sheets
- Six dropdown columns – Symptom, Pain Location, Trigger, Impact, Medication and Relief Method, all reading the List tab.Symptom & Pain Diary Tracker in Google Sheets
- Dropdowns that grow – the List tab is read from row 2 to row 500, so anything you add there appears in the dropdown immediately.Symptom & Pain Diary Tracker in Google Sheets
- Pain and relief logged separately – two independent 1-10 scores, so you can see what you felt next to what you tried.
- One KPI card – Avg Pain Score, which reads 5.7 on the sample data and recalculates on every entry.Symptom & Pain Diary Tracker in Google Sheets
- Four live charts – Entry Count by Symptom, Entry Count by Severity Band, Pain Score vs Relief Score by Date, and Pain Score by Trigger.Symptom & Pain Diary Tracker in Google Sheets
- Conditional colour throughout – Pain Score cells deepen as the number rises, Impact and Severity Band run green to red, Follow Up shows Routine green and Review red.
- Ten seeded values per list – 10 symptoms, 10 pain locations, 10 triggers, 8 medication entries, 10 relief methods and 4 impact levels are already there.Symptom & Pain Diary Tracker in Google Sheets
Inside the Sheet, Tab by Tab
Symptom Diary
The working page, and the one you will live in. The Avg Pain Score card sits top-left, then four charts run across the top: a pie of Entry Count by Symptom, a donut of Entry Count by Severity Band, a two-series column chart of Pain Score vs Relief Score by Date, and a horizontal bar of Pain Score by Trigger. Underneath, the entry table. The fifteen sample rows are recognisable situations rather than filler – a headache after poor sleep, back pain on a long desk day, joint pain after an evening run, fatigue on the day a dose was missed – which makes the intended level of detail obvious before you type anything.
List
Six columns, one per dropdown. Symptom, Pain Location, Trigger, Medication, Relief Method and Impact. This is the only tab you edit to reshape the tracker for your own condition – rename “Chest Tightness”, delete what does not apply, add “Migraine” or “Physio” or “Flare”. The sheet reads down to row 500, so there is a lot of room and no data-validation editing to do.
Instructions
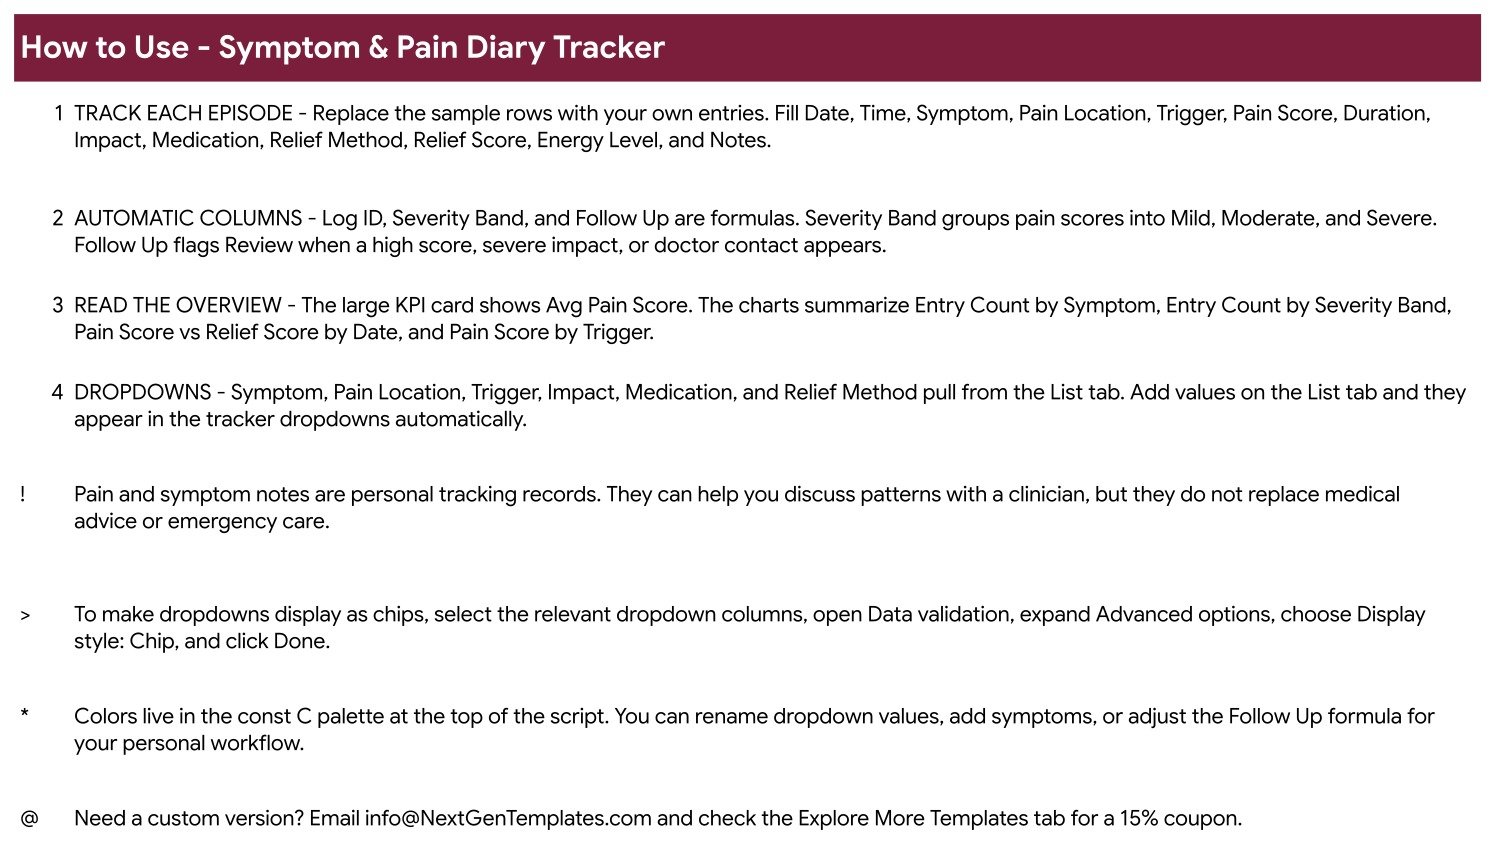
A single screen headed “How to Use”. It covers what to type, which three columns are formulas, how to read the overview, and how the dropdowns work. It also carries the tip for switching dropdowns to Google’s chip display style, a note that the colours and the Follow Up formula are yours to change, and – properly, in the template itself, not just in the marketing – a plain statement that these are personal tracking records that can help you discuss patterns with a clinician but do not replace medical advice or emergency care.
Explore More Templates
A links page with a WELCOME15 coupon for 15% off a future purchase, plus pointers to related trackers and categories.
Symptom & Pain Diary Tracker vs. an Excel Log vs. a Paid Symptom App – Feature Comparison
| This Google Sheets tracker | A do-it-yourself Excel log | A paid symptom-tracking app | |
|---|---|---|---|
| Cost | $6.99 one time | Free, plus your build time | Recurring subscription |
| Platform | Google Sheets, any browser | Excel desktop or Microsoft 365 | The vendor’s app only |
| Setup time | Copy the sheet and start typing | Hours of columns, validation and charts | Sign-up and onboarding |
| Charts already built | 4, wired to the entry table | Build them yourself | The vendor’s fixed views |
| Rename fields and formulas | All of them | All of them | Rarely |
| Share with a link | Yes, standard Sheets sharing | Send the file | Vendor-controlled |
| Mobile access | Google Sheets mobile app | Excel mobile app | Yes |
| Where the data lives | Your own Google Drive | Your own machine | The vendor’s servers |
| Export your history | CSV, XLSX or PDF, any time | Yes | Sometimes, sometimes not |
| Reminders and alerts | None | None | Usually |
Who Should Use This Template
Anyone keeping a personal record between appointments. That includes people living with a long-running pain problem who want more than a mental average; anyone a clinician has asked to “keep a diary for a month”; people trying to see whether screen time, workload, poor sleep or weather line up with their worse days; and carers logging on somebody else’s behalf.
It is not the right tool for a clinic. There are no patient IDs, no access control, no audit trail and no compliance posture, and it should never hold anyone’s records but your own or those of a person who has asked you to keep them. It is also wrong for anyone who needs to be nudged – it sends nothing, ever – or who wants software to tell them what a symptom means.
Real-World Use Cases
Six weeks before a rheumatology follow-up. Priya was asked to keep a diary. She logs joint pain by location and score, tags each entry with a trigger, and prints the Pain Score by Trigger chart the night before. Nothing is diagnosed by the sheet. What changes is that she stops guessing out loud and starts reading from what she actually wrote down at the time.
Headaches and screen time. Daniel records every headache with its duration and the relief method he tried. A month in, the Pain Score vs Relief Score by Date chart shows which methods he logged alongside his lower scores. That is a question worth taking to a GP, not an answer from a spreadsheet – but a specific question beats a vague complaint.
Logging for a parent. Meera puts her father’s own words into the List tab, records episodes as he describes them, and shares the sheet view-only with her sister. Two people, one record, instead of two sets of phone notes that never quite agree.
Advantages of the Symptom & Pain Diary Tracker
- Zero setup friction. Copy link, delete the samples, start logging. There is no schema to design and no chart to build.
- The vocabulary is yours. Because six dropdowns come from one tab, you can rewrite the entire language of the tracker in about two minutes without touching a formula.
- It records relief, not just pain. Most simple diaries capture severity alone. Logging what you tried, and how much it helped, is what makes the history useful later.
- It prints. A one-page PDF of the table and charts is a genuinely better thing to hand across a desk than a phone.
- The data is portable and yours. Export to CSV or XLSX whenever you like; nothing is locked behind a vendor.
- The disclaimer is inside the product. The Instructions tab says plainly what this is and is not, so anyone you share the sheet with sees it too.
Opportunities for Improvement
Three honest limitations, stated so nobody discovers them after buying:
- The sample data uses a symptom the List tab does not seed. Row 14 logs “Neck Pain”, but the ten seeded symptoms are Headache, Back Pain, Joint Pain, Fatigue, Nausea, Dizziness, Stomach Pain, Muscle Ache, Chest Tightness and Anxiety. Add “Neck Pain” to the List tab – or your own wording – and the dropdown carries it. It is a one-cell fix, but it is a real gap.
- Nothing is automated beyond the formulas. No reminders, no notifications, no imports from a wearable, no sync with anything. If you do not open the sheet, nothing is recorded.
- Formula columns need dragging. Log ID, Severity Band and Follow Up are per-row formulas. When you add rows below the sample block, drag those three columns down with them or the new rows come back blank.
Best Practices
- Log at the time, not at the weekend. A diary reconstructed on Sunday is a diary of your Sunday mood. Thirty seconds during the episode is worth more than ten careful minutes later.
- Set up the List tab before the first entry. Changing your vocabulary halfway through splits the charts across two spellings of the same thing.
- Use the score scale consistently. Whatever “6” means to you, keep it meaning that. The charts only compare entries against each other.
- Turn the dropdowns into chips. Select the dropdown columns, open Data validation, expand Advanced options and choose Display style: Chip. Google’s own guide to creating drop-down lists in Sheets covers the same panel if you want to change the ranges too.
- Write the Notes column like a human. “Late computer work”, “after car ride”, “missed morning dose” – those short phrases are what jog the memory months later, and no chart can reconstruct them.
- Export a PDF before each appointment rather than scrolling on a phone in the room.
Explore Relevant Templates
The closest companion is the Lab Results & Health Metrics Tracker in Google Sheets, which holds the numbers that come back from a lab while this one holds how the days actually felt. Alongside them: the Medication & Pill Tracker in Google Sheets for what you take and when, the Blood Pressure Log Tracker, the Blood Sugar (Diabetes) Log Tracker and the Sleep Tracker in Google Sheets for the nights behind the bad days. All of them are personal logs with exactly the same limits described above. The full range sits in Google Sheets Trackers.
Curious how trackers like this are put together? The NextGenTemplates Academy learning paths teach the spreadsheet skills behind them, with practice files.
Get the Symptom & Pain Diary Tracker in Google Sheets
Frequently Asked Questions
Is this medical advice, or a medical device?
No, and no. It is a spreadsheet you type into. It is not a medical device, it is not diagnostic, it gives no medical advice, and it does not interpret your pain scores or symptoms. Severity Band and Follow Up are plain formulas grouping and flagging your own entries – “Review” means a formula matched what you typed, nothing more. It is not HIPAA- or GDPR-compliant storage and it does not replace a clinician. For anything about your actual health, talk to a healthcare professional; in an emergency, call your local emergency number.
Will it remind me to log an entry?
No. It sends no emails, no notifications and no alerts of any kind. Nothing happens unless you open the sheet.
What exactly do I get?
A PDF containing a Google Sheets copy link. Click it and a private, fully editable copy lands in your own Google Drive. There is no add-on to install and no account to create beyond a free Google account.
Can I add my own symptoms, triggers and medications?
Yes, and that is the intended first step. Type them into the List tab; the dropdowns read rows 2 to 500 of that tab, so new values appear straight away.
How many entries can it hold?
Far more than a personal diary needs – it is a normal Google Sheet, so the ceiling is Google’s, not the template’s. Add rows below the last one and drag Log ID, Severity Band and Follow Up down with them.
Does it work on a phone?
Yes, through the Google Sheets mobile app. Typing an entry works well; the four charts are easier to read on a larger screen.
Can I share it with my doctor or a family member?
Yes. Share it view-only with a link, or download it as a PDF for the appointment. Remember that anything you share is a personal record and not a clinical document.
About the Author
Built by PK – Microsoft Certified Professional with 15+ years of Excel, Google Sheets, and Power BI experience. Founder of NextGenTemplates, reaching 300K+ subscribers across YouTube channels. Every template is hand-built and tested before release.
Conclusion
A pain diary only works if keeping it is easier than not keeping it. This one gets there by doing less: six dropdowns so you are picking rather than typing, three formula columns so nothing is arithmetic, one number and four charts so a month of entries has a shape you can see, and four tabs so there is nowhere to get lost. It will not tell you what is wrong, and it does not try to – it just makes sure that when someone qualified asks, you have the real record in front of you instead of a guess.
Get the Symptom & Pain Diary Tracker in Google Sheets for $6.99, and see more Google Sheets walkthroughs on NeoTechNavigators on YouTube.