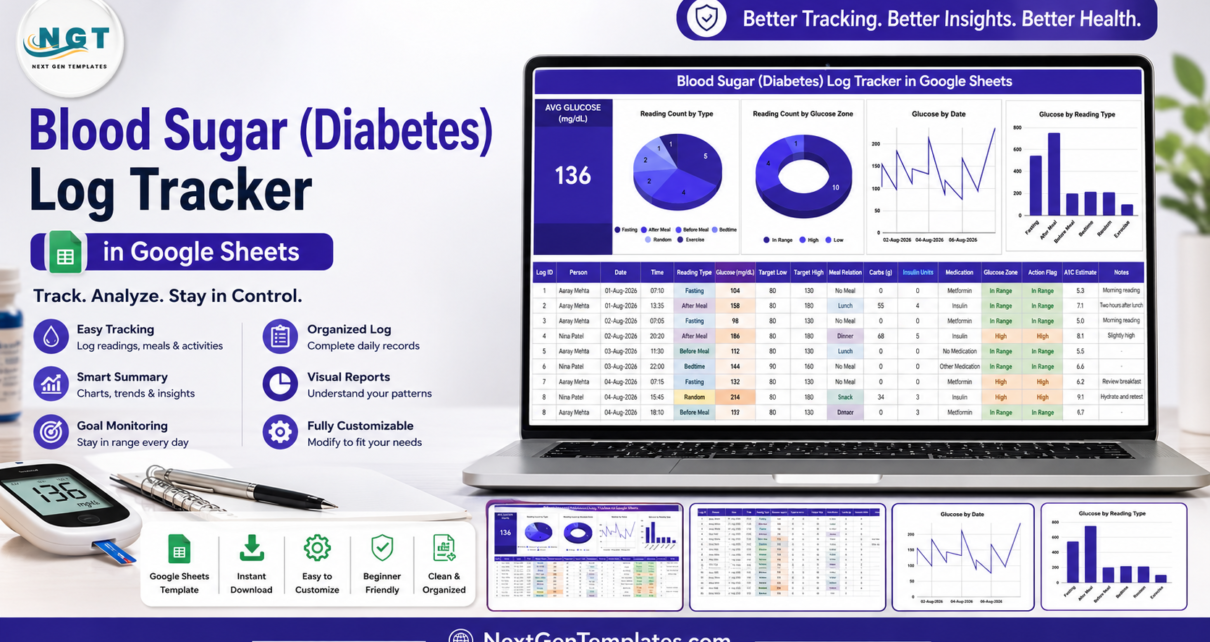
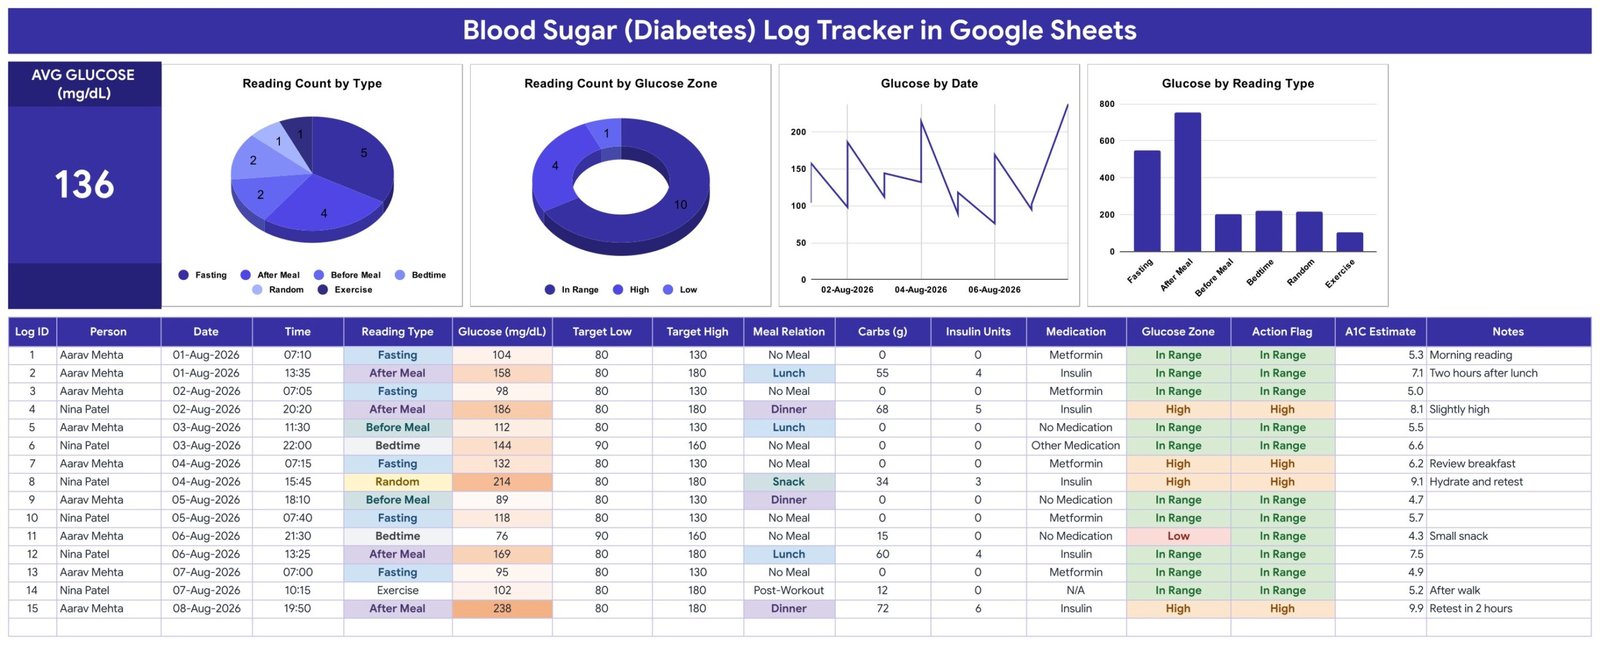
The Blood Sugar (Diabetes) Log Tracker in Google Sheets puts a whole glucose diary on one scrollable sheet: a single AVG GLUCOSE (mg/dL) summary card, 4 charts linked straight to the data, and a 16-column entry table that covers 6 reading types, 5 meal relations and 3 glucose zones. The file ships with 15 demo rows for 2 people and an average of 136 mg/dL so you can see every chart working before you type anything. Setup takes under 10 minutes.
Please read this before anything else. This is a personal record-keeping spreadsheet. It is not a medical device, not a diagnostic tool, not a dosing aid and not a clinical record system, and nothing in it is medical advice. It does not manage, treat or control diabetes. Every target range in the sheet is a number you type in yourself, and every colour is scored against your own entries – not against a clinical guideline. Discuss your readings, your targets and any change to your routine with your doctor, nurse or diabetes educator, and use an authoritative source such as the CDC’s diabetes information rather than a spreadsheet for anything you need to understand about the condition itself.
Get the Blood Sugar (Diabetes) Log Tracker in Google Sheets
Key Features of the Blood Sugar (Diabetes) Log Tracker in Google Sheets
The tracker was built to be readable first. There is one number at the top, four pictures beside it, and everything else is a plain typed table underneath.
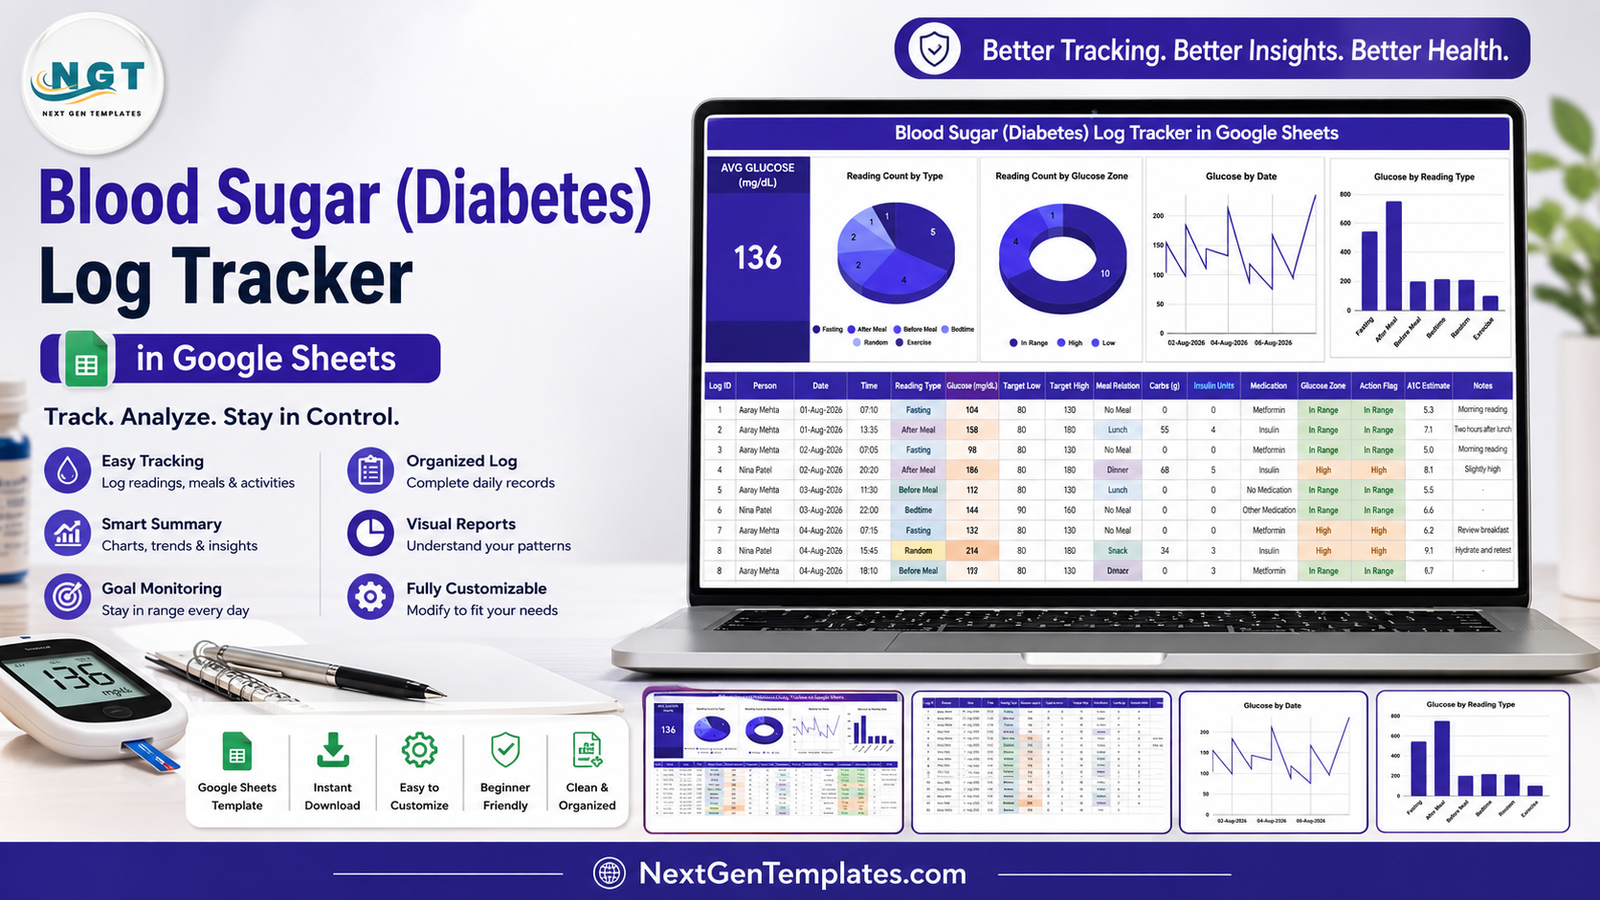
- One summary card. AVG GLUCOSE (mg/dL) averages every reading currently in the log. The shipped sample reads 136 mg/dL across its 15 rows. Add a row and the card moves on its own.
- Four charts, no helper tables. Reading Count by Type, Reading Count by Glucose Zone, Glucose by Date and Glucose by Reading Type all aggregate the log columns directly, so nothing needs refreshing.
- A 16-column entry table. Log ID, Person, Date, Time, Reading Type, Glucose (mg/dL), Target Low, Target High, Meal Relation, Carbs (g), Insulin Units, Medication, Glucose Zone, Action Flag, A1C Estimate and Notes.
- Per-row target ranges. Target Low and Target High are ordinary columns, so a fasting row can carry 80-130 while an after-meal row carries 80-180 – whatever numbers your own clinician gave you.
- Glucose Zone colouring. Each row is reported as In Range, High or Low against that row’s own Target Low and Target High. The colours are your configuration, nothing more.
- Auto-expanding dropdowns. Reading Type (Fasting, After Meal, Before Meal, Bedtime, Random, Exercise), Meal Relation (No Meal, Lunch, Dinner, Snack, Post-Workout) and Medication all read from an editable List sheet, using ordinary Google Sheets data validation.
- Two people in one file. The Person column already carries two names in the sample, which suits a household or a carer keeping a log on someone else’s behalf.
Sheets Explanation
Tracker Sheet: Summary Card, Charts and the Reading Log
The top band holds the AVG GLUCOSE (mg/dL) card next to four charts – a pie for Reading Count by Type, a donut for Reading Count by Glucose Zone, a line for Glucose by Date and a column chart for Glucose by Reading Type. Directly below sits the 16-column entry table where every reading is typed, with the Glucose Zone and Action Flag columns shaded green, orange or red as you go.
List Sheet: The Dropdown Source
A second, deliberately plain sheet holds the option lists behind Reading Type, Meal Relation and Medication. Add your own medication name there and it appears in the dropdown on the next row you fill in, without reopening the data-validation dialog.
Blood Sugar Log Tracker vs. a Microsoft Excel Log vs. a Paid Diabetes App – Feature Comparison
| Feature | Blood Sugar (Diabetes) Log Tracker in Google Sheets | Microsoft Excel blood sugar log | Paid diabetes app (mySugr Pro / Glucose Buddy Premium) |
|---|---|---|---|
| Cost | $6.99 one-time ✅ | One-time, but editing on mobile needs a Microsoft 365 licence | Recurring monthly or annual subscription |
| Platform | Google Sheets – browser, Android and iOS | Excel desktop, mobile app mainly for viewing | Phone app only |
| Setup time | Under 10 minutes ✅ | 10-20 minutes | 5 minutes plus account creation |
| Works without creating a health account | Yes – your own file in your own Drive ✅ | Yes | No – sign-up required |
| Set your own target range per row | Yes – Target Low and Target High are editable columns ✅ | Depends on the file | Usually a single global range |
| Add your own columns and charts | Yes – it is an ordinary spreadsheet ✅ | Yes | No |
| Share with a family member or coach | Yes – a Google Sheets share link ✅ | Email the file | Paid tier or export only |
| Automatic sync from a meter or CGM | No – readings are typed in | No | Yes ✅ |
| Year-1 cost for two people in one household | $6.99 total – one file, two names in the Person column ✅ | One purchase plus any licences you already hold | Twelve months of subscription, often per account |
For anyone who wants a readable, editable log they own outright – and does not need meter auto-sync – the Blood Sugar (Diabetes) Log Tracker in Google Sheets sits in the sweet spot.
Who Should Use This Template
Perfect for:
- People who already test at home and were asked to bring a written log to their next appointment
- Carers and parents keeping a log for someone else, or a household keeping two logs in one file
- Anyone who would rather own a spreadsheet outright than pay a monthly fee for a phone app
- People monitoring over a fixed period – gestational or pre-diabetes monitoring, for example – who want a clean typed record they keep afterwards
Not a fit if:
- You are looking for medical advice, a diagnosis, recommended target ranges or insulin dosing help. None of that is in this template, and none of it should come from a spreadsheet.
- You run a clinic and need a patient record system. This is not an EHR or EMR, it is not HIPAA or GDPR compliant, and it is not encrypted.
- You want readings pulled automatically from a meter or continuous glucose monitor. Every row here is typed by hand.
- You need alerts, reminders or any kind of emergency response. The sheet does nothing when nobody is looking at it.
Real-World Use Cases
Priya was asked to bring two weeks of readings to her next review. She logs a fasting reading each morning and one after her main meal, types the ranges her doctor wrote down into Target Low and Target High, and prints the sheet the night before her appointment – instead of arriving with a camera roll full of meter screens.
Daniel keeps the log for his father. Both names sit in the Person column of the same file, he shares the sheet with his sister so she can add readings on the days she visits, and the Notes column carries the context – “after a long walk”, “missed breakfast” – that a bare number never explains.
Meera is monitoring during pregnancy for a set number of weeks. She wants her own per-row targets and a record she still owns afterwards, so a one-time spreadsheet suits her better than a subscription she plans to cancel in three months.
Advantages of the Blood Sugar (Diabetes) Log Tracker
The clearest advantage is cost shape. A $6.99 one-time purchase covers a household, with no per-account fee and nothing to cancel later. The second is ownership: the file sits in your own Google Drive, under your own account, and you can export it to Excel or PDF whenever you want. Nothing is sent to NextGenTemplates.
The third is honesty of design. Because Target Low and Target High are plain columns rather than baked-in constants, the sheet never puts a number in front of you that somebody else decided. It simply reports whether the reading you typed fell inside the range you typed. That keeps the spreadsheet firmly in the role it should have – recording what happened, so a clinician can interpret it.
Finally, it is fast to live with. One sheet, one card, four charts and a table. There is no pivot to refresh, no macro to enable and no add-on to install, so logging a reading on a phone takes about fifteen seconds.
Opportunities for Improvement
A few things are worth knowing before you buy, and one of them is a genuine bug in the shipped build.
- The Action Flag column does not flag Low readings. In the shipped sample, row 11 records 76 mg/dL against a Target Low of 90: the Glucose Zone column correctly says Low in red, but the Action Flag beside it still says In Range in green. High readings are flagged correctly on every row. Since a low reading is usually the more urgent one, read the Glucose Zone column and not the Action Flag until this is corrected.
- Glucose by Reading Type totals rather than averages. The column chart sums the glucose values in each reading type, so a bar is tall partly because those readings were high and partly because you logged more of them. A copy of the chart switched to an average would be more useful.
- The summary card pools everything. AVG GLUCOSE (mg/dL) averages every row regardless of person, reading type or date, so with two people in the file – or fasting and after-meal readings mixed – it is a combined figure, not a fasting average. Keep one copy per person if you need separate numbers.
- The A1C Estimate column is arithmetic, not a test result. It applies the published eAG conversion, (mg/dL + 46.7) ÷ 28.7, to a single reading. A laboratory HbA1c reflects roughly three months of glucose. Treat the column as a rough scale only.
- There is no date-range or person filter. The charts always show everything in the sheet. Adding a filter view, or simply starting a new copy each quarter, is the practical workaround.
Best Practices
- Delete the 15 demo rows before your first real entry. They belong to two invented people and exist only to show the charts working.
- Type the target ranges your own clinician gave you, and write down in Notes when they change and who changed them.
- Log the reading at the time you take it. Retro-filling a week from memory is where glucose diaries usually go wrong.
- Use the Notes column properly – “walked 40 minutes”, “unwell”, “late dinner”. Context is what makes a log worth reviewing.
- Fill Carbs (g) and Insulin Units only if you already record them. Leaving them at 0 does not break any chart.
- Start a fresh copy each quarter so the charts stay readable and the averages stay meaningful.
- Share the sheet deliberately. Anyone with the link can read every reading, so use view-only sharing and named people rather than a public link.
Explore Relevant Templates
The closest companion is the Blood Pressure Log Tracker in Google Sheets, which uses the same one-sheet layout for systolic, diastolic and pulse readings, and the Medication & Pill Tracker in Google Sheets for keeping the doses themselves in order.
For the habits around the readings, the Calorie & Macro Tracker in Google Sheets covers meals and carbohydrates (read the walkthrough), the Workout Log Tracker in Google Sheets covers activity, the Water Intake Tracker in Google Sheets covers hydration (walkthrough here) and the Sleep Tracker in Google Sheets covers rest (walkthrough here).
If you want weight and measurements alongside, see the Weight Loss Tracker in Google Sheets and the Body Measurements Tracker in Google Sheets. For a multi-page view across several habits at once, the Fitness and Wellness Dashboard in Google Sheets is the step up.
Keeping a log is also a good excuse to sharpen your spreadsheet skills: the NextGenTemplates Academy learning paths build them up step by step, with practice files.
Frequently Asked Questions
Is the Blood Sugar (Diabetes) Log Tracker medical advice or a medical device?
No. The Blood Sugar (Diabetes) Log Tracker in Google Sheets is a personal record-keeping spreadsheet. It is not a medical device, not a diagnostic tool, not a dosing aid and not a clinical record system, and nothing in it should be used to make a treatment decision. Talk to your doctor or diabetes educator.
Where do the target ranges come from?
From you. Target Low and Target High are ordinary editable columns in the Blood Sugar (Diabetes) Log Tracker, and the Glucose Zone colour is scored only against the numbers you type in that row. The template ships no recommended range and takes no position on what yours should be.
Is the A1C Estimate column a real HbA1c result?
No. That column applies the published eAG conversion – (mg/dL + 46.7) ÷ 28.7 – to one reading. A real HbA1c is a laboratory blood test reflecting roughly three months of glucose. Treat the Blood Sugar (Diabetes) Log Tracker’s estimate as a rough arithmetic scale, never as a lab result or a diagnosis.
Can it sync readings from my meter or CGM?
No. Every row in the Blood Sugar (Diabetes) Log Tracker in Google Sheets is typed by hand. If automatic import from a meter or continuous glucose monitor is what you need, a paid diabetes app is the right tool, and this template is not a substitute for it.
How long does setup take?
Under 10 minutes. Make your copy from the link in the PDF, delete the 15 demo rows, edit the List sheet dropdowns to match your own medications, then type your targets into the first row and copy it down. Every card and chart in the Blood Sugar (Diabetes) Log Tracker updates automatically from there.
How does this compare to a paid diabetes app?
A paid diabetes app can pull readings from a meter or CGM automatically, which the Blood Sugar (Diabetes) Log Tracker cannot. What the template gives you instead is a one-time price, per-row target ranges, full editability and a file you own and can export at any time.
Is my data private, and is this HIPAA compliant?
The file lives in your own Google Drive under your own Google account, and no data is sent to NextGenTemplates. It is not encrypted health-record software and it makes no HIPAA or GDPR compliance claim. Anyone you share the link with can read every reading, so share it deliberately.
About the Author
Built by PK – Microsoft Certified Professional with 15+ years of Excel, Google Sheets and Power BI experience. Founder of NextGenTemplates, reaching 300K+ subscribers across YouTube channels. Every template is hand-built and tested before release. PK is not a clinician, and this template offers no medical guidance.
Conclusion
If you test at home and keep losing the readings between appointments, the Blood Sugar (Diabetes) Log Tracker in Google Sheets gives you one sheet that holds them all – a summary card, four charts and a 16-column log with your own targets on every row. It records; it does not interpret, and it is not a substitute for your care team.
Get the Blood Sugar (Diabetes) Log Tracker in Google Sheets
Instant download · One-time payment · No subscription
Last updated: August 2026