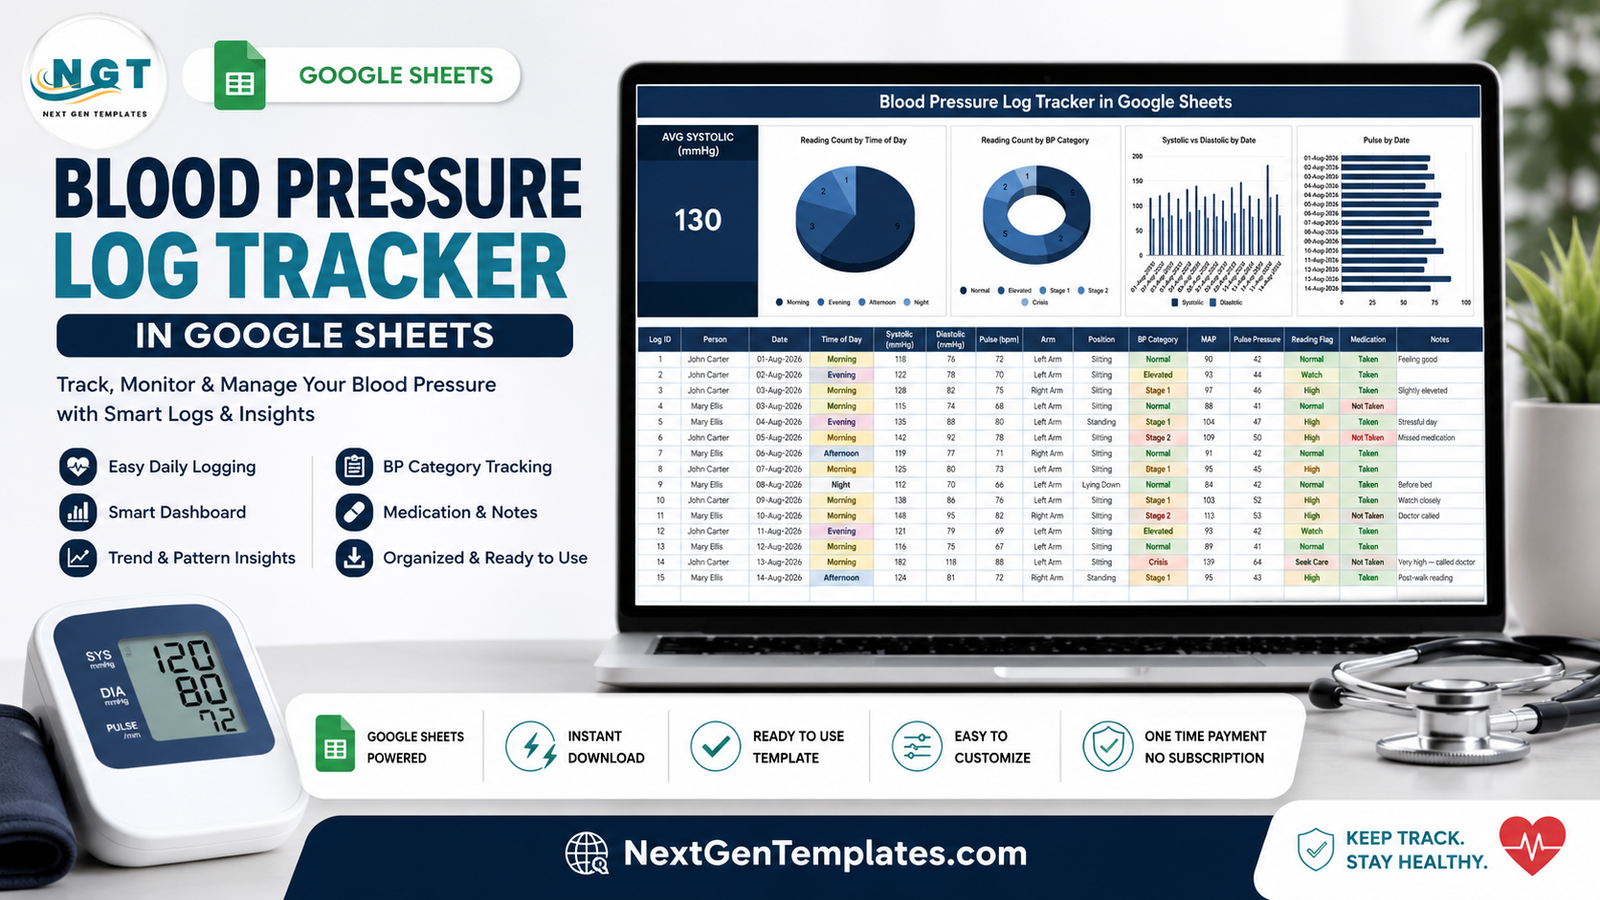
Most people who take blood pressure readings at home end up with them scattered across a notebook, a phone note and the memory of the machine itself. The Blood Pressure Log Tracker in Google Sheets replaces all three with one page: 15 columns, 1 summary card, 4 live charts and 4 tabs, with 15 sample rows to overwrite and room for about 985 readings before anything needs adjusting. Setup is a single click on a Make a copy link.
One thing to be clear about before anything else, because it shapes everything below: this is a personal record book. It is not medical advice, not a diagnostic tool and not a medical device. It does not detect, treat or manage high blood pressure, and it makes no claim to. It writes down numbers you typed and draws charts from them. Every question about what those numbers mean belongs with your doctor.
Get the Blood Pressure Log Tracker in Google Sheets
Key Features of Blood Pressure Log Tracker in Google Sheets
- Everything on one tab. The card, the charts and the full reading table live on a single page called Blood Pressure Log. There is no navigation to learn.
- An Average Systolic (mmHg) card. One large number averaging the Systolic column across every row you have entered. The demo data shows 130.
- Four charts wired to the table. Reading Count by Time of Day, Reading Count by BP Category, Systolic vs Diastolic by Date, and Pulse by Date.
- No helper tables anywhere. Each chart reads rows 16 to 1000 of the data columns directly, so a new row shows up in the charts as you type it.
- Five self-filling columns. Log ID, BP Category, MAP, Pulse Pressure and Reading Flag are plain spreadsheet formulas.
- Four dropdown columns fed by a List tab. Time of Day, Arm, Position and Medication read rows 2 to 500 of their list column, so new options appear without re-doing any validation rules.
- A Person column. Two people can keep one shared log, or you delete the column and track only yourself.
- A Notes column. Free text per row for the context you will not remember later.
- One colour block. The whole palette sits in a
const C = {...}definition, so re-theming is one edit.
Inside the Tracker: Tab-by-Tab
Tab 1 – Blood Pressure Log
The working page. Above the table sits the Average Systolic card and the four charts. Below it, the reading table runs 15 columns wide: Log ID, Person, Date, Time of Day, Systolic (mmHg), Diastolic (mmHg), Pulse (bpm), Arm, Position, BP Category, MAP, Pulse Pressure, Reading Flag, Medication and Notes. You type into nine of them at most; five calculate and one is optional.
Tab 2 – List
Four short columns holding the dropdown options: Time of Day (Morning, Afternoon, Evening, Night), Arm (Left Arm, Right Arm), Position (Sitting, Standing, Lying Down) and Medication (Taken, Not Taken, N/A). Because the validation rules point at rows 2 to 500, anything you add appears in the dropdown straight away. Google’s own data validation documentation covers how those rules work if you want to extend them.
Tab 3 – Instructions
A ten-line walkthrough: how to enter a reading, what each calculated column does, how to switch the dropdowns to coloured chips, and where the colours live.
Tab 4 – Explore More Templates
A short list of related sheets from the same library, plus a 15% coupon code.
A word about the category and flag columns
The BP Category and Reading Flag columns group your own entries under named bands so a long log is quicker to scan. That is all they do. A label produced by a spreadsheet formula on numbers you typed is not an assessment of your health, and it should not be read as one. If the labels are not useful to you, delete the formulas – the rest of the sheet carries on working.
Blood Pressure Log Tracker in Google Sheets vs. Excel vs. a Paid Health App – Feature Comparison
| This template (Google Sheets) | A DIY Excel log | Subscription health app | |
|---|---|---|---|
| Cost | One payment | Free, if you build it yourself | $5-$15 per month |
| Platform | Any browser, plus the free Sheets app | Excel desktop or Microsoft 365 | The vendor’s phone app |
| Setup time | About 2 minutes | An evening of formulas and charts | Account sign-up |
| Real-time sharing with family | Yes, by link | Only through OneDrive co-authoring | Usually a paid family tier |
| Mobile access | Yes, free | Yes, with limited charting | Yes |
| Customisable columns | All of them | Yes, you built it | Rarely |
| Share with a link | Yes | No, you send a file | Export only |
| Year-1 cost for a household of 5 | One payment, shared | $0 plus your time | $60-$180 |
| Charts included | 4, already built | Build your own | Fixed, vendor’s choice |
| Where the data lives | Your Google Drive | Your PC | The vendor’s servers |
Who Should Use This Template
It suits anyone who already takes readings at home and just wants them written down properly: people asked to bring a few weeks of numbers to an appointment, households where one person logs on behalf of another, and anyone who prefers a file they own to an account they rent.
It is the wrong tool if you want something that interprets readings for you, connects to a monitor over Bluetooth, or serves as a clinical record for other people. There is no device integration – every reading is typed by hand – and the sheet makes no compliance claim of any kind, HIPAA included. It is not patient-record software and should not be used as any part of one.
Real-World Use Cases
Morning and evening, three weeks running. Priya was asked to bring home readings to her next appointment. Two rows a day for three weeks gives her 42 rows, one printable page, and no scrolling through a phone in a waiting room.
Logging on someone else’s behalf. Daniel’s father reads his numbers over the phone; Daniel types them into a shared copy. The Person column keeps the two sets apart in the same table and in the charts.
Keeping context, not just numbers. Farah fills the Notes column with what was different that day and uses the Medication column to record whether she took her usual dose. When she is asked about the last month, she has a factual record rather than a recollection.
Advantages of the Blood Pressure Log Tracker in Google Sheets
- Almost nothing to set up. Copy the sheet, overwrite 15 sample rows, start typing.
- The charts maintain themselves. No pivot refresh, no helper ranges, no named ranges to extend.
- Consistent entries. Four dropdown columns mean “Left Arm” is never also “left” or “L”.
- Portable. Open it on a phone at the kitchen table, print the page as a PDF for an appointment.
- Yours. The file sits in your Drive, under your account, with no vendor between you and it.
- Editable end to end. Rename columns, add your own, change the palette, rebuild a chart. Nothing is protected.
Opportunities for Improvement
Being honest about the edges is more useful than pretending there are none.
- Manual entry only. No monitor sync, no import, no OCR of a monitor screen.
- The coloured chips need a ten-second manual step. Google does not let a script set the chip display style, so you set it once yourself on columns D, H, I and N via Data > Data validation > Advanced options.
- One summary card. The card averages Systolic only; if you want an average Diastolic or Pulse card as well, you add it.
- The charts are date-ordered, not smoothed. There is no rolling average built in – straightforward to add with a formula column if you want one.
- Roughly 985 rows before you extend. Plenty for years of twice-daily logging, but worth knowing the number.
Best Practices
- Log at a consistent time. Comparable rows make a more useful record, and the Time of Day column exists precisely so you can see whether you have been consistent.
- Fill the Notes column while you remember. “Right after a walk” is the kind of context that turns a number into something worth discussing.
- Keep the Person column if anyone else might use the sheet. Merging two people’s readings after the fact is tedious.
- Print or export before an appointment. One page, in your hand, beats a phone screen.
- Share deliberately. Anyone with the link can read the sheet. Give it to the people who should have it and no one else – and see Google’s file sharing guidance for the exact permission settings.
- Take the questions to a professional. The sheet organises your readings. It does not interpret them, and neither should you rely on it to.
Explore Relevant Templates
The same one-page format runs across a small family of personal logs: the Weight Loss Tracker in Google Sheets, the Sleep Tracker in Google Sheets, the Water Intake Tracker in Google Sheets, the Body Measurements Tracker in Google Sheets and the Daily Steps Tracker in Google Sheets. If you also log a daily reading of a different kind, the Blood Sugar (Diabetes) Log Tracker in Google Sheets is the nearest relative to this one, and the Medication & Pill Tracker in Google Sheets handles the doses this sheet only records as Taken or Not Taken. For a broader view, the Fitness and Wellness Dashboard in Google Sheets moves from a log to a dashboard.
Get the Blood Pressure Log Tracker in Google Sheets
Prefer to understand the spreadsheet mechanics behind a log like this? The NextGenTemplates Academy learning paths take you through them step by step with practice files.
Frequently Asked Questions
Is this medical advice or a medical device?
No, to both. It is a spreadsheet for recording readings you took yourself. It does not diagnose, treat, monitor or manage any condition, and it must not be used as a medical device. Talk to a doctor or pharmacist about your readings.
What do the category and flag labels actually mean?
They mean a formula has grouped your typed numbers into named bands so the log is easier to read. They are not a clinical assessment and carry no medical weight. You can edit or remove them.
Does it connect to my blood pressure monitor?
No. You read the numbers off your monitor and type them in – about fifteen seconds per reading.
Do I need a paid Google account?
No. A free account is enough. Click the link in the PDF, make your copy, and the sheet is yours.Blood Pressure Log Tracker in Google Sheets
Can more than one person use the same sheet?
Yes. The Person column separates entries and the charts count every row. Delete the column if you track only yourself.Blood Pressure Log Tracker in Google Sheets
Who can see my readings?
Only the people you share the file with. It lives in your own Google Drive under your own account. No compliance certification of any kind is claimed, HIPAA included, and the template is not intended to hold other people’s health records.Blood Pressure Log Tracker in Google Sheets
Can I change the columns and colours?
Yes – it is an ordinary Google Sheet. Add columns, rename headers, recolour from the const C block, or rebuild any chart.Blood Pressure Log Tracker in Google Sheets
About the Author
Built by PK – Microsoft Certified Professional with 15+ years of Excel, Google Sheets, and Power BI experience. Founder of NextGenTemplates, reaching 300K+ subscribers across YouTube channels. Every template is hand-built and tested before release.Blood Pressure Log Tracker in Google Sheets
Conclusion
A blood pressure log only works if it is easy enough that you keep filling it in. This one asks for six typed values and a couple of dropdowns per reading, then does the arithmetic, the labelling and the charting itself – on one page you can print. It is a record book, not a health assistant: it never interprets a reading, and the conversation about what your numbers mean belongs with your doctor.Blood Pressure Log Tracker in Google Sheets
Get the Blood Pressure Log Tracker in Google Sheets from NextGenTemplates, open the PDF, click Make a copy, and log your first reading in about two minutes. For more Google Sheets walkthroughs, subscribe to NeoTechNavigators on YouTube.Blood Pressure Log Tracker in Google Sheets